SuperTrend Indicator for MT5
- 지표
- Vijaykumar Jayantilal Panchal
- 버전: 1.1
- 업데이트됨: 10 11월 2022
- 활성화: 5
Supertrend는 Olivier Sebam이 트레이더가 추세를 식별하고 금융 자산을 매매할 시기를 알 수 있도록 돕기 위해 위에서 언급한 바와 같이 개발한 비교적 인기 없는 기술 지표입니다. 표시기는 TradingView 및 MetaTrader에서 기본값으로 찾을 수 없습니다. 그러나 시장에서 맞춤형 Supertrend 지표를 찾을 수 있습니다.
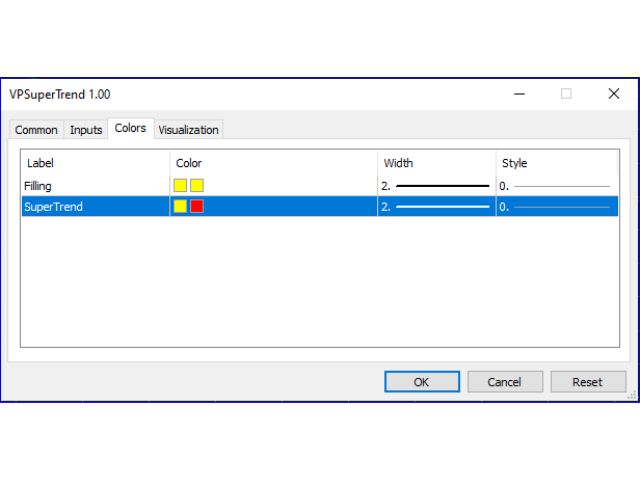
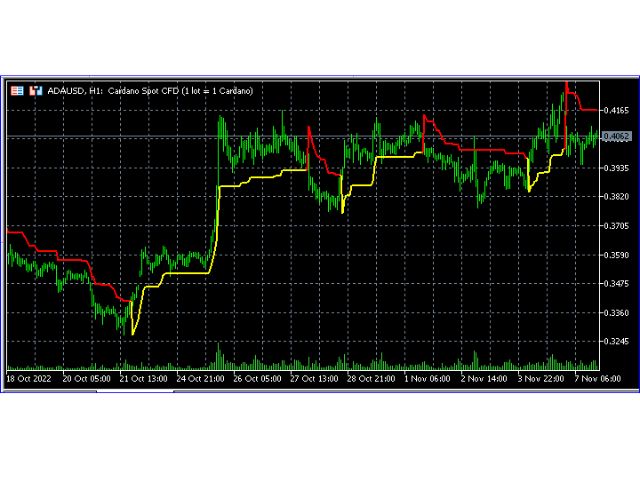
차트에 적용하면 슈퍼트렌드 표시기가 두 가지 색상으로 표시됩니다. 변경할 수 있지만 기본 색상은 일반적으로 빨간색과 녹색입니다. 녹색이면 자산을 매수하라는 신호이고 빨간색이면 자산을 매도하라는 신호입니다.
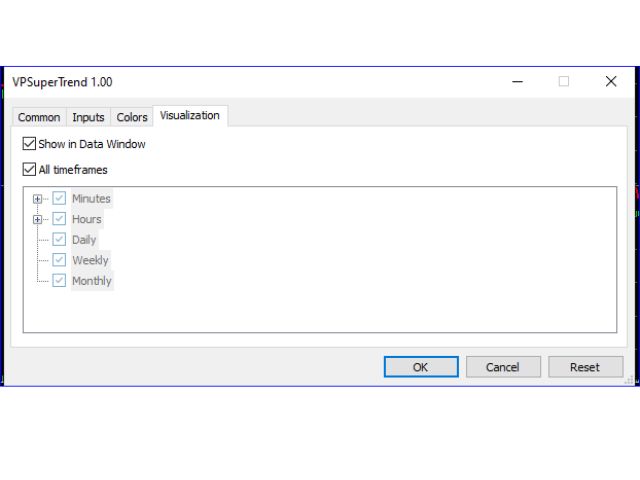
슈퍼트렌드 표시기는 모든 타임라인에서 잘 작동합니다. 일간 및 주간 차트와 같이 5분 또는 더 긴 차트와 같이 더 짧은 기간에 작동할 수 있습니다.
매수 및 매도 신호 식별
위에 표시된 것처럼 매수 및 매도 신호는 슈퍼트렌드 지표에 잘 표시됩니다. 가격이 지표의 녹색 부분 위로 움직일 때 매수 신호가 나타납니다.
반면에 표시기의 빨간색 부분 아래로 이동하면 매도 신호가 나타납니다. 그러나 다중 기간 분석을 수행하면 최상의 지지 및 저항 수준을 식별하는 데 도움이 됩니다.
Supertrend 지표의 장점과 단점
Supertrend Indicator의 장점은 다음과 같습니다.
해석하기 쉬움: 초보자도 계산이 그리 복잡하지 않습니다.
예측은 상당히 정확합니다. Supertrend가 사용 가능한 가장 신뢰할 수 있는 지표 중 하나인 추세 시장에서 특히 그렇습니다.
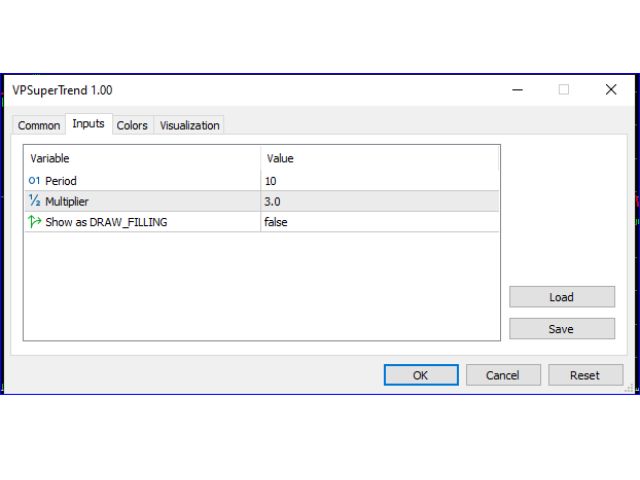
간편한 구성: 입력 변수의 수가 적기 때문에 거래자의 요구 사항에 맞게 쉽게 조정할 수 있습니다.
관련 비용 없음: 많은 무료 플랫폼에서 사용할 수 있으며 지표를 구현하는 데 추가 소프트웨어 또는 추가 기능이 필요하지 않습니다.
높은 응답성: 추세의 변화를 빠르게 감지하여 기회가 오는 즉시 기회를 활용하려는 트레이더에게 매우 편리합니다.
사용의 일반적인 단점은 다음과 같습니다.
통합 기간 동안 정확하지 않음: 시장이 횡보 추세일 때 Supertrend 라인은 잘못된 신호를 생성할 수 있습니다.
결과는 다른 도구와 모순될 수 있습니다. 이는 거래 결정에 도움이 되지 않을 수 있는 대조적인 결과를 산출할 수 있습니다.
모든 자산에서 잘 작동하지 않을 수 있음: 거래자는 지표를 사용하기 전에 특정 자산에서 지표가 신뢰할 수 있는지 확인해야 합니다. 신호가 강할 수 있지만 모든 자산에 적용되는 것은 아닙니다.