• 미리보기
  • 리뷰 (3)
  • 코멘트 (5)
  • 새 소식

Symbol Overlay

5
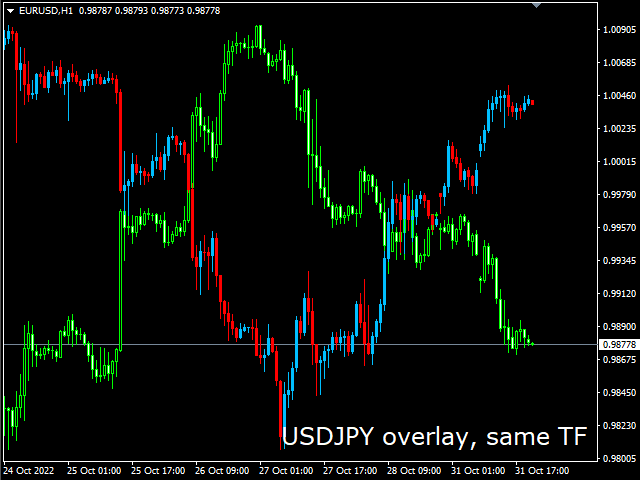
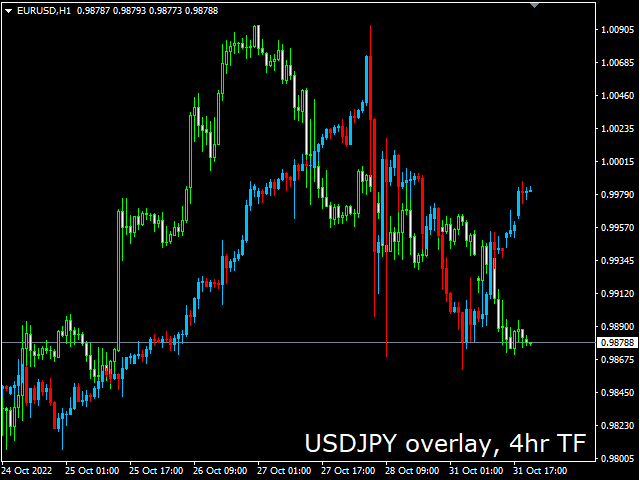
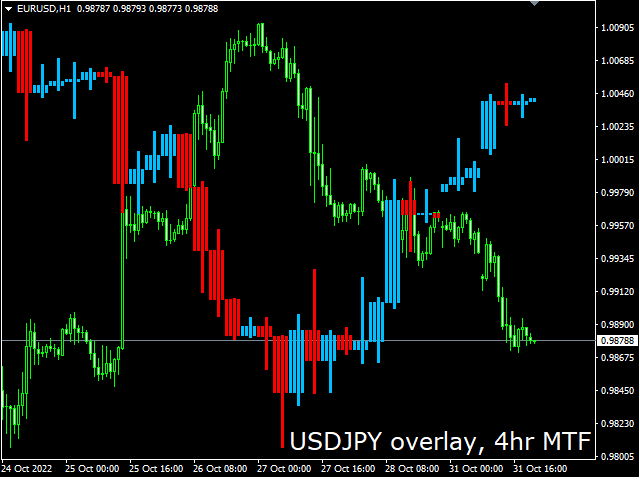
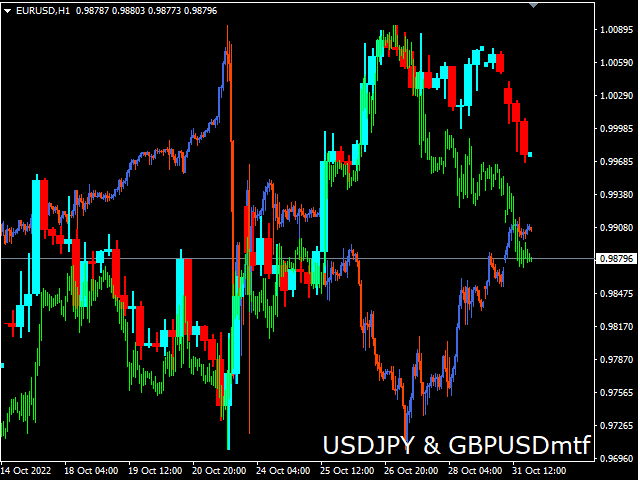
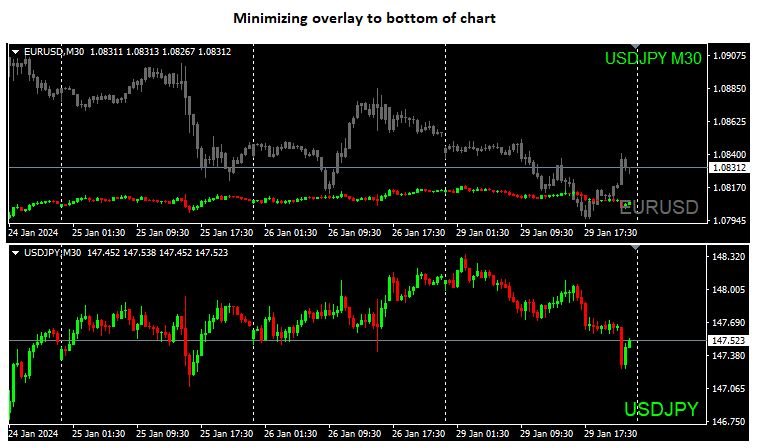
This indicator plots another symbol on the current chart. A different timeframe can be used for the symbol, with an option to display in multiple timeframe mode (1 overlay candle per several chart candles). Basic indicators are provided. To adjust scaling of prices from different symbols, the overlay prices are scaled to the visible chart price space.


Features

  • symbol and timeframe input
  • MTF display
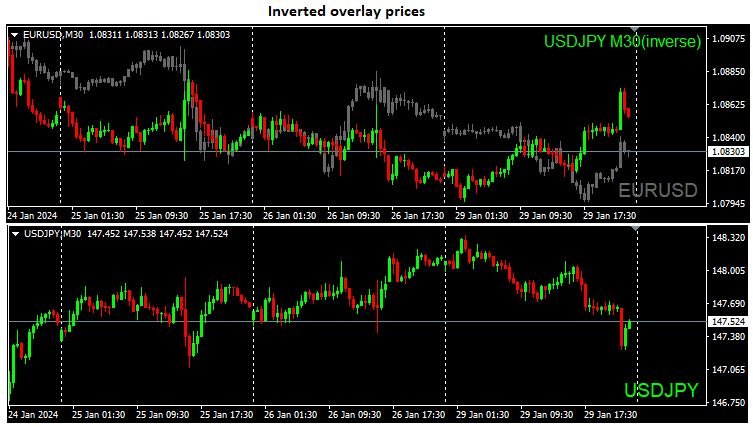
  • option to vertically invert chart, eg overlay USDJPY, invert to show JPYUSD
  • data window values; open, high, low, close
  • option to show Bid/Ask levels
  • multiple loadings supported


리뷰 3
varon
528
varon 2024.02.28 11:45 
 

Thank you very much! This is the best indicator! With everything that I need, mirror, bid-ask, line-chart etc! 10 stars from 5!!!

Sergei Kiriakov
1757
Sergei Kiriakov 2023.12.13 12:08 
 

this is the best overlay indicator

추천 제품
BoxInside MT4
Evgeny Shevtsov
4.86 (7)
This indicator calculates the volume profile and places labels that correspond to the VAH, VAL and POC levels, for each candle individually. Indicator operation features The indicator works on the timeframes from M5 to MN, but it uses the history data of smaller periods: M1 - for periods from M5 to H1, M5 - for the H4 period, M30 - for the D1 period, H4 - for the W1 period, D1 - for the MN period. The color and location of the VAL, VAH and POC labels on the current candle are considered to be c
FREE
Cumulative Delta MT4
Evgeny Shevtsov
4.86 (29)
The indicator analyzes the volume scale and splits it into two components - seller volumes and buyer volumes, and also calculates the delta and cumulative delta. The indicator does not flicker or redraw, its calculation and plotting are performed fairly quickly, while using the data from the smaller (relative to the current) periods. The indicator operation modes can be switched using the Mode input variable: Buy - display only the buyer volumes. Sell - display only the seller volumes. BuySell -
FREE
IceFX VelocityMeter
Norbert Mereg
4.67 (3)
IceFX VelocityMeter is a very unique indicator on MetaTrader 4 platform which measures the speed of the forex market. It's not a normal volume or other measurement indicator because IceFX VelocityMeter is capable to understand market speed movements which are hidden in ticks and those valuable information cannot be read in an ordinary way from the candles. The software monitors the received ticks (frequency, magnitude of change) within a specified time range, analyzes these info and defines, dis
FREE
Market Profile 3
Hussien Abdeltwab Hussien Ryad
3 (2)
Market Profile 3 MetaTrader 4 indicator  — is a classic Market Profile implementation that can show the price density over time, outlining the most important price levels, value area, and control value of a given trading session. This indicator can be attached to timeframes between M1 and D1 and will show the Market Profile for daily, weekly, monthly, or even intraday sessions. Lower timeframes offer higher precision. Higher timeframes are recommended for better visibility. It is also possible t
FREE
Simple QM Pattern
Suvashish Halder
Simple QM Pattern is a powerful and intuitive trading indicator designed to simplify the identification of the Quasimodo (QM) trading pattern. The QM pattern is widely recognized among traders for effectively signaling potential reversals by highlighting key market structures and price action formations. This indicator helps traders easily visualize the QM pattern directly on their charts, making it straightforward even for those who are new to pattern trading. Simple QM Pattern includes dynamic
FREE
Forex Market Profile and Vwap
Lorentzos Roussos
4.8 (5)
외환 시장 프로필(줄여서 FMP) 이것이 아닌 것 : FMP는 일반적인 문자 코드 TPO 표시가 아니며 전체 차트 데이터 프로필 계산을 표시하지 않으며 차트를 기간으로 분할하여 계산하지도 않습니다. 그것이 하는 일: 가장 중요한 것은 FMP 표시기가 사용자 정의 스펙트럼의 왼쪽 가장자리와 사용자 정의 스펙트럼의 오른쪽 가장자리 사이에 있는 데이터를 처리한다는 것입니다. 사용자는 마우스로 표시기의 양쪽 끝을 당기기만 하면 스펙트럼을 정의할 수 있습니다. 표시기 오른쪽 가장자리가 라이브 막대로 당겨지고 더 멀리(미래로) 표시되면 표시기가 "라이브"로 간주됩니다(새 막대로 업데이트됨). 표시기는 첨부된 차트에 "앵커" 개체를 놓은 다음 해당 앵커를 하드 드라이브의 파일과 연결합니다. 이렇게 하면 차트 또는 지표가 닫힐 때까지 다시 시작해도 설정이 유지되어 차트에서 계속 FMP를 실행할 수 있습니다. FMP 지표는 하나의 차트에서 여러 인스턴스를 실행할 수 있으며 이름을 지정할 수
FREE
This indicator will mirror the assets in use in another metatrader, being able to choose the timeframe and a template. This is the Metatrader 4 Client, it needs the Metatrader 4 or 5 Server versions: Metatrader 4 Mirror Chart Server: https://www.mql5.com/en/market/product/88644 Metatrader 5 Mirror Chart Server:   https://www.mql5.com/en/market/product/88652 Details of how it works in the video.
FREE
AQ XFifteen
HIT HYPERTECH INNOVATIONS LTD
4 (7)
Χ15 indicator is a MetaTrader 4 tool that allows you to BUILD & BACKTEST ON REAL TIME your own strategies quickly, easily and efficiently. It contains 15 of the most popular technical analysis indicators that you can use, each one in a different way. Choose the indicators that you want to use, select how you will use them and you will see on the chart BUY (green) and SELL (red) arrows implementing your strategy. Choose Take Profit and Stop Loss and you will see the results of your strategy with
FREE
Highlights trading sessions on the chart The demo version only works on the AUDNZD chart!!! The full version of the product is available at: (*** to be added ***) Trading Session Indicator displays the starts and ends of four trading sessions: Pacific, Asian, European and American. the ability to customize the start/end of sessions; the ability to display only selected sessions; works on M1-H2 timeframes; The following parameters can be configured in the indicator: TIME_CORRECTION = Correct
FREE
Tick
Andrej Nikitin
4.5 (2)
A simple tick indicator of Bid and Ask prices. The period separator (1 minute) is displayed as a histogram. Parameters Price_levels_count - number of price levels to be displayed. Bar_under_calculation - number of bars of the indicator to be displayed on the chart.
FREE
The indicator displays price distribution on a horizontal histogram. Horizontal histogram help find out key levels of price so that you can make good decision on setting point of take profit, stop loss... You can improve exist trading strategy or get new trading idea with the histogram of price. Outstanding features Support multiple time frame : you can choose to work with history data in any time frame you want. It does not depend on current display time frame. Support weighting by volume and/
FREE
Pips forex
Andrey Kozak
Pips forex - is a ready trading system . This indicator shows with arrows on the chart when and in what direction you need to open an order. If the arrow is green, then we open a buy deal, and if the arrow is red, then we open a sell deal. Everything is very simple and quite effective. TakeProfit set 15-25 points. StopLoss set at the level of points. When the dots move, we immediately override the StopLoss. Recommended timeframe for trading M1 and M5. This is a scalping strategy and works best
Tick Speed Free
John Louis Fernando Diamante
5 (1)
Tick Speed Free povides a on-chart label of tick speed to allow you to see the ebb and flow of market activity. Observing rises and falls in tick speed may allow you to better time entries to reduce slippage and re-quotes. Options include: - colores for low-mid-high tick speeds - placement and styling - prefix & suffix to customise the speed label Troubleshooting: - Note, in the tester environment, tick timings are limited to what is supplied by the tester environment and it's speed - If there
FREE
The indicator analyzes the change in the minimum and maximum prices of the previous bars fixing the entrance of the big players. If the change (delta) increases, a signal is displayed on the graph in the form of an arrow. At the same time, virtual trade on history is carried out. In the free version, virtual trade is performed without refills in case of a repeat of the signal. The results of virtual trading in the form of losses / losses, profitability, drawdown and transaction lines are display
FREE
Pin Bars
Yury Emeliyanov
5 (3)
주요 목적:"핀 바"는 금융 시장 차트에서 핀 바를 자동으로 감지하도록 설계되었습니다. 핀 바는 특징적인 몸체와 긴 꼬리를 가진 촛불로,추세 반전 또는 교정을 신호 할 수 있습니다. 작동 원리:표시기는 차트의 각 촛불을 분석하여 촛불의 몸,꼬리 및 코의 크기를 결정합니다. 미리 정의 된 매개 변수에 해당하는 핀 막대가 감지되면 표시기는 핀 막대의 방향(강세 또는 약세)에 따라 위 또는 아래 화살표로 차트에 표시합니다. 매개 변수: 꼬리의 길이와 핀 바의 몸체 크기 사이의 최소 비율을 정의합니다. "코"와 핀 바의 꼬리 사이의 최대 허용 비율을 설정합니다. 화살표 크기-표시된 핀 막대와 차트에서 핀 막대를 가리키는 화살표 사이의 거리를 정의합니다. 신청:"핀 바"표시기는 잠재적 인 추세 반전 지점을 식별하고 시장 또는 가까운 위치에 진입하기 위해 신호를 생성하는 데 사용할 수 있습니다. 올바르게 사용하고 다른 기술 지표 및 분석 방법과 결합하면이 지표는 거래 결과를 향상시킬 수
FREE
High Low Open Close MT4
Alexandre Borela
4.8 (20)
이 프로젝트를 좋아한다면 5 스타 리뷰를 남겨주세요. 이 지표는 열리고, 높은, 낮은 및 마감 가격을 지정합니다. 기간과 그것은 특정한 시간대를 위해 조정될 수 있습니다. 이들은 많은 기관 및 전문가에 의해 보는 중요한 수준입니다 상인은 당신이 더 많은 것일 수있는 장소를 알고 도움이 될 수 있습니다 이름 * 사용 가능한 기간: 이전 날. 이전 주. 지난 달. 이전 분기. 이전 연도. 또는: 현재 날. 현재 주. 현재 달. 현재 분기. 현재 년.
FREE
Supply Demand MT4
Agus Santoso
4 (1)
무료 MT4 지표: https://www.mql5.com/en/market/product/125434 무료 MT4 어시스턴트: https://www.mql5.com/en/market/product/107986 이 무료 도구가 마음에 드셨다면 5점 만점에 5점을 주세요! 정말 감사합니다 :) 랠리 베이스 랠리(RBR), 드롭 베이스 랠리(DBR), 드롭 베이스 드롭(DBD), 랠리 베이스 드롭(RBD), 공정 가치 갭(FVG)/불균형, 숨겨진 베이스 "공급 수요 MT4" 지표를 소개합니다. 정확하고 확신을 가지고 역동적인 금융 시장을 탐색하기 위한 최고의 도구입니다. 이 최첨단 지표는 거래자에게 공급 및 수요 역학에 대한 실시간 통찰력을 제공하여 정보에 입각한 의사 결정을 내리고 거래 잠재력을 극대화하도록 세심하게 설계되었습니다. 주요 기능: 자동화된 존 식별: 이 지표는 고급 알고리즘을 사용하여 가격 차트에서 주요 공급 및 수요 존을 자동으로 감지하고 표시합니다. 이러한 존에는
FREE
The Day Scalping System
Anton Iudakov
3 (5)
Scalping indicator. It takes into account volatility, price movement in the local interval and the direction of the current trend. Recommended timeframe - M5. Advantages: Low volatility when a signal appears ensures minimal movement against an open position. The indicator does not redraw its signals. There are alert signals. It is a great tool for day trading. Settings: Name Description Period Indicator period Range of each bar in the period (pp.) The maximum size of each candle in the indicato
FREE
Zig Zag 123
Stephen Reynolds
Zig Zag 123 tells us when a reversal or continuation is more likely by looking at the shift in supply and demand. When this happens a signature pattern appears known as 123 (also known ABC) will often break out in direction of higher low or lower high. Stop loss and take profit levels have been added. There is a panel that shows the overall performance of your trades for if you was to use these stop loss and take profit levels.  We get alerted if a pattern 123 appears and also if the price re
FREE
MACD plus TDI
Devy Tanusukma
Moving Average Convergence Divergence (MACD) combined with Traders Dynamic Index (TDI) Input parameters: signal mode: true if you want to plug it into STAT (Signal Tester and Trader) arrow shift: distance between TDI line to arrow on chart middle band: use middle band (middle bolinger band) signal filter price line: use 50 price line signal filter RSI period RSI price method volatility period moving average RSI period moving average signal period moving average method use MACD indicator fast MAC
FREE
Pips Hunter PRO MT4
Rodrigo Arana Garcia
핍스 헌터 프로는 수년에 걸쳐 개발되었으며 이전 버전보다 개선된 버전입니다. 이 강력한 지표는 시장과 가격 이력을 분석하여 매수 및 매도 항목을 생성합니다. 이러한 항목의 계산을 위해 함께 작동하는 다양한 지표와 덜 유리한 항목을 필터링하고 제거하는 복잡한 통계 로그를 사용합니다 / MT5 버전 . 특징 다시 칠하지 않음 이 인디케이터는 새 데이터가 도착해도 값이 변경되지 않습니다 지연 없음  이 표시기는 지연되지 않습니다 거래 쌍 모든 외환 쌍  (가급적 EURGBP) 타임프레임  모든 차트주기 매개변수 ===== 표시 ===== 화살표 거리 // 신호(화살표)와 캔들스틱 사이의 거리 ===== 알림 ===== 팝업 알림 // MT4 터미널용 알림 푸시 알림 알림 // 휴대폰용 알림 이메일 알림 // 이메일 알림 ===== 차트 설정 ===== 차트에서 캔들 스틱의 색상을 변경하는 옵션 경고 저는 MQL5.com에서만 제품을 판매합니다. 누군가 내
FREE
MarketProfile EForex
Veridiana Adorno Kendrick
Market Profile Shows where the price has spent more time, highlighting important levels that can be used in trading. It is a powerful tool which is designed to take the fundamental components which comprise every market; price/volume/time, and visually display their relationship in real-time as the market develops for a pre-determined time period. Very powerful tool!
The indicator allows you to trade binary options. The recommended time frame is М1 and the expiration time is 1,2,3 minutes. The indicator suitable for auto and manual trading. A possible signal is specified as a arrows above/under a candle. You should wait until the candle closes! Arrows are not re-painted Trade sessions: TOKYO section (Half-end) Currency pairs: USD/JPY Working time frame: M1 Expiration time: 1,2,3 minutes. The indicator also shows good results when using the martingale strateg
FREE
Cumulative Volume Bands
Thalles Nascimento De Carvalho
CVB Cumulative Volume Bands: 누적 거래량으로 트레이드를 강화하세요! CVB Cumulative Volume Bands 는 누적 거래량에 기반한 정확한 신호를 찾는 트레이더를 위해 설계된 고급 지표입니다. 이 지표는 누적 거래량 밴드를 사용하여 시장의 매수 및 매도 압력을 명확하게 읽고, 반전 및 강력한 가격 변동을 식별하는 데 도움을 줍니다. Cumulative Volume Bands for MT5 ! 주요 특징: 누적 거래량 분석 : 거래량을 기반으로 주요 압력 지점을 감지합니다. 명확한 진입/퇴출 신호 : 실시간으로 기회를 포착하세요. 쉬운 해석 : 사용자 친화적인 인터페이스와 간단한 시각적 표현. 모든 자산 및 시간 프레임에 적합 : 모든 시장에서 언제든지 사용 가능합니다. CVB Cumulative Volume Bands 로 한 발 앞서 나가며 자신감을 가지고 트레이딩 결정을 개선하세요! 피드백
FREE
Extremum Reverse Bar
Yurij Izyumov
2.8 (5)
This indicator has been created for finding the probable reversal points of the symbol price. A small candlestick reversal pattern is used it its operation in conjunction with a filter of extremums. The indicator is not redrawn! If the extremum filter is disabled, the indicator shows all points that have a pattern. If the extremum filter is enabled, the condition works – if the history Previous bars 1 candles back contains higher candles and they are farther than the Previous bars 2 candle, such
FREE
Please note: This demo will work only on EURUSD live chart. It will not run in the strategy tester. ChartTrader is a professional trading tool that every trader needs in their toolbox. It has been developed to work with the MetaTrader 4 platform. ChartTrader offers a number of options to make placing orders in the Forex market quick and easy. The GUI sits on the chart window, so there is no need to navigate to separate windows when placing orders. The program allows you to set pending and insta
FREE
Running multiple EA's on your account and confused by who's winning and who's loosing? Try this indicator that report's in real time on the Magic Numbers in your account by reading the History_trades along with the Open_trades. Note: Manual trades are grouped under Magic Number "0". For a better visual report,  run it on a symbol that you don't execute trades on, switch the history bars to "Line Charts" and set it's color to Black.
FREE
Spike Bar
Cuong Le Van
5 (1)
Concept: This indicator will help you find Spike Bar. 1/ Check Yesterday Range (Open-Close )  2/ Check Today pips:   Price from Daily Open to current price (Bid/Ask) Then alert for you  when the pips range of current candle is equal to or greater than the user defined minimum range. This indicator is related to Strategy: Daily Range Spike and Pull Back, you can find it on FFX forum
FREE
하모닉 패턴은 시장 반전점을 예측하는 데 가장 적합합니다. 이러한 패턴은 높은 승률과 하루 동안 다양한 거래 기회를 제공합니다. 저희 인디케이터는 하모닉 트레이딩 문헌에 기반하여 가장 인기 있는 하모닉 패턴을 식별합니다. 중요 사항: 이 인디케이터는 다시 그리지 않으며 (D 지점에서 패턴을 감지함), 따라잡지 않습니다 (패턴이 유효하거나 취소됨). 사용 방법: MT5 차트에 인디케이터를 끌어다 놓으세요. 패턴 감지를 TRUE로 설정하세요 (ABCD; Gartley). 원하는대로 편차를 조정하세요 (높은 편차는 더 많은 패턴, 낮은 편차는 더 적은 패턴). 색상을 원하는 대로 사용자 정의하세요. 필요에 따라 ENTRY POINT, TP 및 SL에 대한 경고를 활성화하거나 비활성화하세요. 패턴 감지 시: 알고리즘은 D 지점에서 패턴을 감지합니다. 경고가 활성화되어 있으면 패턴 감지에 대한 알림을 보냅니다. 패턴이 무효화되면 "패턴 취소"라는 메시지가 포함된 경고가 트리거됩니다. 성공적인
FREE
Rainbow MT4
Jamal El Alama
Rainbow MT4 is a technical indicator based on Moving average with period 34 and very easy to use. When price crosses above MA and MA changes color to green, it’s a signal to buy. When price crosses below MA and MA changes color to red, it’s a signal to sell. The Expert advisor ( Rainbow EA MT4) based on Rainbow MT4 indicator, as you can see in the short video below is now available here .
FREE
이 제품의 구매자들이 또한 구매함
Gann Made Easy
Oleg Rodin
4.8 (117)
Gann Made Easy 는 mr.의 이론을 사용하여 최고의 거래 원칙을 기반으로 하는 전문적이고 사용하기 쉬운 Forex 거래 시스템입니다. W.D. 간. 이 표시기는 Stop Loss 및 Take Profit Levels를 포함하여 정확한 BUY 및 SELL 신호를 제공합니다. PUSH 알림을 사용하여 이동 중에도 거래할 수 있습니다. 구매 후 연락주세요! 내 거래 팁과 훌륭한 보너스 지표를 무료로 공유하겠습니다! 아마도 Gann 거래 방법에 대해 이미 여러 번 들었을 것입니다. 일반적으로 Gann의 이론은 초보자 거래자뿐만 아니라 이미 거래 경험이 있는 사람들에게도 매우 복잡한 것입니다. Gann의 거래 방식은 이론적으로 적용하기 쉽지 않기 때문입니다. 나는 그 지식을 연마하고 Forex 지표에 최고의 원칙을 적용하기 위해 몇 년을 보냈습니다. 표시기는 적용하기가 매우 쉽습니다. 차트에 첨부하고 간단한 거래 권장 사항을 따르기만 하면 됩니다. 지표는 지속적으로 시장 분석 작업
현재 20% 할인 ! 초보자 또는 전문가 트레이더를 위한 최고의 솔루션! 이 대시보드 소프트웨어는 28개의 통화 쌍에서 작동합니다. 2가지 주요 지표(Advanced Currency Strength 28 및 Advanced Currency Impulse)를 기반으로 합니다. 전체 Forex 시장에 대한 훌륭한 개요를 제공합니다. 고급 통화 강도 값, 통화 이동 속도 및 모든(9) 시간대의 28 Forex 쌍에 대한 신호를 보여줍니다. 추세 및/또는 스캘핑 기회를 정확히 파악하기 위해 차트의 단일 지표를 사용하여 전체 시장을 볼 수 있을 때 거래가 어떻게 개선될지 상상해 보십시오! 잠재적인 거래를 식별하고 확인하면서 강력한 통화와 약한 통화를 더욱 쉽게 식별할 수 있도록 이 지표에 기능을 내장했습니다. 이 표시기는 통화의 강세 또는 약세가 증가 또는 감소하는지 여부와 모든 시간대에서 수행되는 방식을 그래픽으로 보여줍니다. 추가된 새로운 기능은 현재 시장 조건 변화에 적응하는
Scalper Inside PRO
Alexey Minkov
4.76 (63)
!SPECIAL SALE! An exclusive indicator that utilizes an innovative algorithm to swiftly and accurately determine the market trend. The indicator automatically calculates opening, closing, and profit levels, providing detailed trading statistics. With these features, you can choose the most appropriate trading instrument for the current market conditions. Additionally, you can easily integrate your own arrow indicators into Scalper Inside Pro to quickly evaluate their statistics and profitability
Cycle Maestro
Stefano Frisetti
NOTE: CYCLEMAESTRO is distributed only on this website, there are no other distributors. Demo version is for reference only and is not supported. Full versione is perfectly functional and it is supported CYCLEMAESTRO , the first and only indicator of Cyclic Analysis, useful for giving signals of TRADING, BUY, SELL, STOP LOSS, ADDING. Created on the logic of Serghei Istrati and programmed by Stefano Frisetti ; CYCLEMAESTRO is not an indicator like the others, the challenge was to interpret only t
Gold Stuff
Vasiliy Strukov
4.86 (257)
Gold Stuff는 금을 위해 특별히 설계된 추세 지표이며 모든 금융 상품에서도 사용할 수 있습니다. 표시기가 다시 그려지지 않고 지연되지 않습니다. 권장 기간 H1. 표시기에서 완전 자동 Expert Advisor EA Gold Stuff를 작동합니다. 내 프로필에서 찾을 수 있습니다. 설정 및 개인 보너스를 받으려면 구매 후 즉시 저에게 연락하십시오!   강력한 지원 및 트렌드 스캐너 표시기의 무료 사본을 받으실 수 있습니다. 메시지를 보내주세요. 나!   설정 화살표 그리기 - 켜기 끄기. 차트에 화살표 그리기. 경고 - 가청 경고를 끕니다. 이메일 알림 - 켜기 끄기. 이메일 알림. Puch-notification - 켜기 끄기. 푸시 알림. 다음으로 색 영역을 조정합니다. Gold Stuff는 금을 위해 특별히 설계된 추세 지표이며 모든 금융 상품에서도 사용할 수 있습니다. 표시기가 다시 그려지지 않고 지연되지 않습니다. 권장 기간 H1. 표시기에서 완전 자동
Golden Trend Indicator
Noha Mohamed Fathy Younes Badr
5 (10)
Golden Trend indicator  is The best indicator for predicting trend movement this indicator never lags and never repaints and never back paints    and give  arrow buy and sell    before the candle appear  and it will help you and  will make your trading decisions clearer its work on all currencies and  gold and crypto and all time frame This unique  indicator uses very secret algorithms to catch the  trends, so you can trade using this indicator and see the trend clear on charts  manual guide and
GOLD Impulse with Alert
Bernhard Schweigert
4.6 (10)
이 지표는 Advanced Currency IMPULSE with ALERT  +   Currency Strength Exotics  의 2가지 제품의 슈퍼 조합입니다. 그것은 모든 시간 프레임에 대해 작동하며 8개의 주요 통화와 하나의 기호에 대한 강약의 충동을 그래픽으로 보여줍니다! 이 표시기는 금, 이국적인 쌍, 상품, 지수 또는 선물과 같은 기호에 대한 통화 강도 가속을 표시하는 데 특화되어 있습니다. 금, 은, 오일, DAX, US30, MXN, TRY, CNH 등의 진정한 통화 강도 가속(충동 또는 속도)을 표시하기 위해 9번째 줄에 모든 기호를 추가할 수 있습니다. 새로운 기본 알고리즘을 기반으로 구축되어 잠재적인 거래를 훨씬 더 쉽게 식별하고 확인할 수 있습니다. 이는 통화의 강세 또는 약세가 가속되는지 여부를 그래픽으로 표시하고 가속 속도를 측정하기 때문입니다. 자동차의 속도계처럼 생각하면 됩니다. 가속화할 때 Forex 시장에서 동일한 일이 분명히 더 빠르
Dynamic Forex28 Navigator
Bernhard Schweigert
5 (5)
Dynamic Forex28 Navigator - 차세대 외환 거래 도구. 현재 49% 할인. Dynamic Forex28 Navigator는 오랫동안 인기 있는 지표의 진화형으로, 세 가지의 힘을 하나로 결합했습니다. 고급 통화 Strength28 지표(695개 리뷰) + 고급 통화 IMPULSE with ALERT(520개 리뷰) + CS28 콤보 신호(보너스). 지표에 대한 자세한 정보 https://www.mql5.com/en/blogs/post/758844 차세대 Strength 지표는 무엇을 제공합니까?  원래 지표에서 좋아했던 모든 것이 새로운 기능과 더 높은 정확도로 강화되었습니다. 주요 기능: 독점적인 통화 Strength 공식.  모든 시간대에 걸쳐 부드럽고 정확한 강도선. 추세와 정확한 진입을 식별하는 데 이상적입니다. 역동적인 시장 피보나치 수준(시장 피보나치).  이 지표에만 있는 고유한 기능. 가격 차트가 아닌 통화 강도에 피보나치가 적용됩니다.
M1 Arrow
Oleg Rodin
5 (17)
시장의 두 가지 기본 원칙에 기반한 일중 전략. 알고리즘은 추가 필터를 사용하여 거래량 및 가격 파동 분석을 기반으로 합니다. 지표의 지능형 알고리즘은 두 가지 시장 요인이 하나로 결합될 때만 신호를 제공합니다. 지표는 더 높은 시간 프레임의 데이터를 사용하여 M1 차트에서 특정 범위의 파도를 계산합니다. 그리고 파동을 확인하기 위해 지표는 볼륨 분석을 사용합니다. 이 표시기는 준비된 거래 시스템입니다. 트레이더가 필요로 하는 모든 것은 신호를 따르는 것입니다. 또한 지표는 자신의 거래 시스템의 기초가 될 수 있습니다. 거래는 분 차트에서만 수행됩니다. 지표가 MTF 원리를 사용한다는 사실에도 불구하고 지표 알고리즘은 가능한 한 안정적입니다. 구매 후 반드시 저에게 편지를 보내주세요! 내 거래 설정 및 권장 사항을 공유하겠습니다!
Trend Screener
STE S.S.COMPANY
4.78 (93)
트렌드 표시기, 트렌드 트레이딩 및 필터링을 위한 획기적인 고유 솔루션, 하나의 도구 안에 내장된 모든 중요한 트렌드 기능! Forex, 상품, 암호 화폐, 지수 및 주식과 같은 모든 기호/도구에 사용할 수 있는 100% 다시 칠하지 않는 다중 시간 프레임 및 다중 통화 표시기입니다. 기간 한정 특가: 지원 및 저항 스크리너 지표는 단 100달러에 평생 제공됩니다. (원래 가격 50 달러) (제안 연장) Trend Screener는 차트에 점이 있는 화살표 추세 신호를 제공하는 효율적인 지표 추세 추종 지표입니다. 추세 분석기 표시기에서 사용할 수 있는 기능: 1. 트렌드 스캐너. 2. 최대 이익 분석이 있는 추세선. 3. 추세 통화 강도 측정기. 4. 경고가 있는 추세 반전 점. 5. 경고가 있는 강력한 추세 점. 6. 추세 화살표 Trend Screener Indicator가 있는 일일 분석 예, 일일 신호 성능...등은 여기에서 찾을 수 있습니다.   여기를 클릭하십시오. L
Algo Pumping MT4
Ihor Otkydach
5 (5)
PUMPING STATION – 당신만을 위한 올인원(All-in-One) 전략 PUMPING STATION은 당신의 외환 거래를 더욱 흥미롭고 효과적으로 바꿔줄 혁신적인 인디케이터입니다. 단순한 보조 도구가 아니라, 강력한 알고리즘을 갖춘 완전한 거래 시스템으로서 보다 안정적인 트레이딩을 시작할 수 있도록 도와줍니다. 이 제품을 구매하시면 다음의 혜택을   무료로   받으실 수 있습니다: 전용 설정 파일: 자동 설정으로 최대의 퍼포먼스를 제공합니다. 단계별 동영상 가이드: PUMPING STATION 전략으로 거래하는 법을 배워보세요. Pumping Utility: PUMPING STATION과 함께 사용하도록 설계된 반자동 거래 봇으로, 거래를 더욱 쉽고 편리하게 만들어줍니다. ※ 구매 후 바로 저에게 메시지를 보내주세요. 추가 자료에 대한 접근 권한을 제공해드립니다. PUMPING STATION은 어떻게 작동하나요? 트렌드 컨트롤: 시장의 추세 방향을 즉시 파악합니다. 추세는
Enigmera
Ivan Stefanov
5 (7)
ENIGMERA: 시장의 핵심 중요: MQL5.com의 데모는 Strategy Tester에서 실행되며 Enigmera의 기능을 완전히 반영하지 못할 수 있습니다. 설명, 스크린샷 및 비디오를 확인하여 자세한 내용을 확인하십시오. 질문이 있으면 언제든지 메시지를 보내주세요! 인디케이터의 코드는 완전히 다시 작성되었습니다. 버전 3.0은 새로운 기능을 추가하고 인디케이터가 처음 출시된 이후 누적된 버그를 수정했습니다. 소개 이 인디케이터 및 거래 시스템은 금융 시장에 대한 주목할 만한 접근 방식입니다. ENIGMERA는 프랙탈 주기를 사용하여 정확하게 지원 및 저항 수준을 계산합니다. 실제 축적 단계를 보여주고 방향과 목표를 제공합니다. 트렌드와 수정 모두에서 작동하는 시스템입니다. 작동 방식 인디케이터의 대부분의 기능은 차트 왼쪽에 있는 버튼을 통해 제어되며, 이를 통해 다양한 시장 상황에 빠르게 대응할 수 있습니다. 버튼 ON/OFF – 인디케이터 전체를 표시하거나 숨깁니다.
Easy Breakout
Mohamed Hassan
5 (11)
After your purchase, feel free to contact me for more details on how to receive a bonus indicator called VFI, which pairs perfectly with Easy Breakout for enhanced confluence!   Easy Breakout is a powerful price action trading system built on one of the most popular and widely trusted strategies among traders: the Breakout strategy ! This indicator delivers crystal-clear Buy and Sell signals based on breakouts from key support and resistance zones. Unlike typical breakout indicators, it levera
IX Power MT4
Daniel Stein
4.78 (9)
IX Power: 지수, 원자재, 암호화폐 및 외환 시장 통찰력을 발견하세요 개요 IX Power 는 지수, 원자재, 암호화폐 및 외환 시장의 강도를 분석할 수 있는 다목적 도구입니다. FX Power 는 모든 가용 통화 쌍 데이터를 사용하여 외환 쌍에 대해 가장 높은 정확도를 제공하는 반면, IX Power 는 기초 자산 시장 데이터에만 초점을 맞춥니다. 이로 인해 IX Power 는 비외환 시장에 이상적이며, 다중 쌍 분석이 필요하지 않은 간단한 외환 분석에도 신뢰할 수 있는 도구입니다. 모든 차트에서 매끄럽게 작동하며, 거래 결정을 향상시키기 위한 명확하고 실행 가능한 통찰력을 제공합니다. 1. IX Power가 트레이더에게 유용한 이유 다양한 시장 강도 분석 • IX Power 는 지수, 원자재, 암호화폐 및 외환 심볼의 강도를 계산하여 각 시장에 맞는 통찰력을 제공합니다. • US30, WTI, 금, 비트코인 또는 통화 쌍과 같은 자산을 모니터링하여 거래 기회를 발견
Stratos Pali
Michela Russo
5 (2)
Stratos Pali Indicator   is a revolutionary tool designed to enhance your trading strategy by accurately identifying market trends. This sophisticated indicator uses a unique algorithm to generate a complete histogram, which records when the trend is Long or Short. When a trend reversal occurs, an arrow appears, indicating the new direction of the trend. Important Information Revealed Leave a review and contact me via mql5 message to receive My Top 5 set files for Stratos Pali at no cost! Dow
FX Power MT4 NG
Daniel Stein
4.94 (18)
FX Power: 통화 강세 분석으로 더 스마트한 거래 결정을 개요 FX Power 는 어떤 시장 상황에서도 주요 통화와 금의 실제 강세를 이해하기 위한 필수 도구입니다. 강한 통화를 매수하고 약한 통화를 매도함으로써 FX Power 는 거래 결정을 단순화하고 높은 확률의 기회를 발견합니다. 트렌드를 따르거나 극단적인 델타 값을 사용해 반전을 예측하고자 한다면, 이 도구는 귀하의 거래 스타일에 완벽히 적응합니다. 단순히 거래하지 말고, FX Power 로 더 스마트하게 거래하세요. 1. FX Power가 거래자에게 매우 유용한 이유 통화와 금의 실시간 강세 분석 • FX Power 는 주요 통화와 금의 상대적 강세를 계산하고 표시하여 시장 역학에 대한 명확한 통찰력을 제공합니다. • 어떤 자산이 앞서고 있고 어떤 자산이 뒤처지는지 모니터링하여 보다 현명한 거래 결정을 내릴 수 있습니다. 포괄적인 멀티 타임프레임 뷰 • 단기, 중기 및 장기 타임프레임에서 통화와 금의 강세를
TPSproTREND PrO
Roman Podpora
4.68 (25)
VERSION MT5        —        ИНСТРУКЦИЯ RUS           —        INSTRUCTIONS  ENG 주요 기능: 렌더링 없이 정확한 입력 신호! 신호가 나타나면 관련성은 유지됩니다! 이는 신호를 제공한 후 변경하여 예금 자금 손실을 초래할 수 있는 다시 그리기 지표와의 중요한 차이점입니다. 이제 더 큰 확률과 정확도로 시장에 진입할 수 있습니다. 화살표가 나타난 후 목표에 도달(이익실현)하거나 반전 신호가 나타날 때까지 캔들을 색칠하는 기능도 있습니다. STOP LOSS / TAKE PROFIT 구역 표시 진입점 검색 시 시각적 명확성을 높이기 위해 시장 진입을 위한 최적 지점이 검색되는 BUY/SELL 영역을 초기에 표시하는 모듈을 만들었습니다. 정지 손실 수준 작업을 위한 추가 지능형 논리는 시간이 지남에 따라 크기를 줄이는 데 도움이 되므로 거래에 들어갈 때 초기 위험을 줄이는 데 도움이 됩니다(move sl). 더 높은 기간의 MI
RelicusRoad Pro
Relicus LLC
4.63 (104)
이제 $ 147 (몇 가지 업데이트 후 $ 499 증가) - 무제한 계정 (PCS 또는 MACS) RelicusRoad 사용 설명서 + 교육 비디오 + 비공개 Discord 그룹 액세스 + VIP 상태 시장을 보는 새로운 방법 RelicusRoad는 외환, 선물, 암호화폐, 주식 및 지수에 대한 세계에서 가장 강력한 거래 지표로서 거래자에게 수익성을 유지하는 데 필요한 모든 정보와 도구를 제공합니다. 우리는 초보자부터 고급까지 모든 거래자가 성공할 수 있도록 기술적 분석 및 거래 계획을 제공합니다. 미래 시장을 예측할 수 있는 충분한 정보를 제공하는 핵심 거래 지표입니다. 우리는 차트에서 말이 안 되는 여러 지표 대신 완전한 솔루션을 믿습니다. 타의 추종을 불허하는 매우 정확한 신호, 화살표 + 가격 조치 정보를 표시하는 올인원 표시기입니다. 강력한 AI를 기반으로 하는 RelicusRoad는 누락된 정보와 도구를 제공하여 교육하고 성공적인 트레이더인 트레이딩 전문가가 되도
Scalper Vault
Oleg Rodin
5 (29)
Scalper Vault 는 성공적인 스캘핑에 필요한 모든 것을 제공하는 전문 스캘핑 시스템입니다. 이 표시기는 외환 및 바이너리 옵션 거래자가 사용할 수 있는 완전한 거래 시스템입니다. 권장 시간 프레임은 M5입니다. 시스템은 추세 방향으로 정확한 화살표 신호를 제공합니다. 또한 상단 및 하단 신호와 Gann 시장 수준을 제공합니다.  이 시스템은 사용하기가 매우 쉽습니다. 원하는 시장 지역의 화살표만 따라가면 됩니다. 엑시트는 가격이 적정 수준에 도달하거나 시장의 고점 또는 저점 신호가 나타날 때 수행됩니다.  표시기는 PUSH 알림을 포함한 모든 유형의 경고를 제공합니다. 인디케이터 구매 후 연락주세요. 내 개인 거래 권장 사항과 훌륭한 보너스 지표를 무료로 공유합니다! 나는 당신에게 행복하고 유익한 거래를 기원합니다!
Chart Patterns All in One
Davit Beridze
4.68 (19)
"Chart Patterns All in One"을 데모 모드에서 사용해보고 보너스를 받아보세요. 데모 모드에서 사용해본 후 메시지를 보내주시면 보너스를 드립니다. 구매 후 댓글을 남기시면 고품질의 인디케이터 8개를 보너스로 받으실 수 있습니다. Chart Patterns All-in-One 지표는 트레이더가 기술 분석에서 흔히 사용되는 다양한 차트 패턴을 시각화하는 데 도움을 줍니다. 이 지표는 잠재적인 시장 움직임을 식별하는 데 도움이 되지만, 수익성을 보장하지는 않습니다. 구매 전에 데모 모드에서 지표를 테스트하는 것이 좋습니다. 현재 할인 : "Chart Patterns All in One" 지표 50% 할인 중. 포함된 패턴 : 1-2-3 패턴 : 세 가지 주요 지점(고점 또는 저점)을 사용하여 시장 반전을 감지합니다. 매수 : 연속된 두 저점 이후, 이전 고점보다 낮은 고점이 발생할 때. 매도 : 연속된 두 고점 이후, 이전 저점보다 높은 저점이 발생할 때. 시각화 :
Black dragon indicator
Ramil Minniakhmetov
4.86 (119)
추세 감지 표시기는 모든 전략을 보완하며 독립적인 도구로도 사용할 수 있습니다. 표시기 작업에 대한 권장 사항은 댓글 #8 에서 다운로드할 수 있습니다. 장점 사용하기 쉽고 불필요한 정보로 차트에 과부하가 걸리지 않습니다. 모든 전략에 대한 필터로 사용할 수 있습니다. 기본 제공 수준의 동적 지원 및 저항이 있어 이익을 얻고 손절매를 설정하는 데 모두 사용할 수 있습니다. 촛대가 닫힌 후에도 표시기는 색상을 변경하지 않습니다.  주식 시장, 지수, 석유, 금 및 모든 시간대에서 작동합니다. 토스트 알림, 이메일 알림, 푸시 알림 및 소리 알림 기능이 있습니다. 내 다른 개발은 여기에서 찾을 수 있습니다: https://www.mql5.com/ko/users/mechanic/seller 입력 매개변수 Alert - 켜기/끄기. 알리다; Push Notification - 켜기/끄기. 푸시 알림; Mail - 켜기/끄기 이메일 알림; Fibo 1,2,3,4,5,6,7,11,21,
Volatility Trend System - a trading system that gives signals for entries. The volatility system gives linear and point signals in the direction of the trend, as well as signals to exit it, without redrawing and delays. The trend indicator monitors the direction of the medium-term trend, shows the direction and its change. The signal indicator is based on changes in volatility and shows market entries. The indicator is equipped with several types of alerts. Can be applied to various trading ins
KT Renko Patterns MT4
KEENBASE SOFTWARE SOLUTIONS
2.33 (3)
KT Renko Patterns는 렌코 차트를 벽돌 하나하나 분석하여, 전 세계 다양한 금융 시장에서 트레이더들이 자주 사용하는 유명한 차트 패턴들을 찾아냅니다. 시간 기반 차트와 비교하면, 렌코 차트는 시각적으로 단순하고 깔끔하여 패턴 중심의 트레이딩이 훨씬 쉽게 가능합니다. KT Renko Patterns에는 다양한 렌코 패턴이 포함되어 있으며, 이 중 상당수는 Prashant Shah의 저서 『Profitable Trading with Renko Charts』에서 자세히 설명되어 있습니다. KT Renko Patterns 인디케이터를 기반으로 한 100% 자동화된 EA는 여기에서 이용할 수 있습니다 - KT Renko Patterns EA . 기능 소개 최대 8개의 명확한 렌코 패턴을 거래할 수 있어, 혼동 없이 신뢰도 높은 트레이딩이 가능합니다. 객관성을 제공하기 위해 각 패턴에는 손절선과 피보나치 목표가 함께 제공됩니다. KT Renko Patterns는 각 패턴의 정
- Real price is 80$ - 40% Discount (It is 49$ now) - Lifetime update free Contact me for instruction, add group and any questions! Related Products:  Bitcoin Expert , Gold Expert - Non-repaint - I just sell my products in Elif Kaya profile, any other websites are stolen old versions, So no any new updates or support. Introduction The breakout and retest strategy is traded support and resistance levels. it involves price breaking through a previous level.  The break and retest strategy is design
MTF Supply Demand Zones
Georgios Kalomoiropoulos
4.82 (22)
자동화된 수요 및 공급 구역의 차세대. 모든 차트에서 작동하는 새롭고 혁신적인 알고리즘. 모든 구역은 시장의 가격 움직임에 따라 동적으로 생성됩니다. 두 가지 유형의 경고 --> 1)가격이 영역에 도달할 때 2)새로운 영역이 형성될 때 당신은 더 이상 쓸모없는 지표를 얻을 수 없습니다. 입증된 결과로 완벽한 거래 전략을 얻을 수 있습니다.     새로운 기능:     가격이 공급/수요 영역에 도달하면 경고     새로운 공급/수요 구역이 생성되면 알림     푸시 알림 알림     핍의 영역 너비 레이블     기동특무부대에 한 번 더 시간이 주어집니다. 따라서 현재보다 위의 2개의 시간 프레임 대신 현재보다 높은 3개의 시간 프레임을 볼 수 있습니다.     Alerts/Zones/MTF 기능을 활성화/비활성화하는 버튼 당신이 얻는 이점:     거래에서 감정을 제거하십시오.     거래 항목을 객관화하십시오.     높은 확률 설정을 사용하여 수익
Advanced Currency Strength28 Indicator
Bernhard Schweigert
4.9 (651)
현재 26% 할인 초보자 또는 전문가 트레이더를 위한 최고의 솔루션! 이 지표는 우리가 독점 기능과 새로운 공식을 통합했기 때문에 독특하고 고품질이며 저렴한 거래 도구입니다. 단 하나의 차트로 28 Forex 쌍의 통화 강도를 읽을 수 있습니다! 새로운 추세 또는 스캘핑 기회의 정확한 트리거 포인트를 정확히 찾아낼 수 있기 때문에 거래가 어떻게 개선될지 상상해 보십시오. 사용 설명서: 여기를 클릭  https://www.mql5.com/en/blogs/post/697384 그것이 첫 번째, 원본입니다! 쓸모없는 지망생 클론을 사지 마십시오. 더 스페셜  강력한 통화 모멘텀을 보여주는 하위 창의 화살표 GAP가 거래를 안내합니다! 기본 또는 호가 통화가 과매도/과매도 영역(외부 시장 피보나치 수준)에 있을 때 개별 차트의 기본 창에 경고 표시가 나타납니다. 통화 강도가 외부 범위에서 떨어질 때 풀백/반전 경고. 교차 패턴의 특별 경고 추세를 빠르게 볼 수 있는 다중 시간
캔들의 종가를 예측하는 지표입니다. 지표는 주로 D1 차트에서 사용하기 위한 것이. 이 지표는 전통적인 외환 거래와 바이너리 옵션 거래 모두에 적합합니다. 지표는 독립형 거래 시스템으로 사용하거나 기존 거래 시스템에 추가로 사용할 수 있습니다. 이 표시기는 현재 양초를 분석하여 양초 본체 내부의 특정 강도 요인과 이전 양초의 매개변수를 계산합니다. 따라서 지표는 시장 움직임의 추가 방향과 현재 양초의 종가를 예측합니다. 이 방법 덕분에 지표는 단기 및 중장기 거래 모두에 적합합니다. 지표를 사용하면 시장 상황을 분석하는 동안 지표가 생성할 잠재적 신호의 수를 설정할 수 있습니다. 표시기 설정에는 이를 위한 특별한 매개변수가 있습니다. 또한 인디케이터는 새로운 신호에 대해 차트의 메시지 형태, 이메일 및 PUSH 알림 형태로 알릴 수 있습니다. 구매 후 저에게 꼭 써주세요! 나는 당신에게 지표와 거래에 대한 나의 추천을 줄 것입니다! 또한 보너스를 받으세요!
FX Volume
Daniel Stein
4.6 (35)
FX Volume: 브로커 시각에서 바라보는 진짜 시장 심리 간단 요약 트레이딩 접근 방식을 한층 더 향상시키고 싶으신가요? FX Volume 는 소매 트레이더와 브로커의 포지션을 실시간으로 파악할 수 있게 해 줍니다. 이는 COT 같은 지연된 보고서보다 훨씬 빠릅니다. 꾸준한 수익을 추구하는 분이든, 시장에서 더 깊은 우위를 원하시는 분이든, FX Volume 을 통해 대규모 불균형을 찾아내고, 돌파 여부를 확인하며 리스크 관리를 정교화할 수 있습니다. 지금 시작해 보세요! 실제 거래량 데이터가 의사결정을 어떻게 혁신할 수 있는지 직접 경험해 보시기 바랍니다. 1. 트레이더에게 FX Volume이 매우 유익한 이유 탁월한 정확도를 지닌 조기 경보 신호 • 다른 사람들보다 훨씬 앞서, 각 통화쌍을 매수·매도하는 트레이더 수를 거의 실시간으로 파악할 수 있습니다. • FX Volume 은 여러 리테일 브로커에서 추출한 실제 거래량 데이터를 종합해 명확하고 편리한 형태로 제공하는
FX Dynamic: 맞춤형 ATR 분석으로 변동성과 트렌드를 파악하세요 개요 FX Dynamic 는 Average True Range(ATR) 계산을 활용하여 트레이더에게 일간 및 일중 변동성에 대한 뛰어난 인사이트를 제공하는 강력한 도구입니다. 80%, 100%, 130%와 같은 명확한 변동성 임계값을 설정함으로써 시장이 평소 범위를 초과할 때 빠르게 경고를 받고, 유망한 수익 기회를 재빨리 식별할 수 있습니다. FX Dynamic 는 브로커의 시간대를 인식하거나 수동으로 조정할 수 있으며, 변동성 측정 기준을 일관되게 유지하며, MetaTrader 플랫폼과 완벽하게 연동되어 실시간 분석을 지원합니다. 1. FX Dynamic이 트레이더에게 매우 유용한 이유 실시간 ATR 인사이트 • 하루 및 일중 변동성을 한눈에 모니터링하세요. ATR의 80%, 100%, 130% 임계값이 도달 또는 초과되면, 시장의 중요한 지점에 있음을 알 수 있습니다. • 변동성이 완전히 폭발하기
Currency Strength Exotics
Bernhard Schweigert
4.87 (31)
현재 20% 할인! 초보자 또는 전문가 트레이더를 위한 최고의 솔루션! 이 표시기는 Exotic Pairs Commodities, Indexes 또는 Futures와 같은 기호에 대한 통화 강도를 표시하는 데 특화되어 있습니다. 금, 은, 석유, DAX, US30, MXN, TRY, CNH 등의 진정한 통화 강도를 보여주기 위해 9번째 줄에 모든 기호를 추가할 수 있습니다. 이것은 독특하고 고품질이며 저렴한 거래 도구입니다. 우리는 많은 독점 기능과 새로운 공식을 통합했습니다. 새로운 추세 또는 스캘핑 기회의 정확한 트리거 포인트를 정확히 찾아낼 수 있기 때문에 거래가 어떻게 개선될지 상상해 보십시오. 사용 설명서: 여기를 클릭 https://www.mql5.com/en/blogs/post/708876 모든 시간대에 작동합니다. TREND를 빠르게 확인할 수 있습니다! 새로운 기본 알고리즘을 기반으로 설계되어 잠재적인 거래를 더욱 쉽게 식별하고 확인할 수 있습니다. 8개의
제작자의 제품 더 보기
Tick Speed Pro MT5
John Louis Fernando Diamante
Tick Speed Pro povides a charted record of tick speed to allow you to see the ebb and flow of market activity. Observing patterns in tick speed may allow you to better time entries to reduce slippage and re-quotes. The tick speed plot updates it's entire position to show you only the last N seconds you choose, ideal for scalping and HFT approaches. An alert is provided to signal when the instrument is getting ticks at a higher rate than the alert limit. Multiple loadings are supported to compare
Pivot Types with Levels MTF MT5
John Louis Fernando Diamante
Fully featured Pivots and Levels indicator Pivots: Floor (normal), Woody, Camarilla, Fibonacci Levels: ATR, Historical Volatility with standard deviations, Close Price Volatility with standard deviations Features: - 4 +/- levels - MTF, pivots/levels based on Daily, Weekly, 4hr or even 15min - Hour and minute time offset - Texts with prices and pip distances to central pivot/level - Inputs for Camarilla/Fibonacci/ATR/Volatility levels - Alerts, popup, push, email, sound, live or completed candle
Market Ticker Pro MT5
John Louis Fernando Diamante
The only Market Ticker on the market! Add a professional novelty to your workspace, with built in mini-charts A scrolling Market Ticker that displays price changes from all symbols in the Market Watch list. Provides an easy snapshot of symbol prices, and keeps scrolling automatically while you trade and analyse the chart. The ticker color (+/- price changes) are based on either the current or completed candle, and the previous candle. Options include: - MTF, eg choose to show price changes of t
RSI Color Candles with Moving Average
John Louis Fernando Diamante
4.75 (4)
See RSI values turned into colored candles This indicator provides both colored candles and a colored moving average. 6 drawaing styles are provided to allow customization of the color coding. Applying coding to the chart may help in conceptualizing price trend and impulse movements defined through RSI values. Features - optional colored candles - optional colored ma - 6 draw styles; RSI slope RSI above/below overbought/oversold levels RSI above/below level 50 RSI above/below it's moving average
FREE
Mini Chart Multi
John Louis Fernando Diamante
5 (5)
This indicator tool provides mini charts, with adjustable symbol/tf that can be dragged into place. Lightweight operation with multiple mini charts are supported. Chart features: adjustable symbol and tf draggable multiple mini charts color styling and font sizing, foreground/background colors candle coloring candle styles; candles, bars, line, high-low channel zoom in/out
FREE
Shape Pack MT5
John Louis Fernando Diamante
This indicator provides common shapes as drawing object options. The shapes are rotatable, resizable, draggable, and will keep their proportions (according to their handle trendline) across different chart scales. Multiple drawings are supported. Shapes: Square Rhombus Triangle (quadrilateral & isosceles) Circle (grid, overlapped grid, flexi grid, rotatable grid, concentric circles) Features: rays (all object edges will be rays) show/hide each individual drawing type, or all delete last drawn ob
FREE
Heiken Ashi in Subwindow
John Louis Fernando Diamante
4.67 (3)
This indicator plots Heiken Ashi candles in a subwindow instead of the main chart, making it possible to analyse HA candles whilst keeping the main chart clean. - optional bid/close line is provided, stylable, updates on tick - HA candles are stylable via the inputs tab - optional price smoothing to the HA candles, with moving average period and method options - auto-scaling when scrolling back and forth
FREE
Bollinger Bands Max Free MT5
John Louis Fernando Diamante
5 (1)
A flexible BB indicator You're no longer limited to the built in default of using BB off a SMA method, now you can choose from: SMA - SMMA - EMA - LWMA - ADAPTIVE - FRACTAL ADAPTIVE - DEMA - TEMA - VARIABLE INDEX DYNAMIC You now also have 2 standard deviation levels. A more featured version is available with 5 deviation levels, color gradients to lines and filling as well as candles, with full alerts too: Bollinger Bands Max MT5 Options: - MTF - 9 choices of MA to base the BB off -  2 adjustabl
FREE
Tick Speed Free MT5
John Louis Fernando Diamante
Tick Speed Free povides a on-chart label of tick speed to allow you to see the ebb and flow of market activity. Observing rises and falls in tick speed may allow you to better time entries to reduce slippage and re-quotes. Options include: - colores for low-mid-high tick speeds - placement and styling - prefix & suffix to customise the speed label Troubleshooting: - Note, in the tester environment, tick timings are limited to what is supplied by the tester environment and it's speed - If there
FREE
Larger Price Time Crosshair Data
John Louis Fernando Diamante
5 (4)
This utility indicator provides accessibility and readability, by displaying a larger price scale, time scale, crosshair, and symbol name/tf/ohlc information. All features are sizeable and can be styled separately, and are optional to show. All Features optional to use font, size and color options Price Scale option to hide the default MT4 price scale option to show horizontal lines at price levels prices drawn can be at round numbers (ie automatic rounding to multiples of 5/10/20/25 points),
FREE
MACD Max Free
John Louis Fernando Diamante
5 (1)
A flexible 2-Line MACD indicator The default MACD indicator inside MT4, limits you to using the MACD with a fast-EMA, slow-EMA, and signal-SMA. This MACD indicator allows you to set your own MA-Method choices for these 3 components, separately! You can select from SMA-EMA-SMMA-LWMA, and can even use a separate method for each 3 fast-slow-signal periods. A more featured version is available with colored candles+conditions, full alerts+conditions, line coloring, DEMA and TEMA options; MACD MAX Fe
FREE
Shape Pack
John Louis Fernando Diamante
This indicator provides common shapes as drawing object options. The shapes are rotatable, resizable, draggable, and will keep their proportions (according to their handle trendline) across different chart scales. Multiple drawings are supported. Shapes: Square Rhombus Triangle (quadrilateral & isosceles) Circle (grid, overlapped grid, flexi grid, rotatable grid, concentric circles) Features: rays (all object edges will be rays) show/hide each individual drawing type, or all delete last drawn ob
FREE
Bollinger Bands Max Free
John Louis Fernando Diamante
4.67 (3)
A BB indicator with MA options You're no longer limited to the built in default of using BB off a SMA method, now you can choose from SMA-EMA-SMMA-LWMA. You now also have up to 3 standard deviation levels, with price labels. Options: - MTF - moving average type SMA-EMA-SMMA-LWMA -  3 adjustable deviation levels - separate coloring to lines and texts Troubleshooting: - If there are any issues or suggestions for the indicator, please comment and let me know. The feedback will be noted and consid
FREE
Market Ticker Free MT5
John Louis Fernando Diamante
5 (1)
A scrolling Market Ticker that displays price changes from all symbols in the Market Watch list. Provides an easy snapshot of symbol prices, and keeps scrolling automatically while you trade and analyse the chart. Options include: - MTF, eg choose to show price changes of the daily chart, or the hourly - use the live candle or the recently completed - font and background coloring
FREE
Market Ticker Free
John Louis Fernando Diamante
5 (1)
A scrolling Market Ticker that displays price changes from all symbols in the Market Watch list. Provides an easy snapshot of symbol prices, and keeps scrolling automatically while you trade and analyse the chart. Options include: - MTF, eg choose to show price changes of the daily chart, or the hourly - use the live candle or the recently completed - font and background coloring
FREE
Tick Speed Free
John Louis Fernando Diamante
5 (1)
Tick Speed Free povides a on-chart label of tick speed to allow you to see the ebb and flow of market activity. Observing rises and falls in tick speed may allow you to better time entries to reduce slippage and re-quotes. Options include: - colores for low-mid-high tick speeds - placement and styling - prefix & suffix to customise the speed label Troubleshooting: - Note, in the tester environment, tick timings are limited to what is supplied by the tester environment and it's speed - If there
FREE
Market Ticker
John Louis Fernando Diamante
The only Market Ticker on the market! Add a professional novelty to your workspace, with built in mini-charts A scrolling Market Ticker that displays price changes from all symbols in the Market Watch list. Provides an easy snapshot of symbol prices, and keeps scrolling automatically while you trade and analyse the chart. The ticker color (+/- price changes) are based on either the current or completed candle, and the previous candle. Options include: - MTF, eg choose to show price changes of
Tick Speed Pro
John Louis Fernando Diamante
Tick Speed Pro povides a charted record of tick speed to allow you to see the ebb and flow of market activity. Observing patterns in tick speed may allow you to better time entries to reduce slippage and re-quotes. The tick speed plot updates it's entire position to show you only the last N seconds you choose, ideal for scalping and HFT approaches. An alert is provided to signal when the instrument is getting ticks at a higher rate than the alert limit. Multiple loadings are supported to compare
Bollinger Bands Max
John Louis Fernando Diamante
5 (1)
A fully featured BB indicator You're no longer limited to the built in default of using BB off a SMA method, now you can choose from SMA - EMA - SMMA - LWMA - DEMA - TEMA. You now also have up to 5 standard deviation levels, with price labels, and deviation-colored candles are provided. Options: - MTF - moving average type SMA - EMA - SMMA - LWMA - DEMA - TEMA -  5 adjustable deviation levels - color gradients to BB lines, candles, and texts - show-hide button to declutter the chart - full aler
MACD Max
John Louis Fernando Diamante
A flexible 2-Line MACD indicator The default MACD indicator inside MT4, limits you to using the MACD with a fast-EMA, slow-EMA, and signal-SMA. This MACD indicator allows you to set your own MA-Method choices for these 3 components, separately! You can select from SMA-EMA-SMMA-LWMA-DEMA-TEMA, and can even use a separate method for each 3 fast-slow-signal periods. On-chart colored candles, with drawing condition types is included, with a show/hide button too. Features - MA Methods: SMA, EMA, SMM
Pivot Types with Levels MTF
John Louis Fernando Diamante
5 (2)
Fully featured Pivots and Levels indicator Pivots: Floor (normal), Woody, Camarilla, Fibonacci Levels: ATR, Historical Volatility with standard deviations, Close Price Volatility with standard deviations Features: 4 +/- levels MTF, pivots/levels based on Daily, Weekly, 4hr or even 15min Hour and minute time offset Texts with prices and pip distances to central pivot/level Inputs for Camarilla/Fibonacci/ATR/Volatility levels Alerts, popup, push, email, sound, live or completed candles on level c
Drawing Pack
John Louis Fernando Diamante
4 (1)
This indicator provides several drawing tools to assist in various methods of chart analysis. The drawings will keep their proportions (according to their handle trendline) across different chart scales, update in real time, and multiple drawings are supported. # Drawing Option Description  1 Grid box draggable boxed grid, user defines rows x colums, diagonal ray option  2 Grid partial or fullscreen grid, sized by handle line  3 Grid flex a diagonal grid, sized and sloped by handle line  4 Cyc
Draw by Hand Tool
John Louis Fernando Diamante
This tool provides a freehand drawing method, to treat the chart space as a blackboard and draw by-hand. Drawings can be made to stick to the CHART (moves with chart scroll), or to stick to the WINDOW (does not move with chart scroll). Features: all drawings are individually styled, color, width show/hide each drawing type delete last drawing drawings, on chart and on window, remain through TF changes and terminal re-starts, until the indicator is removed Panel: stylable colors scalable in size
Mini Chart
John Louis Fernando Diamante
This indicator tool provides mini charts, with adjustable symbol/tf that can be dragged and resized into place. Lightweight operation with multiple mini charts are supported. Chart features: adjustable symbol and tf draggable resizeable multiple mini charts color styling and font sizing, foreground/background colors candle coloring candle styles; candles, bars, line, high-low channel optional background color gradient predfined period separators on all tf's (eg 1hr/1day sep on 1Min, 4hr/1day se
Bollinger Bands Max MT5
John Louis Fernando Diamante
A fully featured BB indicator You're no longer limited to the built in default of using BB off a SMA method, now you can choose from: SMA - SMMA - EMA - LWMA - ADAPTIVE - FRACTAL ADAPTIVE - DEMA - TEMA - VARIABLE INDEX DYNAMIC You now also have up to 5 standard deviation levels, with price labels. Styling wise, there are color gradients provided for deviation filling, candles (bars too), deviation lines and texts. Options: - MTF - 9 choices of MA to base the BB off -  5 adjustable deviation lev
MACD Max MT5
John Louis Fernando Diamante
A flexible 2-Line MACD indicator The default MACD indicator inside MT4, limits you to using the MACD with a fast-EMA, slow-EMA. This MACD indicator allows you to set your own MA-Method choices for these 2 components, separately! You can select from SMA, EMA, SMMA, LWMA, ADAPTIVE MA, FRACTAL MA, DEMA, TEMA, VARIABLE INDEX DYNAMIC MA, and can even use a separate method for each 2 fast-slow. The signal line has options from SMA-EMA-SMMA-LWMA. On-chart colored candles, with drawing condition types i
Drawing Pack MT5
John Louis Fernando Diamante
This indicator provides several drawing tools to assist in various methods of chart analysis. The drawings will keep their proportions (according to their handle trendline) across different chart scales, update in real time, and multiple drawings are supported. # Drawing Option Description  1 Grid box draggable boxed grid, user defines rows x colums, diagonal ray option  2 Grid partial or fullscreen grid, sized by handle line  3 Grid flex a diagonal grid, sized and sloped by handle line  4 Cyc
필터:
varon
528
varon 2024.02.28 11:45 
 

Thank you very much! This is the best indicator! With everything that I need, mirror, bid-ask, line-chart etc! 10 stars from 5!!!

Sergei Kiriakov
1757
Sergei Kiriakov 2023.12.13 12:08 
 

this is the best overlay indicator

John Louis Fernando Diamante
25007
개발자의 답변 John Louis Fernando Diamante 2023.12.16 04:44
A gif recording of live updating on new ticks has been added to the product description.
If I run it, there is no issue, it updates the overlay chart on every new tick from the current chart, and the scaled overlay chart matches the other symbol.
If the other symbol or timeframe is not yet ready, you can refresh the chart, though the indicator has been updated to do this automatically.
The indicator has also been updated to include more possible error printouts for any issues that may arise.
lywer
179
lywer 2022.12.19 11:56 
 

indicator stops working in realtime chart. please fix.

John Louis Fernando Diamante
25007
개발자의 답변 John Louis Fernando Diamante 2022.12.19 22:56
I haven't noticed any issue, so I will need some information; are there any prinouts in the experts tab of the terminal, and how do I replicate the issue?
리뷰 답변
버전 1.6 2024.07.12
//v1.6, 13/jul/2024
// - use chart sym if input empty
// - scale/draw on same sym tf
버전 1.5 2024.02.28
//v1.5 28/feb/2024
// - added option to show ask and bid lines
버전 1.4 2024.01.29
//v1.4
// - option to invert overlay
// - text updated to say if inverted
// - option to shrink overlay to bottom of chart
버전 1.3 2023.12.16
//v1.3
// - removed excessive printout on every tick when a new candle time for current/source don't align
버전 1.2 2023.12.16
//v1.2
// - extra ohlc buffers for overlay symbol in data window
// - extra error printouts
버전 1.1 2023.12.16
//v1.1
// - timer update if data from other sym/tf not ready