• 미리보기
  • 리뷰
  • 코멘트

Price Momentum Alerts

Introduction

In the fast-paced world of financial market trading, success often hinges on the ability to spot and leverage trends. Among the various strategies available, momentum trading stands out as a powerful tool for traders seeking to capitalize on market movements. In this article, we will delve into the concept of momentum, its significance in trading, and the numerous benefits it offers to traders.

What is Momentum?

Momentum in trading refers to the tendency of assets to continue moving in their current direction. It is the idea that assets that have been performing well are likely to keep performing well, while those on a downward trajectory are likely to continue declining. Traders who utilize momentum strategies aim to ride these waves, buying into strong-performing assets and selling or shorting weak-performing ones.

Why is Momentum Important?

Momentum is crucial in financial market trading for several reasons:

  1. Historical Evidence: Numerous studies have shown that stocks, currencies, commodities, indices and other financial assets exhibit momentum. In other words, assets that have performed well in the recent past often continue to do so in the near future. This empirical evidence provides a strong foundation for momentum trading strategies.

  2. Psychological Factors: Market participants often react to recent price movements. Positive news can create a "bandwagon effect," drawing in more buyers, while negative news can trigger panic selling. Momentum traders capitalize on these emotional responses in the market.

  3. Diversification: Momentum trading can complement other trading strategies in a diversified portfolio. By including momentum-based trades, traders can reduce risk and increase their chances of profiting from market movements.

Benefits of Trading with Momentum

Trading with momentum offers several advantages to traders:

  1. Profit Potential: Momentum strategies have the potential to generate significant profits when correctly applied. By identifying and capitalizing on trends, traders can capture substantial price moves.

  2. Reduced Risk: Momentum traders often use stop-loss orders and other risk management techniques to limit potential losses. This risk mitigation approach can help protect capital in volatile markets.

  3. Simplicity: Momentum trading is relatively straightforward. Traders do not need to analyze complex financial statements or economic indicators. Instead, they focus on price action and recent performance.

  4. Adaptability: Momentum strategies can be applied to various asset classes, including stocks, commodities, and currencies. This versatility allows traders to explore different markets and diversify their portfolios.

Trading with the Trend and Momentum

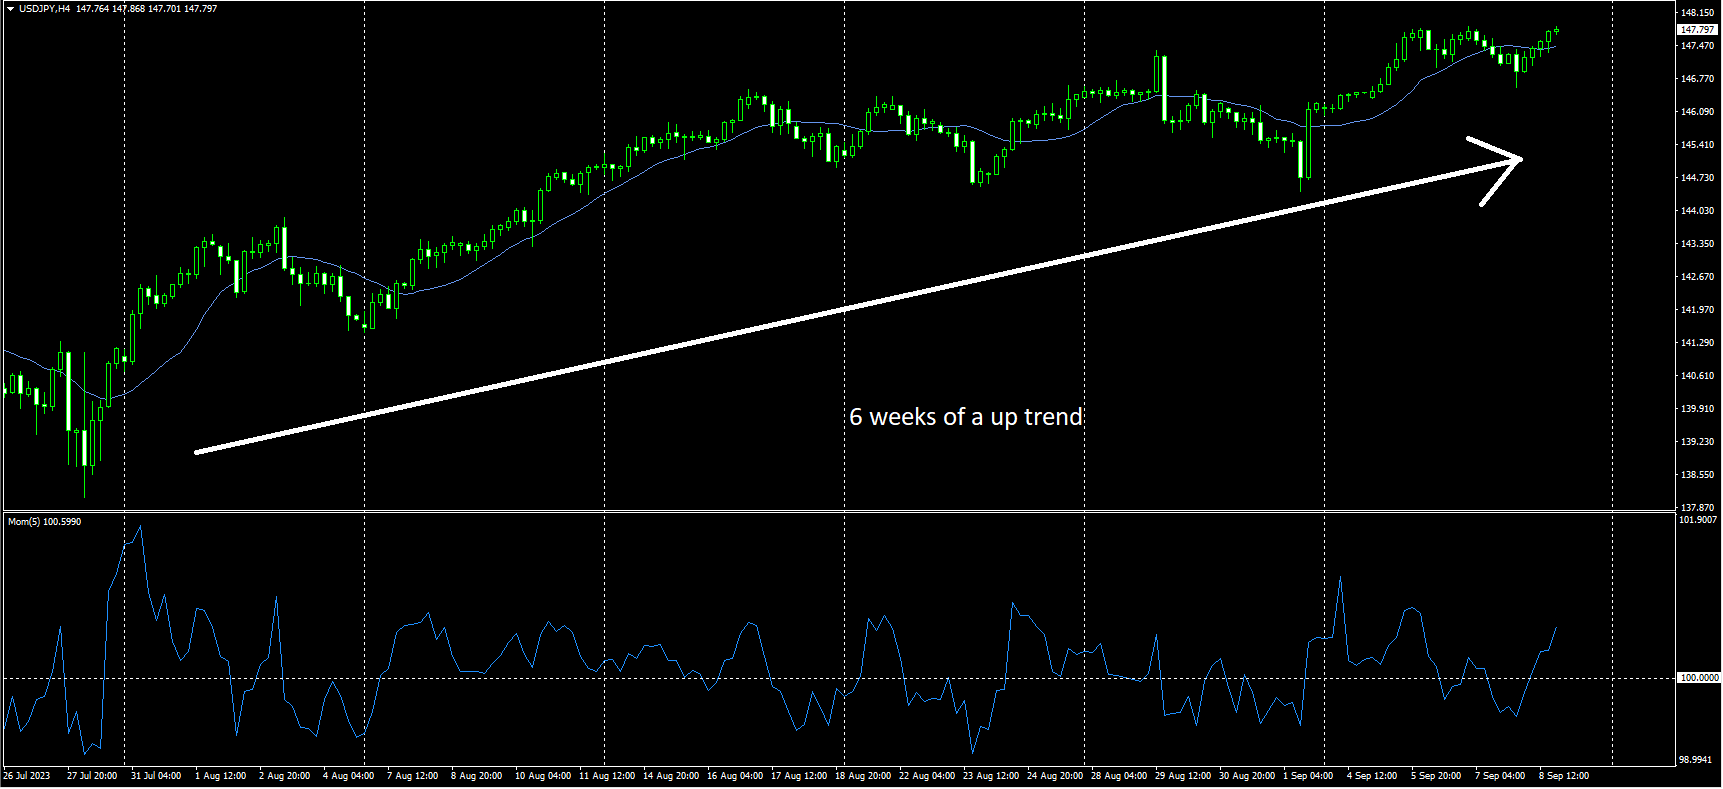
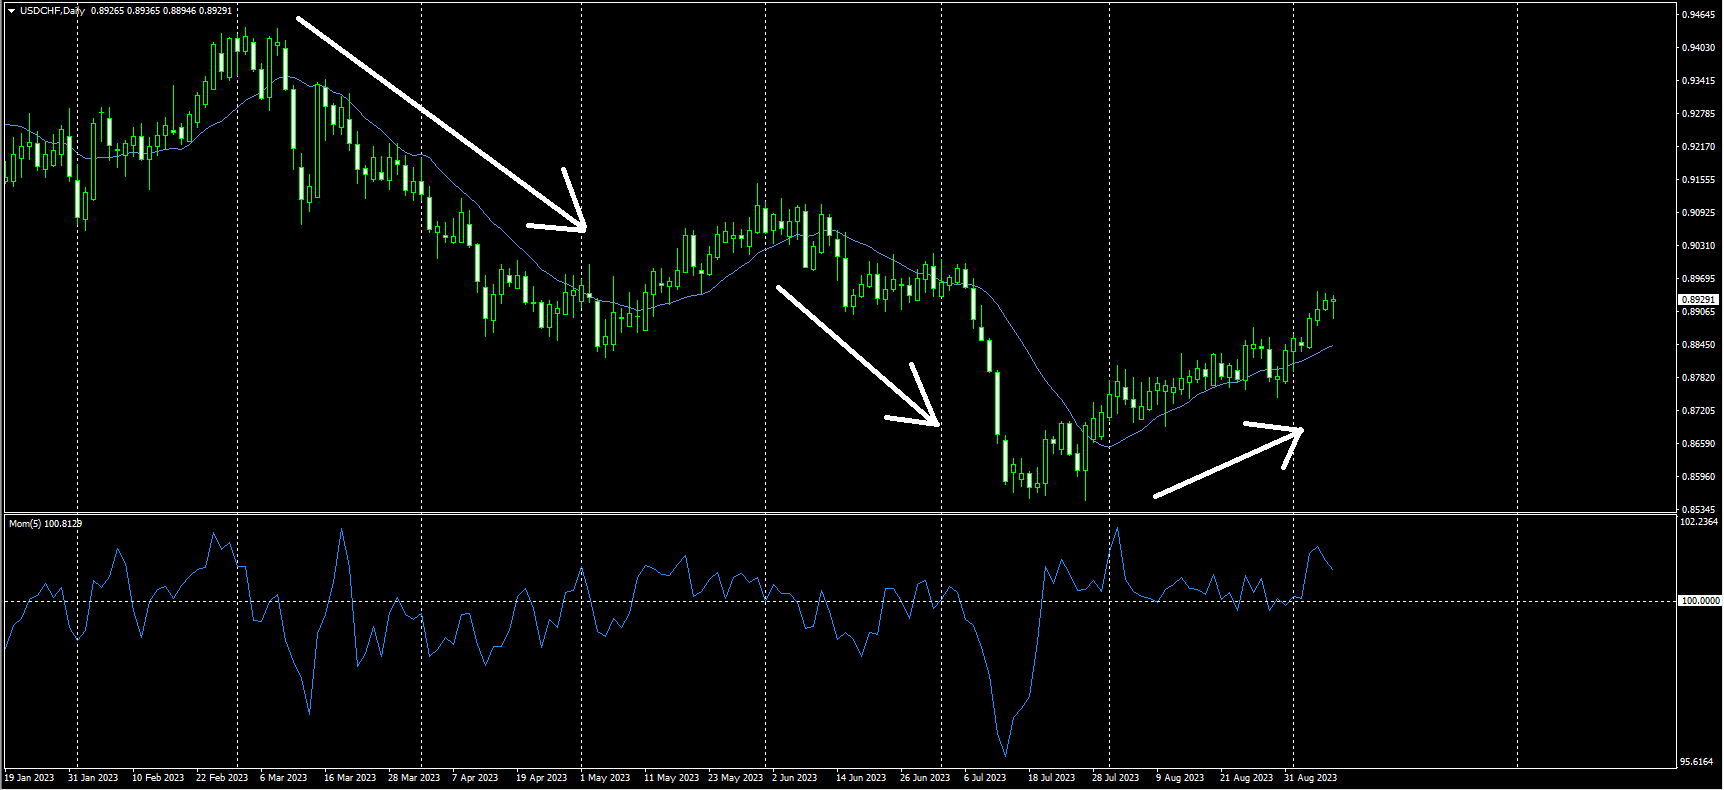
Trading with momentum often goes hand-in-hand with trading with the trend. Trend-following traders look for assets that are moving in a clear direction and align their trades accordingly. Momentum traders, on the other hand, specifically seek assets with strong recent performance, which often corresponds to assets in a trending market.

By combining these two approaches, traders can increase their probability of success. When an asset is both exhibiting strong momentum and following a well-defined trend, it presents an enticing opportunity for traders to profit from the continued price movement in the same direction.

The Advantages of Price Momentum Alerts

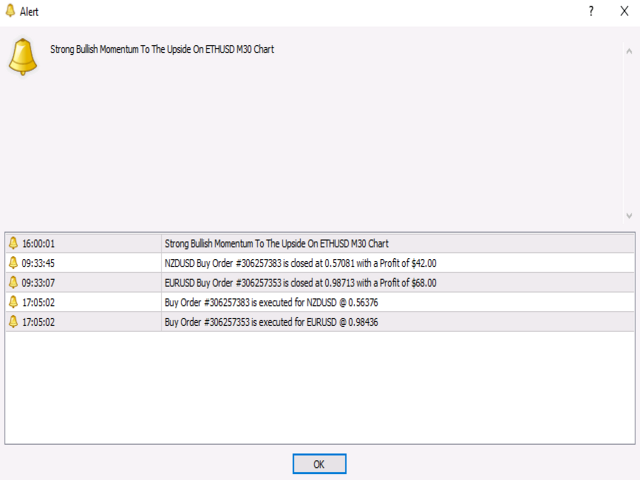
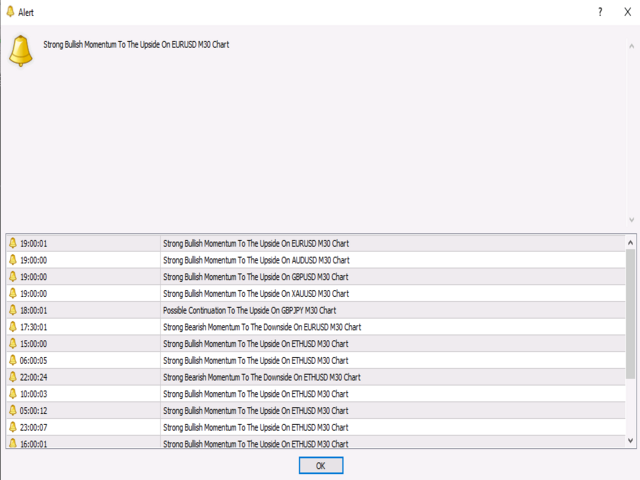
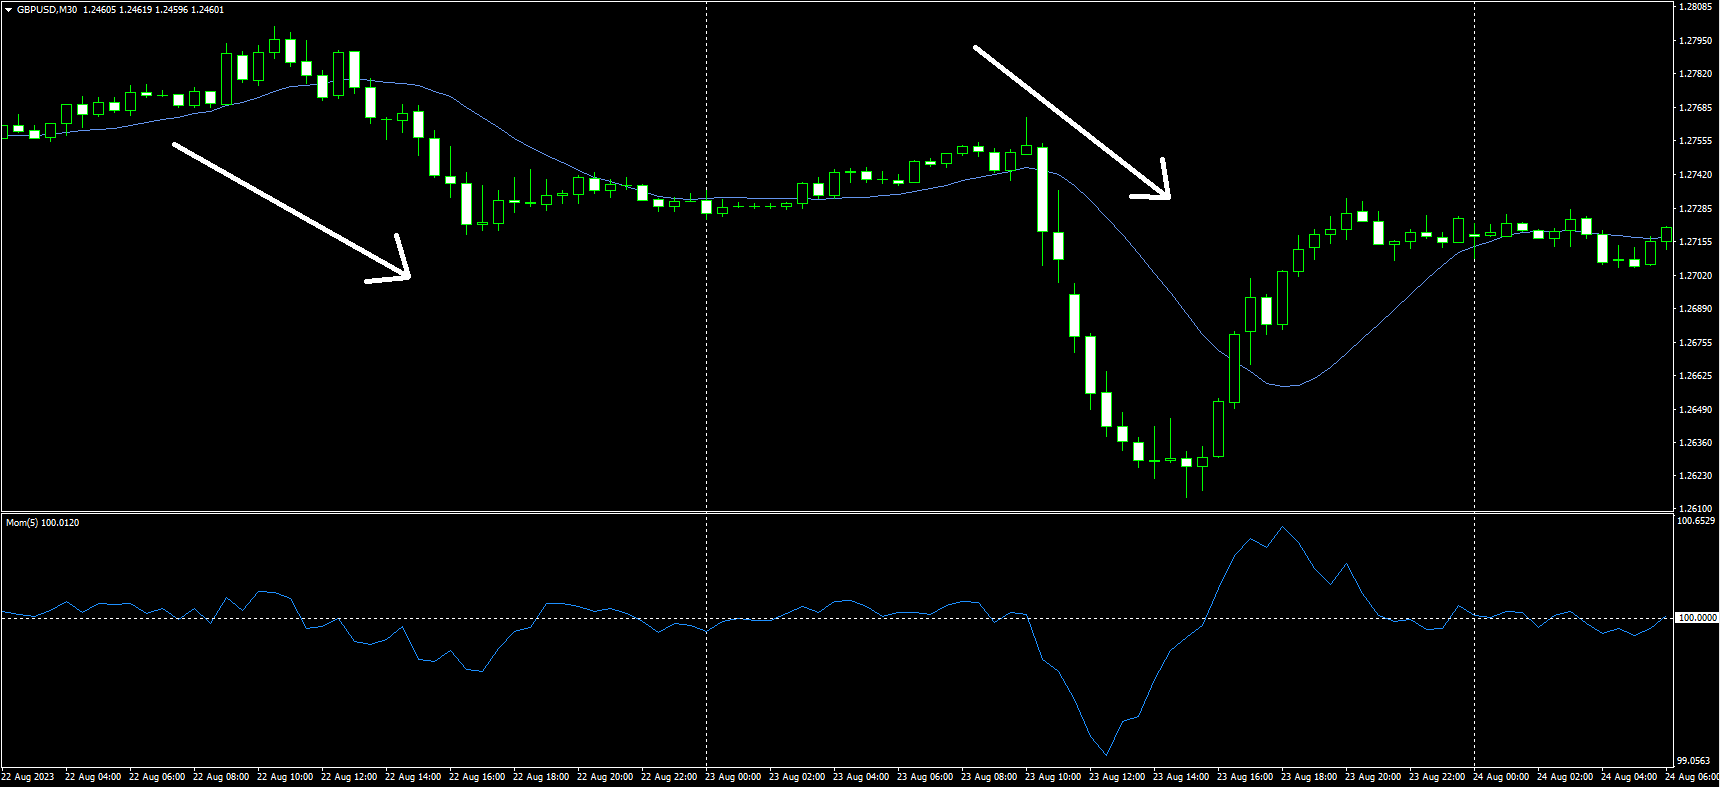
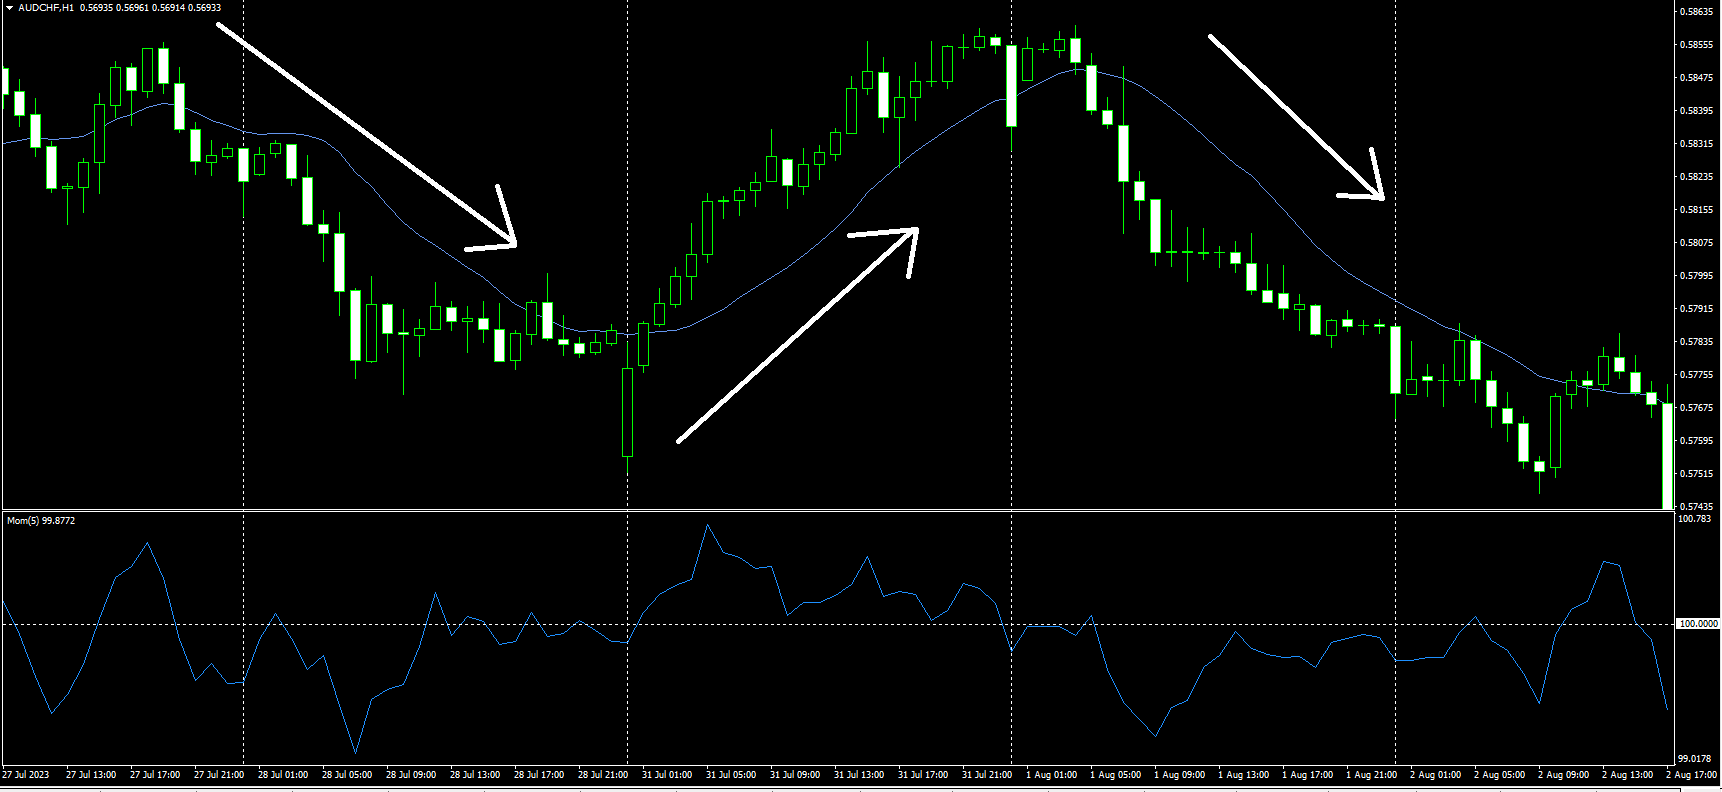
You will receive alerts when the price is setting up to move strongly to the upside or the downside. 
You can combine these alerts with your own analysis. (This is highly recommended.) 
This indicator can be used on any currency pair, including cryptos, indices, gold, and more. 
This indicator can be used on any timeframe. From the one-minute chart all the way to the monthly chart. 
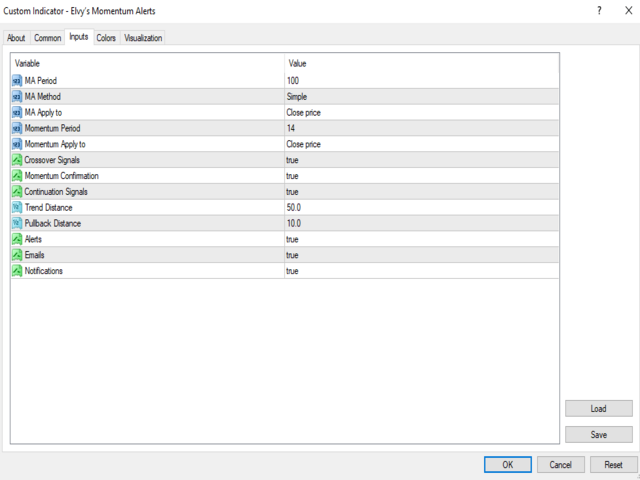
In the settings, you can easily change the moving average period and the momentum period. You can also choose to use simple, smoothed, exponential, or linear weighted moving averages. 
This indicator can be used on multiple charts and multiple timeframes at once. For 24 hour alerts around the clock, use a VPS. (Virtual Private Server )


Recommended Settings:

It is recommended that you use this indicator on the M30 timeframe and higher. I find that you can get great results using it on the M30 timeframe on any currency pair, indices, gold, and crypto. There are times when you can get good alerts on the M15 chart, but it all depends on your trading style. If you are day trading, use the smaller timeframes, such as M15 and M30. I would say you can go as low as the M5.

I also recommend that you add a moving average to your charts for a visual reference. This indicator does not have any visuals. You will only receive alerts on bullish or bearish momentum based on price action. Even if you do not plot a moving average on your chart, you will still need to use one in the indicator settings to work. Choosing a moving average depends on your trading style. For a M30 chart, use an 8 moving average up to a 25 moving average. For the H4 and D1, use a 50 moving average up to a 100 moving average.

Please keep in mind that the higher the timeframe you use and the larger the moving averages that you use, the longer it will take to receive an alert.

For the momentum period, I recommend using 5 up to 15. You can use larger numbers if you like. Keep the moving averages and momentum period to (CLOSED). Keep the crossover signals as (TRUE) and the momentum signals as (TRUE). For the continuation signals, you can keep them as true or false. It is up to you. Continuation signals will give you an alert based on how far price retraces from the moving average, the trend distance, and the pullback distance that you choose in the settings. You'll see this option in the settings. I would say try different numbers for the moving average and the momentum period and see what works best for your trading style.

When you get a momentum alert, make sure that you take a good look at the levels of support and resistance. It is best to take buy trades that are closer to support levels and sell trades that are closer to resistance levels. It is common to get an alert and have the price pull-back or retrace a bit before continuing in the direction of the alert. So please be aware of this. Use this indicator as a guide, not your sole reason to just jump into a trade. This indicator is designed to help you find momentum in the markets. Make sure you use this indicator in conjunction with your trading strategy or analysis.


      I wish you all the best. Please message me if you have any questions.


      Best Regards,


      Danny


      추천 제품
      The indicator draws trend lines based on Thomas Demark algorithm. It draws lines from different timeframes on one chart. The timeframes can be higher than or equal to the timeframe of the chart, on which the indicator is used. The indicator considers breakthrough qualifiers (if the conditions are met, an additional symbol appears in the place of the breakthrough) and draws approximate targets (target line above/below the current prices) according to Demark algorithm. Recommended timeframes for t
      Pivot levels Auto V1
      Hafis Mohamed Yacine
      What Is a Pivot Point? A pivot point is a technical analysis indicator, or calculations, used to determine the overall trend of the market over different time frames. The pivot point itself is simply the average of the intraday high and low, and the closing price from the previous trading day. On the subsequent day, trading above the pivot point is thought to indicate ongoing bullish sentiment, while trading below the pivot point indicates bearish sentimen How to Use Pivot Points The very e
      Signal Eskiya
      Vitalii Zakharuk
      Signal Eskiya, in addition to channel lines, reflects entry signals in the form of arrows. Trading strategies using the channel indicator belong to the classic methods of technical analysis, are easy to execute, and therefore available even to beginners. Price ranges work equally well on any trading assets and timeframes, they can be used both independently and with additional confirmation from oscillators and market volumes. American traders say: “Trend is your friend”, which means “Trend is
      Fibo Linear Channel
      Igor Semyonov
      4 (1)
      Colored indicator of the linear channel based on the Fibonacci sequence. It is used for making trading decisions and analyzing market sentiment. The channel boundaries represent strong support/resistance levels, as they are the Fibonacci proportion levels. Users can select the number of displayed lines of channel boundaries on the chart by means of the input parameters. Attaching multiple instances of the indicator to the chart with different calculation periods leads to displaying a system of c
      Open Momentum
      Claus Dietrich
      Optimized for Asia- London- US- Open-Session  the best Features from MOMENTUM-SOLO true Momentum - time-based Indicator it's based on a self-developed candle Pattern, in relation to the ATR Filter Daytime Weekdays Moving Averages Keltner-Channel Advantages Optimized for Asia- London- US- Open-Session choose your personal times to trade - select Daytime and Weekdays Keltner-Channel => to reduce market noise - sideways movement will be hidden 3x Moving Averages => for the Trend Sig
      15 years old, 15 years old, 15 years old. 2024 years ago: ️ What to do next. I want to know what I want to know. Sorry, I don't know what to do. I want to know, I want to know, I want to know. I want to know what I want to know. I want to know what I want to know. H4(단지 M1에서 M30) I'm here. I'm here. I want to know what I want to know. I want to know what I'm saying. I want to know what I want to know. I want to know what I want to know. I want to know what I want to know.
      Effect
      Maryna Shulzhenko
      The Effect indicator shows the points of potential market reversal. Simple, visual and efficient trend detection. Ready-made trading system. The intelligent algorithm of the indicator determines the trend with good probability. Uses just one parameter for settings. The indicator does not redraw and does not lag. Works on all currency pairs and all timeframes. You should remember that using a combination of forecasting tools, it is advisable to choose 2-3 indicators for trading. Otherwise, the
      This is a simple and efficient indicator based on market logic. The indicator creates a range chosen by a trader. Trader selects only two parameters. The first one is the number of candles that define the frame. The second one is the number of candles needed for confirmation frame. The indicator shows all situations in history and works with the actual movement of the market. The indicator works on all timeframes . You are not limited by use of different timeframes, the indicator is able to adap
      Master Phi
      Chantal Sala
      Master Phi is an indicator based on Fibonacci numbers. It analyzes the percentage values returning the proportion of the Golden Section. You can customize values and set custom levels so you will create your personal Trading. The attention on the minimums and the maximums of timeframes allows accurate analysis in order to intercept very precisely the trading levels after the various impulse movements. Input Values Time_Frame to analyze LEVELS SETTINGS 9 levels (in percentage) 9 colors LINE SET
      BB Trend AM
      Andriy Matviyevs'kyy
      The presented indicator clearly and very accurately displays the current trend, its beginning and end. The indicator is also used to identify support/resistance levels. The operating principle of the indicator is based on another popular and time-tested indicator - Bollinger Bands. The indicator allows you to send notifications to a mobile terminal and email. Customizable parameters: Bollinger Bands Period; Bollinger Bands Deviation; Offset Factor; Alerts - displays a dialog box containing inf
      The price is moving between two curve tunnel lines in a trend. The two lines of a tunnel represent support and resistance. In an uptrend, for instance, a trade might be entered at the support of the trend line (shown by the red line in the chart) and exited at resistance of the upper tunnel line (shown by the blue line). Tunnel show trend direction for any timeframe (if you have enough bars on the chart for higher timeframes). Trend, or price tunnel, can be up, down or sideways. If the current p
      Global Trend
      Vitalii Zakharuk
      Global Trend Indicator, shows the signals for entry. Displays both entry points and the trend itself. Shows statistically calculated moments for entering the market with arrows. When using the indicator, the risk factor can be optimally distributed. Settings: Uses all one parameter for settings. Choosing a parameter, it is necessary to visually resemble it so that the appropriate graph has a projection of extremes. Parameters: Length - the number of bars for calculating the indicator.
      SNR LEVEL INDICATOR Accurate Snr level indicator will only display Fresh Levels that are close to the Current Market Price. This indicator is very accurate in mapping Support & resistance levels. there is an alert feature when the price TOUCHES the SNR LEVEL, WHEN CLOSE CANDLE BREAK/REJECT SNR LEVEL. INDICATOR MARKING : - SUPPORT LEVEL = V SHAPE - RESISTANCE LEVEL = APEX LEVEL - GAP RESISTANCE & GAP SUPPORT = OPEN CLOSE CANDLE - SUPPORT BECAME RESISTANCE & RESISTANCE BECAME SUPPORT INDICATOR
      Pivots indicator
      Mahmoud Helmy Sedik Mohamed Mansour
      Pivots Points are price levels chartists can use to determine intraday support and resistance levels. Pivot Points use the previous days Open, High, and Low to calculate a Pivot Point for the current day. Using this Pivot Point as the base, three resistance and support levels are calculated and displayed above and below the Pivot Point.     and below the Pivot Point.
      All Pivot Points
      Alfred Kamal
      5 (1)
      Pivot Points is used by traders to objectively determine potential support and resistance levels. Pivots can be extremely useful in Forex since many currency pairs usually fluctuate between these levels. Most of the time, price ranges between R1 and S1. Pivot points can be used by range, breakout, and trend traders. Range-bound Forex traders will enter a buy order near identified levels of support and a sell order when the pair nears resistance. But there are more one method to determine Pivot p
      This indicator draws Fibonacci level automatically from higher high to lower low or from lower low to higher high. With adjustable Fibonacci range and has an alert function. How to use Fibonacci Risk Reward Ration (R3) into trading strategy Forex traders use Fibonacci-R3 to pinpoint where to place orders for market entry, for taking profits and for stop-loss orders. Fibonacci levels are commonly used in forex trading to identify and trade off of support and resistance levels. Fibonacci retrace
      Jerk Trend
      Ivan Simonika
      Jerk Trend is a new product that allows you to identify the current market phase (uptrend, downtrend or flat). Represents a typical investor strategy that usually indicates a trend change from bearish to bullish. A tool that allows you to determine the direction and strength of a trend. Unlike most indicators, Jerk Trend finds longer-term trends and gives fewer false signals. This indicator displays arrows of different colors depending on the current state of the market and thus signals the u
      Auto Fibo mq
      DMITRII GRIDASOV
      "자동 FIBO" 표시기 - 거래 시 훌륭한 보조 도구입니다! 지표는 Fibo 레벨과 로컬 추세선(빨간색)을 자동으로 계산하여 차트에 배치합니다. 피보나치 수준은 가격이 반전될 수 있는 주요 영역을 나타냅니다. 가장 중요한 수준은 23.6%, 38.2%, 50% 및 61.8%입니다. 반전 스캘핑 또는 영역 그리드 거래에 사용할 수 있습니다. 자동 FIBO 표시기를 사용하여 현재 시스템을 개선할 수 있는 기회도 많이 있습니다. // 더 훌륭한 전문가 자문 및 지표는 여기에서 확인할 수 있습니다: https://www.mql5.com/en/users/def1380/seller // 또한 수익성 있고 안정적이며 신뢰할 수 있는 신호 https://www.mql5.com/en/signals/1887493에 참여하실 수 있습니다. 본 MQL5 홈페이지에서만 제공되는 오리지널 제품입니다.
      I recommend you to read the   product's blog  (manual) from start to end so that it is clear from the beginning what the indicactor offers. This multi time frame and multi symbol supply and demand zone dashboard indicator sends alerts when the price has reached a supply/demand zone. It is also possible to use it to be alerted about regular double tops/bottoms instead of zones. It can be used with all time frames from M1 to MN. It is possible to use RSI, divergence (MACD, OsMA, RSI or Awesome) a
      Transition Trend
      Tatiana Savkevych
      The Transition Trend indicator shows the points of potential market reversal. The indicator's smart algorithm detects the trend, filters out market noise and generates entry signals and exit levels. Simple, visual and efficient trend detection. Uses just one parameter for settings. The indicator does not redraw and does not lag. You can set up message alerts as sound or email. Works on all currency pairs and all timeframes. Ready-made trading system.
      American Hunters
      Mehmet Ozhan Hastaoglu
      This indicator guides you like a hunter. Tacheprofit and StopLoss levels. See the difference in the experiment. Works in all periods. Works at all rates. You can win with this system. The crossing of the mean and the re-test were done according to the rule. You can see the transactions by moving backwards on the strategy test screen. The whole system is automatically calculated.
      Auto Trend Lines
      Semion Tremsin
      Simply drop the indicator to the graph and support and resistance levels will be shown automatically! The indicator for automatic drawing of support and resistance levels based on THREE points. Identified points are marked on the chart Indicator shows break through price for both bullish and bearish trends (if found) You can specify on how many bars the indicator shall look in order to identify supporting points. In addition, you can select on which time frame the indicator will work. That means
      Pivot Bro
      Thushara Dissanayake
      5 (1)
      Pivot Bro   기술 지표는   Pivot, Fibonacci, ATR   및   ADR   수준을 사용하여 되돌림 영역을 식별하도록 설계된 강력한 도구입니다. 그것은 가격 행동 기반 반전   캔들 패턴을   인식함으로써 그 이상입니다. 또한   통화 측정기는   주요 통화의 진정한 강세를 평가하는 데 유용한 동반자입니다. 28개의 통화 쌍을 분석하고 색상 변화와 함께 차트에 강도를 표시함으로써 트레이더가 진입 및 퇴장 지점에 대해 정보에 입각한 결정을 내릴 수 있습니다. 피벗, 피보나치, ADR, ATR, 반전 캔들스틱 패턴 및 통화 측정기와 같은 인기 있는 지표가 포함된 이 지표는 정확하고 정확한 신호를 위한 포괄적인 도구 세트를 제공합니다. 각 지표는 개별 거래 선호도에 맞게 완벽하게 사용자 정의할 수 있으므로 거래자는 특정 요구에 맞게 설정을 조정할 수 있습니다. 각 표시기의 빠른 활성화/비활성화 기능으로 디스플레이를 편리하게 제어할 수 있습니다. 피보나치 매개변수는 피
      Fibonacci Wave Bands
      Luc Michael Botes
      Fibonacci Wave Bands Indicator The Fibonacci Wave Bands indicator utilizes Fibonacci ratios to create dynamic bands around a central moving average. These bands are derived from key Fibonacci ratios (typically 38.2%, 50%, 61.8%) and adapt to market volatility, offering insights into potential support and resistance zones. Key Features: Fibonacci Levels: The indicator plots multiple bands above and below a central moving average based on Fibonacci ratios. Dynamic Support and Resistance: Bands ser
      Min5 diamonds Indicator
      Mohamed Kamel Touati
      Diamonds Min5   - DM5-   DM5   is an indicator that suggests entering levels (sell or buy) ,it always follow the trends using parabolic sar ,  working on is so easy, you need just to attach it to the chart and all the magic will show , this indicator does not repeat itself or redraw signals . After months of testing, it provides a very good result     it works on all pairs with no excaption 
      Simply drop the indicator to the chart and Fibonacci levels will be shown automatically! The indicator is developed for automatic drawing of Fibonacci levels on the chart. It provides the abilities to: Select the standard Fibo levels to be shown Add custom levels Draw the indicator on the timeframes other than the current one. For example, the indicator is calculated on the weekly period (W1) and is displayed on the monthly period (MN1) Select the timeframes the indicator will be available on Ca
      Arbitrage Macd
      Muhammed Emin Ugur
      Arbitrage MACD: Your Key to Analyzing Market Trends The Arbitrage MACD is a cutting-edge indicator designed to assist traders and investors in analyzing market trends with greater precision and confidence. MACD, which stands for Moving Average Convergence Divergence, is a well-known and widely used tool in the financial world, and the "Arbitrage MACD" takes its functionality to the next level. This innovative indicator offers a comprehensive analysis of the relationship between two moving a
      The indicator allows for quick identification of price reversals by promptly reacting to price impulses and indicating the beginning of a price reversal. The histogram demonstrates the direction of movement and identifies favorable moments for opening positions. It is recommended for use in swing trading and can be applied to any currency pairs, metals, and cryptocurrencies. It is also suitable for binary options trading. Key Features Rapidly identifies changes in the local trend Works on all t
      For this set of indicators 1. General information     - Calculates with high performance mathematical algorithms.     - Calculated from the price of candles     - The entry point of this order is filtered by the train EMA and the oscillator.     - Calculate the integrity of the candle 2. How does it work?     - You can see two types of order entry points: the notification on the monitor and the arrow.     - You can trust 75-95 percent of this entry point. 3. Settings     - A complete candle
      Implement
      Vitalii Zakharuk
      5 (1)
      Implement analyzes market dynamics for pivot points. If you want to learn how to spot the correct reversals for consistently likely profitable trading, buy this indicator. Shows favorable moments of entering the market in stripes. Ready-made trading system. The principle of operation of the indicator is to automatically determine the current state of the market when placed on a chart, analyze historical data based on historical data and display instructions for further actions on the trader's
      이 제품의 구매자들이 또한 구매함
      Gann Made Easy
      Oleg Rodin
      4.93 (87)
      Gann Made Easy 는 mr.의 이론을 사용하여 최고의 거래 원칙을 기반으로 하는 전문적이고 사용하기 쉬운 Forex 거래 시스템입니다. W.D. 간. 이 표시기는 Stop Loss 및 Take Profit Levels를 포함하여 정확한 BUY 및 SELL 신호를 제공합니다. PUSH 알림을 사용하여 이동 중에도 거래할 수 있습니다. 구매 후 연락주세요! 내 거래 팁과 훌륭한 보너스 지표를 무료로 공유하겠습니다! 아마도 Gann 거래 방법에 대해 이미 여러 번 들었을 것입니다. 일반적으로 Gann의 이론은 초보자 거래자뿐만 아니라 이미 거래 경험이 있는 사람들에게도 매우 복잡한 것입니다. Gann의 거래 방식은 이론적으로 적용하기 쉽지 않기 때문입니다. 나는 그 지식을 연마하고 Forex 지표에 최고의 원칙을 적용하기 위해 몇 년을 보냈습니다. 표시기는 적용하기가 매우 쉽습니다. 차트에 첨부하고 간단한 거래 권장 사항을 따르기만 하면 됩니다. 지표는 지속적으로 시장 분석 작업
      Scalper Inside PRO
      Alexey Minkov
      4.75 (59)
      An exclusive indicator that utilizes an innovative algorithm to swiftly and accurately determine the market trend. The indicator automatically calculates opening, closing, and profit levels, providing detailed trading statistics. With these features, you can choose the most appropriate trading instrument for the current market conditions. Additionally, you can easily integrate your own arrow indicators into Scalper Inside Pro to quickly evaluate their statistics and profitability. Scalper Inside
      현재 20% 할인 ! 초보자 또는 전문가 트레이더를 위한 최고의 솔루션! 이 대시보드 소프트웨어는 28개의 통화 쌍에서 작동합니다. 2가지 주요 지표(Advanced Currency Strength 28 및 Advanced Currency Impulse)를 기반으로 합니다. 전체 Forex 시장에 대한 훌륭한 개요를 제공합니다. 고급 통화 강도 값, 통화 이동 속도 및 모든(9) 시간대의 28 Forex 쌍에 대한 신호를 보여줍니다. 추세 및/또는 스캘핑 기회를 정확히 파악하기 위해 차트의 단일 지표를 사용하여 전체 시장을 볼 수 있을 때 거래가 어떻게 개선될지 상상해 보십시오! 잠재적인 거래를 식별하고 확인하면서 강력한 통화와 약한 통화를 더욱 쉽게 식별할 수 있도록 이 지표에 기능을 내장했습니다. 이 표시기는 통화의 강세 또는 약세가 증가 또는 감소하는지 여부와 모든 시간대에서 수행되는 방식을 그래픽으로 보여줍니다. 추가된 새로운 기능은 현재 시장 조건 변화에 적
      TPSpro RFI Levels
      Roman Podpora
      4.86 (21)
      Reversal First Impulse levels (RFI)    INSTRUCTIONS        RUS       -       ENG              R ecommended to use with an indicator   -   TPSpro  TREND PRO -  Version MT5 A key element in trading is zones or levels from which decisions to buy or sell a trading instrument are made. Despite attempts by major players to conceal their presence in the market, they inevitably leave traces. Our task was to learn how to identify these traces and interpret them correctly. Main functions: Displaying activ
      AT Forex Indicator MT4
      Marzena Maria Szmit
      5 (2)
      The AT Forex Indicator MT4 is a sophisticated trading tool designed to provide traders with a comprehensive analysis of multiple currency pairs. This   powerful indicator   simplifies the complex nature of the forex market, making it accessible for both novice and experienced traders. AT Forex Indicator uses   advanced algorithms   to detect trends, patterns and is an essential tool for traders aiming to enhance their forex trading performance. With its robust features, ease of use, and reliabl
      FX Power MT4 NG
      Daniel Stein
      5 (11)
      모닝 브리핑 여기 mql5 와 텔레그램에서 FX Power MT4 NG 는 오랫동안 인기 있는 통화 강도 측정기인 FX Power의 차세대 버전입니다. 이 차세대 강도 측정기는 무엇을 제공합니까? 기존 FX Power에서 좋아했던 모든 것 PLUS GOLD/XAU 강도 분석 더욱 정밀한 계산 결과 개별 구성 가능한 분석 기간 더 나은 성능을 위한 사용자 정의 가능한 계산 한도 특별 멀티더 많은 것을보고 싶은 사람들을위한 특별한 다중 인스턴스 설정 모든 차트에서 좋아하는 색상을위한 끝없는 그래픽 설정 수많은 알림 옵션, 중요한 것을 다시는 놓치지 않도록 Windows 11 및 macOS 스타일의 둥근 모서리가 있는 새로운 디자인 마법처럼 움직이는 인디케이터 패널 FX 파워 키 특징 모든 주요 통화의 완전한 강세 이력 모든 시간대에 걸친 통화 강세 이력 모든 브로커 및 차트에서 고유 계산 결과 100% 신뢰할 수있는 실시간100 % 신뢰할 수있는 실시간 계산-> 다시 칠하지 않음
      TPSproTREND PrO
      Roman Podpora
      4.78 (18)
      TPSpro TRENDPRO  - is a trend indicator that automatically analyzes the market and provides information about the trend and each of its changes, as well as giving signals for entering trades without redrawing! The indicator uses each candle, analyzing them separately. referring to different impulses - up or down impulse. Exact entry points into transactions for currencies, crypto, metals, stocks, indices!  -  Version MT5               DETAILED DESCRIPTION                R ecommended to use with
      Indicator : RealValueIndicator Description : RealValueIndicator is a powerful tool designed specifically for trading on the EURUSD pair. This indicator analyzes all EUR and USD pairs, calculates their real currency strength values, and displays them as a single realistic value to give you a head start on price. This indicator will tell you moves before they happen if you use it right. RealValueIndicator allows you to get a quick and accurate overview of the EURUSD currency pair tops and bottoms,
      Quantum Trend Sniper Indicator MT4
      Bogdan Ion Puscasu
      4.6 (40)
      소개       Quantum Trend Sniper Indicator는   추세 반전을 식별하고 거래하는 방식을 변화시키는 획기적인 MQL5 지표입니다! 13년 이상의 거래 경험을 가진 숙련된 트레이더 팀이 개발한       Quantum Trend Sniper 표시기       매우 높은 정확도로 추세 반전을 식별하는 혁신적인 방법으로 거래 여정을 새로운 차원으로 끌어올리도록 설계되었습니다. ***Quantum Trend Sniper Indicator를 구입하면 Quantum Breakout Indicator를 무료로 받을 수 있습니다!*** Quantum Trend Sniper Indicator는 추세 반전을 식별하고 세 가지 이익실현 수준을 제안할 때 경고, 신호 화살표를 제공합니다. 초보자 거래자와 전문 거래자 모두에게 적합합니다. Quantum EA 채널:       여기를 클릭하세요 MT5 버전:       여기를 클릭하세요
      TrendMaestro
      Stefano Frisetti
      5 (3)
      note: this indicator is for METATRADER4, if you want the version for METATRADER5 this is the link:  https://www.mql5.com/it/market/product/108106 TRENDMAESTRO ver 2.4 TRENDMAESTRO recognizes a new TREND in the bud, he never makes mistakes. The certainty of identifying a new TREND is priceless. DESCRIPTION TRENDMAESTRO identifies a new TREND in the bud, this indicator examines the volatility, volumes and momentum to identify the moment in which there is an explosion of one or more of these data a
      Atomic Analyst
      Issam Kassas
      5 (3)
      우선적으로 언급할 점은이 거래 지표가 다시 그리지 않고 지연되지 않으며 이를 통해 수동 및 로봇 거래 모두에 이상적이라는 점입니다. 사용자 매뉴얼: 설정, 입력 및 전략. Atomic Analyst는 가격의 강도와 모멘텀을 활용하여 시장에서 더 나은 이점을 찾는 PA Price Action Indicator입니다. 고급 필터를 장착하여 잡음과 거짓 신호를 제거하고 거래 잠재력을 높이는 데 도움이 됩니다. 복잡한 지표의 다중 레이어를 사용하여 Atomic Analyst는 차트를 스캔하고 복잡한 수학적 계산을 간단한 신호와 색상으로 변환하여 초보 트레이더가 이해하고 일관된 거래 결정을 내릴 수 있도록합니다. "Atomic Analyst"는 새로운 및 경험이 풍부한 트레이더를위한 종합적인 거래 솔루션입니다. 프리미엄 지표와 최고 수준의 기능을 하나의 거래 전략에 결합하여 모든 종류의 트레이더에 대한 다재다능한 선택지가되었습니다. 인트라데이 거래 및 스캘핑 전략 : 빠르고 정확한
      Advanced Currency Strength28 Indicator
      Bernhard Schweigert
      4.91 (665)
      현재 26% 할인 초보자 또는 전문가 트레이더를 위한 최고의 솔루션! 이 지표는 우리가 독점 기능과 새로운 공식을 통합했기 때문에 독특하고 고품질이며 저렴한 거래 도구입니다. 단 하나의 차트로 28 Forex 쌍의 통화 강도를 읽을 수 있습니다! 새로운 추세 또는 스캘핑 기회의 정확한 트리거 포인트를 정확히 찾아낼 수 있기 때문에 거래가 어떻게 개선될지 상상해 보십시오. 사용 설명서: 여기를 클릭  https://www.mql5.com/en/blogs/post/697384 그것이 첫 번째, 원본입니다! 쓸모없는 지망생 클론을 사지 마십시오. 더 스페셜  강력한 통화 모멘텀을 보여주는 하위 창의 화살표 GAP가 거래를 안내합니다! 기본 또는 호가 통화가 과매도/과매도 영역(외부 시장 피보나치 수준)에 있을 때 개별 차트의 기본 창에 경고 표시가 나타납니다. 통화 강도가 외부 범위에서 떨어질 때 풀백/반전 경고. 교차 패턴의 특별 경고 추세를 빠르게 볼 수 있는
      M1 Arrow
      Oleg Rodin
      5 (14)
      시장의 두 가지 기본 원칙에 기반한 일중 전략. 알고리즘은 추가 필터를 사용하여 거래량 및 가격 파동 분석을 기반으로 합니다. 지표의 지능형 알고리즘은 두 가지 시장 요인이 하나로 결합될 때만 신호를 제공합니다. 지표는 더 높은 시간 프레임의 데이터를 사용하여 M1 차트에서 특정 범위의 파도를 계산합니다. 그리고 파동을 확인하기 위해 지표는 볼륨 분석을 사용합니다. 이 표시기는 준비된 거래 시스템입니다. 트레이더가 필요로 하는 모든 것은 신호를 따르는 것입니다. 또한 지표는 자신의 거래 시스템의 기초가 될 수 있습니다. 거래는 분 차트에서만 수행됩니다. 지표가 MTF 원리를 사용한다는 사실에도 불구하고 지표 알고리즘은 가능한 한 안정적입니다. 구매 후 반드시 저에게 편지를 보내주세요! 내 거래 설정 및 권장 사항을 공유하겠습니다!
      Advanced Supply Demand
      Bernhard Schweigert
      4.92 (313)
      현재 33% 할인! 초보자나 전문 트레이더를 위한 최고의 솔루션! 이 보조지표는 우리가 다수의 독창적 기능과 새로운 공식을 통합한 독특하고 고품질이며 저렴한 거래 도구입니다. 이 업데이트를 통해 이중 시간대를 표시할 수 있습니다. 더 높은 TF를 표시할 수 있을 뿐만 아니라 차트 TF와 더 높은 TF 모두를 표시할 수 있습니다: 중첩 영역 표시. 모든 Supply Demand 트레이더들이 좋아할 것입니다. :) 중요한 정보 공개 Advanced Supply Demand의 잠재력을 극대화하려면 다음을 방문하십시오. https://www.mql5.com/ko/blogs/post/720245   진입 또는 목표의 명확한 트리거 포인트를 정확히 찾아냄으로 해서 거래가 어떻게 개선될지 상상해 보십시오. 새로운 알고리즘을 기반으로 매수자와 매도자 간의 잠재적인 불균형을 훨씬 더 쉽게 분간할 수 있습니다. 왜냐하면 가장 강한 공급영역과 가장 강한 수요 영역과 과거에 어떻게 진행 되었는지를(이
      Quantum Breakout Indicator PRO
      Bogdan Ion Puscasu
      4.96 (26)
      소개       Quantum Breakout PRO   , 브레이크아웃 존 거래 방식을 변화시키는 획기적인 MQL5 지표! 13년 이상의 거래 경험을 가진 숙련된 트레이더 팀이 개발한   Quantum Breakout PRO는   혁신적이고 역동적인 브레이크아웃 영역 전략으로 거래 여정을 새로운 차원으로 끌어올리도록 설계되었습니다. Quantum Breakout Indicator는 5개의 이익 목표 영역이 있는 브레이크아웃 영역의 신호 화살표와 브레이크아웃 상자를 기반으로 한 손절 제안을 제공합니다. 초보자 거래자와 전문 거래자 모두에게 적합합니다. Quantum EA 채널:       여기를 클릭하세요 MT5 버전 :   여기를 클릭하세요 중요한! 구매 후 설치 매뉴얼을 받으려면 개인 메시지를 보내주십시오. 추천: 기간: M15 통화쌍: GBPJPY, EURJPY, USDJPY,NZDUSD, XAUUSD 계정 유형: 스프레드가 매우 낮은 ECN, Ra
      NAM Order Blocks
      NAM TECH GROUP, CORP.
      5 (1)
      MT4 Multi-timeframe Order Blocks detection indicator. Features - Fully customizable on chart control panel, provides complete interaction. - Hide and show control panel wherever you want. - Detect OBs on multiple timeframes. - Select OBs quantity to display. - Different OBs user interface. - Different filters on OBs. - OB proximity alert. - ADR High and Low lines. - Notification service (Screen alerts | Push notifications). Summary Order block is a market behavior that indicates order collection
      FX Volume
      Daniel Stein
      4.61 (36)
      모닝 브리핑을 통해 세부 정보와 스크린샷으로 매일 시장 업데이트를 받으세요 여기 mql5 및 텔레그램에서 FX 거래량은 브로커의 관점에서 시장 심리에 대한 실제 통찰력을 제공하는 최초이자 유일한 거래량 지표입니다. 브로커와 같은 기관 시장 참여자가 외환 시장에서 어떤 포지션을 취하고 있는지에 대한 훌륭한 통찰력을 COT 보고서보다 훨씬 빠르게 제공합니다. 차트에서 이 정보를 직접 확인하는 것은 트레이딩의 진정한 판도를 바꾸고 획기적인 솔루션입니다. 다음과 같은 고유한 시장 데이터 인사이트의 이점 비율 는 통화의 매수/매도 포지션 비율을 백분율로 표시 비율 변화 는 선택한 기간 내 매수 비율과 비율 변화를 표시 총 거래량 는 해당 통화의 총 거래량(롱 및 숏)을 로트 단위로 보여줍니다 Volumes Long 는 해당 통화의 모든 롱 포지션의 거래량을 보여줍니다 Volumes Short 는 해당 통화의 모든 숏 포지션의 거래량을 보여줍니다 Net Long 는 순 롱 포지션의 거래량
      Enigmera
      Ivan Stefanov
      5 (4)
      에니메라: 시장의 핵심 https://www.enigmera.com 소개 이 지표 및 트레이딩 시스템은 금융 시장에 대한 놀라운 접근 방식입니다. 에니메라는 프랙탈 주기를 사용하여 지지선과 저항선을 정확하게 계산합니다. 진정한 축적 단계를 보여주고 방향과 목표를 제시합니다.  추세에 있든 조정에 있든 작동하는 시스템입니다.  어떻게 작동하나요? 에니메라는 지지선/저항선, 목표선, 편차선의 세 가지 라인으로 구성됩니다. 이 시스템은 과거 데이터를 현재와 미래로 추정하는 일반적인 시장 지표와 달리 현재에 대한 완전한 그림을 제공합니다. 지지선 위에 있으면 실제 지지를 의미하고 저항선 위에 있으면 실제 저항을 의미합니다. 레벨이 깨지면 추세의 변화를 나타냅니다. 다시 그리지 않습니다. 시장이 지속적으로 진화함에 따라 에니메라는 평가 도구를 조정하여 전략을 정기적으로 수정합니다.   이를 통해 모든 시나리오를 철저히 평가할 수 있습니다. 이 시장 지표의 고유성은 분명하며 그 기
      TrendDecoder Premium
      Christophe Pa Trouillas
      5 (6)
      범위 및 다음 가능한 움직임 식별   |  추세의 초기 신호와 강도를 확인하세요   |  반전 전 명확한 출구 확보   |  가격이 테스트 할 피보 레벨 파악 비추적, 비지연 지표 - 수동 및 자동 거래에 이상적 - 모든 자산 및 모든 시간 단위에 적합 기간 한정 혜택 >>   50% 할인 구매 후 이 채널로 문의 하여 권장 설정을 확인하세요. MT5   버전:   여기를 클릭하세요 BladeSCALPER   및   PowerZONES   로 전체 방법을 확인하세요. 어떤 서비스인가요? 트렌드디코더는 추세 모니터링을 간단하고 쉽게 하기 위한 여러 혁신 기술의 집약체입니다. 투영 추세선(투영 추세선) - 다가오는 추세의 속도 기준 실시간 추세선과 투영 추세선 비교 - 시장이 이전과 같은 방향으로 움직이고 있는지, 아니면 둔화되고 있는지? 실시간 추세선 교차 - 추세가 궤도를 이탈하고 있습니다. 그레이박스 - 시장이 더 이상 추세가 아니며 새로운 전환기에 들어섰습
      Cycle Sniper
      Elmira Memish
      4.41 (37)
      NEW YEAR SALE PRICE FOR LIMITED TIME!!! Please contact us after your purchase and we will send you the complimentary indicators to complete the system Cycle Sniper is not a holy grail but when you use it in a system which is explained in the videos, you will feel the difference. If you are not willing to focus on the charts designed with Cycle Sniper and other free tools we provide, we recommend not buying this indicator. We recommend watching the videos about the indiactor and system before pu
      Legacy of Gann
      Pavel Zamoshnikov
      4.85 (13)
      The indicator very accurately determines the levels of the possible end of the trend and profit fixing. The method of determining levels is based on the ideas of W.D.Gann, using an algorithm developed by his follower Kirill Borovsky. Extremely high reliability of reaching levels (according to K. Borovsky  - 80-90%) Indispensable for any trading strategy – every trader needs to determine the exit point from the market! Precisely determines targets on any timeframes and any instruments (forex, met
      All in One Trade
      Alexey Minkov
      4.48 (27)
      The All-in-One Trade Indicator (AOTI) determines daily targets for EURUSD, EURJPY, GBPUSD, USDCHF, EURGBP, EURCAD, EURAUD, AUDJPY, GBPAUD, GBPCAD, GBPCHF, GBPJPY, AUDUSD, and USDJPY. All other modules work with any trading instruments. The indicator includes various features, such as Double Channel trend direction, Price channel, MA Bands, Fibo levels, Climax Bar detection, and others. The AOTI indicator is based on several trading strategies, and created to simplify market analysis. All-in-One
      Currency Strength Wizard
      Oleg Rodin
      4.91 (46)
      통화 강도 마법사는 성공적인 거래를 위한 올인원 솔루션을 제공하는 매우 강력한 지표입니다. 표시기는 여러 시간 프레임의 모든 통화 데이터를 사용하여 이 또는 해당 외환 쌍의 힘을 계산합니다. 이 데이터는 특정 통화의 힘을 확인하는 데 사용할 수 있는 사용하기 쉬운 통화 지수 및 통화 전력선의 형태로 표시됩니다. 필요한 것은 거래하려는 차트에 표시기를 부착하는 것뿐입니다. 표시기는 거래하는 통화의 실제 강세를 보여줍니다. 지표는 또한 추세와 거래할 때 유리하게 사용할 수 있는 구매 및 판매 거래량 압력의 극한값을 보여줍니다. 지표는 또한 피보나치에 기반한 가능한 대상을 보여줍니다. 표시기는 PUSH 알림을 포함한 모든 유형의 알림을 제공합니다. 구매 후 연락주세요. 나는 당신과 거래 팁을 공유하고 당신에게 무료로 훌륭한 보너스 지표를 줄 것입니다! 나는 당신에게 행복하고 유익한 거래를 기원합니다!
      TakePropips Donchian Trend Pro
      Eric John Pajarillaga Aldana
      4.61 (18)
      TakePropips Donchian Trend Pro   (MT4)는 Donchian 채널을 사용하여 추세의 방향을 자동으로 감지하고 진입 및 퇴장 거래 신호를 제공하는 강력하고 효과적인 도구입니다! 이 다기능 지표에는 추세 스캐너, 거래 신호, 통계 패널, 스크리너, 거래 세션 및 경고 내역 대시보드가 포함됩니다. 거래 신호를 제공하고 차트 분석 시간을 절약하도록 설계되었습니다! 다음 블로그 게시물에서 사용자 설명서 및 설치 가이드를 다운로드할 수 있습니다.   https://www.mql5.com/en/blogs/post/751368 오늘 50% 할인을 받으세요! 가격이 $98에서 $49로 인하되었습니다! 전략 테스터에서 이 지표를 테스트할 수 있습니다(비주얼 모드 활성화).  자세한 내용은 설명 아래에 비디오 자습서도 제공됩니다. 질문이 있거나 도움이 필요하면 저에게 연락하십시오. TakePropips Donchian Trend Pro 지표는 모든 Forex 쌍, 금속
      ICT, SMC, SMART MONEY CONCEPTS, SMART MONEY, Smart Money Concept, Support and Resistance, Trend Analysis, Price Action, Market Structure, Order Blocks, BOS/CHoCH,   Breaker Blocks ,  Momentum Shift,   Supply&Demand Zone/Order Blocks , Strong Imbalance, HH/LL/HL/LH,    Fair Value Gap, FVG,  Premium  &   Discount   Zones, Fibonacci Retracement, OTE, Buy Side Liquidity, Sell Side Liquidity, BSL/SSL Taken, Equal Highs & Lows, MTF Dashboard, Multiple Time Frame, BigBar, HTF OB, HTF Market Structure, 
      Entry Points Pro
      Yury Orlov
      4.7 (226)
      다시 색을 칠하지 않고 거래에 진입할 수 있는 정확한 신호를 제공하는 MT4용 지표입니다. 외환, 암호화폐, 금속, 주식, 지수 등 모든 금융 자산에 적용할 수 있습니다. 매우 정확한 추정값을 제공하고 매수와 매도의 가장 좋은 시점을 알려줍니다. 하나의 시그널로 수익을 내는 지표의 예와 함께 비디오 (6:22)시청하십시오! 대부분의 거래자는 Entry Points Pro 지표의 도움으로 첫 거래 주 동안 트레이딩 결과를 개선합니다. 저희의   Telegram Group 을 구독하세요! Entry Points Pro 지표의 좋은점. 재도색이 없는 진입 신호 신호가 나타나고 확인되면(시그널 캔들이 완성된 경우) 신호는 더 이상 사라지지 않습니다. 여타 보조지표의 경우 신호를 표시한 다음 제거되기 때문에 큰 재정적 손실로 이어집니다. 오류 없는 거래 게시 알고리즘을 통해 트레이드(진입 또는 청산)를 할 이상적인 순간을 찾을 수 있으며, 이를 통해 이를 사용하는 모든 거래자의
      PTS Precision Index Oscillator V2
      PrecisionTradingSystems
      5 (2)
      프리시전 트레이딩 시스템의 로저 메드칼프에 의한 프리시전 인덱스 오실레이터 (Pi-Osc) 버전 2는 차트에 신속하게 로드되도록 주의 깊게 다시 코딩되었으며 경험을 향상시키기 위해 몇 가지 다른 기술적 개선 사항이 통합되었습니다. Pi-Osc는 정확한 거래 타이밍 신호를 제공하도록 개발되었으며 시장이 모든 사람의 스톱을 청산하기 위해 가야 하는 극도의 고갈 지점을 찾는 데 목적이 있습니다. 이 제품은 극단적인 지점이 어디에 있는지 알고 있는 고전적인 문제를 해결하며 트레이더로서의 삶을 훨씬 간단하게 만듭니다. 이것은 업계 표준 오실레이터와는 상당히 다른 강력한 차이점을 가지고 있는 고도로 복잡한 합의 지표입니다. 사용하는 기능 중 일부는 수요 지수, 자금 흐름, RSI, 스토캐스틱, 패턴 인식, 거래량 분석, 표준 편차 극단점 및 다양한 길이에서 위와 유사한 변형을 갖습니다. 미숙한 눈에는 다른 오실레이터와 비슷해 보일 수 있지만 RSI 또는 모멘텀과 같은 다
      Pro SMC Tool
      The Anh Pham
      Welcome to the world of SMC (Smart Money Concepts) Trading, where we empower traders with the tools and knowledge to make smarter trading decisions. Our latest addition to our suite of trading tools is the SMC Trading Pro indicator, version 1.0. Key Features: Major Market Structure Identification with BODY break. Order Block must be in Major Swing ( not Small Swing ). Order Block with Fair Value Gap Detection. Order Block in Discount | Premium zone. Filter for only Bullish, Bearish or All Order
      ZeusArrow Smart Liquidity Finder  Smart Liquidity Finder is Ai controlled indicator based on the Idea of Your SL is My Entry. It scan and draws the major Liquidity areas on chart partitioning them with Premium and Discount Zone and allows you find the best possible trading setups and help you decide the perfect entry price to avoid getting your Stop Loss hunted . Now no more confusion about when to enter and where to enter. Benefit from this one of it's kind trading tool powered by Ai an trade
      A. A2SR이란 무엇입니까 ?   * 선행 기술 지표입니다(재도장 없음, 지연 없음). -- 안내 : https://www.mql5.com/en/blogs/post/734748/page4#comment_16532516 -- 및 https://www.mql5.com/en/users/yohana/blog A2SR에는 지원(수요) 및 저항(공급) 수준을 결정하는 특별한 기술이 있습니다. 우리가 인터넷에서 본 일반적인 방식과 달리 A2SR은 실제 SR 수준을 결정하는 독창적인 개념을 가지고 있습니다. 원래 기술은 인터넷에서 가져온 것이 아니며 인터넷에 게시된 적도 없습니다. A2SR은 거래 스타일에 따라 SR 수준을 자동으로 선택합니다. 시간 프레임을 변경해도 SR 레벨은 그대로 유지됩니다. 사용하는 시간 프레임에서 실제 SR을 얻지 못하기 때문입니다. A2SR은 거래를 위한 완전한 상품을 보유하고 있습니다 . 실제 지원(수요) 및 저항(공급)에 대한 진정한 개념. 뉴스 이벤트
      필터:
      리뷰 없음
      리뷰 답변