Market Dynamics
- 지표
- Thomas Bradley Butler
- 버전: 3.0
- 업데이트됨: 17 10월 2022
- 활성화: 5
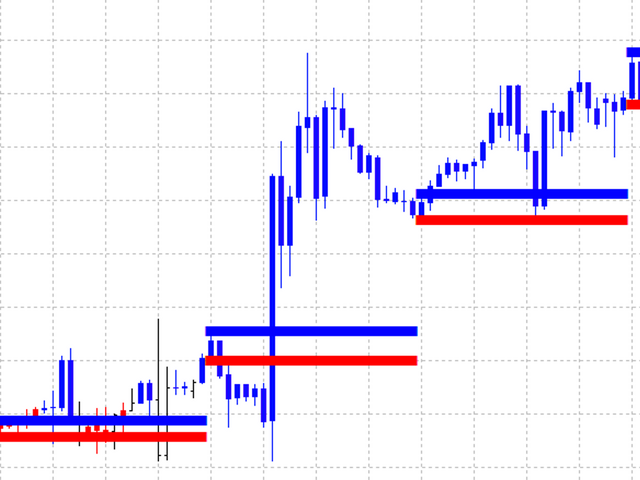
Market Dynamics는 추세 스캘핑을 위한 것입니다. 파란색이 매수, 빨간색이 매도입니다. 라인은 가격 통합 영역이며 일반 막대 캔들은 결정되지 않았습니다. 가격은 지지선과 저항선 사이에서 통합된 다음 해당 영역에서 가격 움직임이 발생합니다. 두피 위 또는 아래에 그림 영역을 그리고 두피에 대한 주요 트렌드 또는 데이 트레이드를 따르십시오.
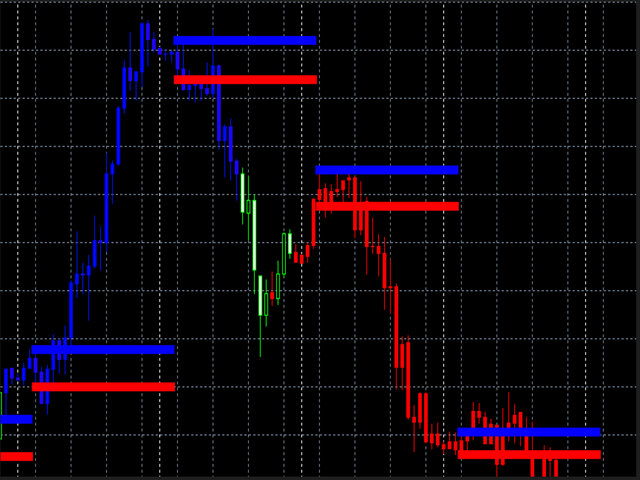
Market Dynamics는 추세 스캘핑을 위한 것입니다. 파란색이 매수, 빨간색이 매도입니다. 라인은 가격 통합 영역이며 일반 막대 캔들은 결정되지 않았습니다. 가격은 지지선과 저항선 사이에서 통합된 다음 해당 영역에서 가격 움직임이 발생합니다. 두피 위 또는 아래에 그림 영역을 그리고 두피에 대한 주요 트렌드 또는 데이 트레이드를 따르십시오.