RSI Trend Trader mt4
- 지표
- Natasha Diedericks
- 버전: 1.0
- 활성화: 15
This indicator takes input from the RSI, combined with a trend filter.
Great for scalping.
Does not feature any alerts and is best used manually.
Settings:
TrendFilterPeriod
RSIPeriod
Set these parameters to your preference.
How to use:
Attach to any chart with default settings.
Can be used on any time frame. If used on lower time frames, check higher time frames too.
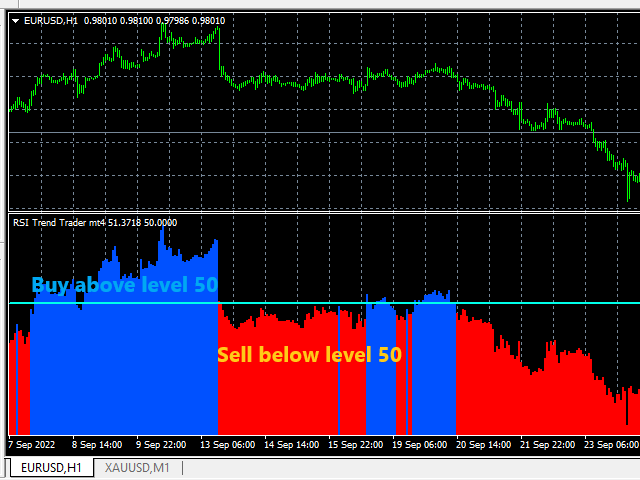
Buy:
- Wait for blue histo color to cross above level 50, then open buys.
**Best results when checking the higher time frames too.
Sell:
- Wait for red histo color to cross below level 50, then open sells.
**Best results when checking the higher time frames too.
Or backtest and use as you see fit for your strategy.
See picture below.
Best results on Major Pairs, but can also be used on other pairs (Metals, Minors).
Important to note:
-
Please do not use this indicator haphazardly. Make sure it compliments your strategy.
-
Don't risk money you cannot afford to lose.
-
You use this indicator at your own risk. Please apply money management wisely.
-
Always test your strategy on a demo account before using a new indicator on a live account.