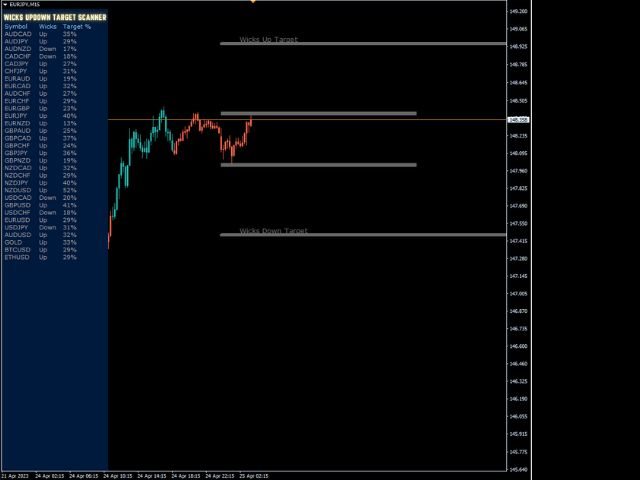
Wicks UpDown Target
- 지표
- Lee Teik Hong
- 버전: 1.20
- 업데이트됨: 25 4월 2023
- 활성화: 20
Wicks UpDown Target
Choppy movement up and down on the opening range every day.
Trading breakouts on London session and New York session is recommended.
Wicks UpDown Target is specialized in all forex pairs.
Guideline
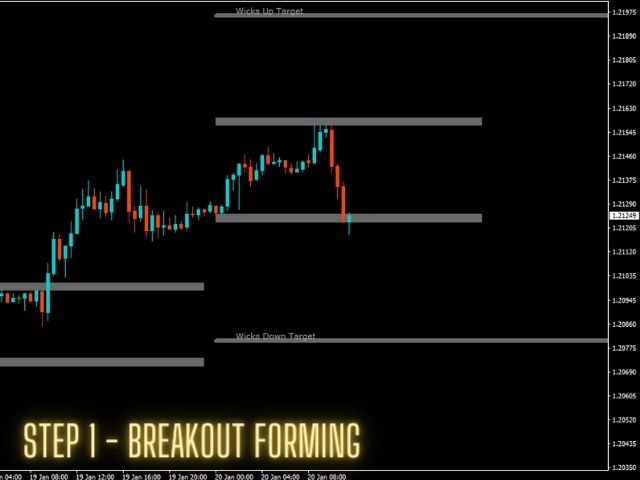
Entry Strategy Idea:
Step 1 - Breakout Forming (Warning! Trade on London Session and New York Session)
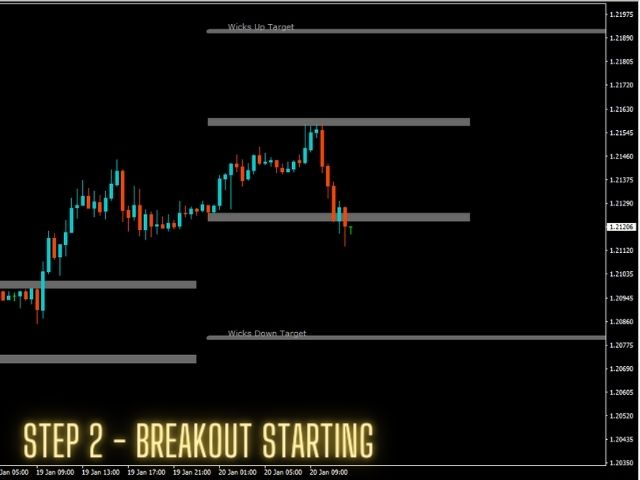
Step 2 - Breakout Starting (Take Action on your trading plan)
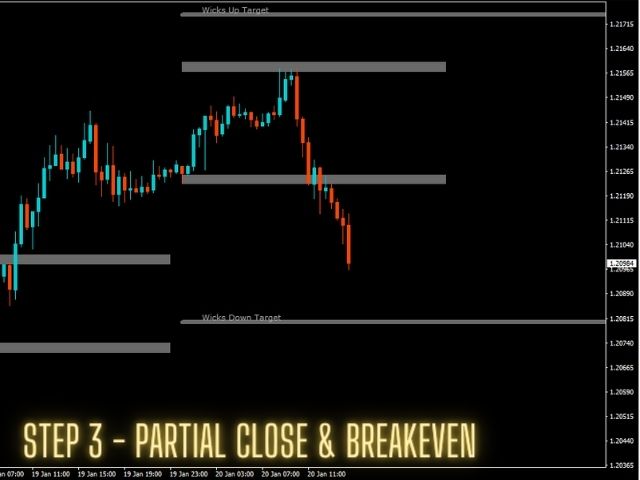
Step 3 - Partial Close your order & set breakeven (no-risk)
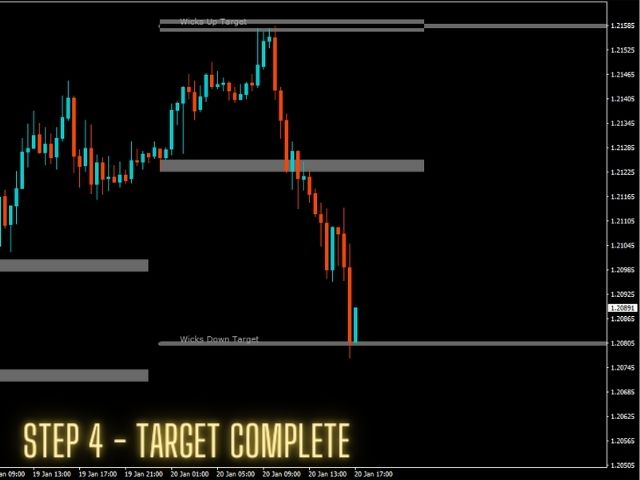
Step 4 - Target complete
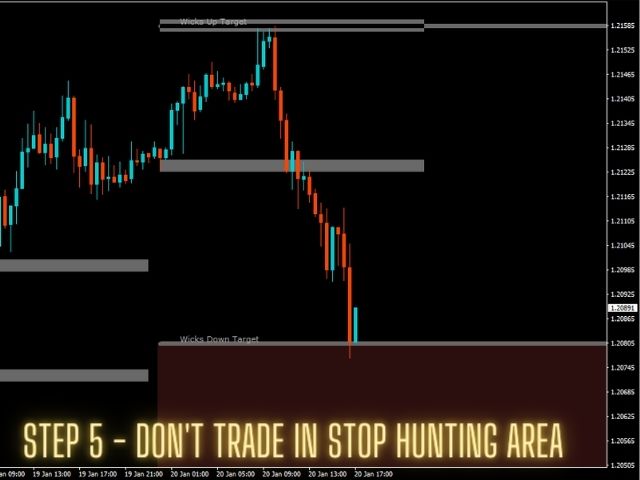
Step 5 - Don't trade in Stop Hunting Area
Remark: Wait for price to breakout and set your TP (Take Profit) using the Wicks Up Target Line or Wicks Down Target Line shown on the chart.
Parameter:
- Indicator Name
- Average Data Analysis Range
- Days to Show Wicks Breakout
- Chart Setting
- Wicks Breakout Line Color
- Wicks UpDown Target Line Color
- Wicks UpDown Target Line Thickness
- Wicks UpDown Target Line Style
- Wicks UpDown Target Font Color
- Wicks Line Description Selection
Add on features (Version 1.20):
- Symbols Selection - Market Watch Scanner
- Aler Setting
- Stop Hunting Level Alert Turn ON
- Percentage Reminder Alert Turn ON
- How many percentage for Alert
- Buffer minutes in Alert Setting
- Data Show Turn ON