Supply And Demand Levels Detector
- 지표
- Siyabonga Howick Masilela
- 버전: 1.21
- 업데이트됨: 24 9월 2022
- 활성화: 5
MT5 표시기.
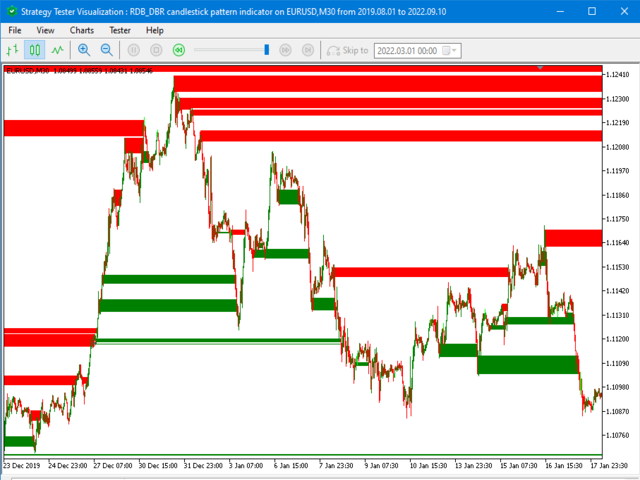
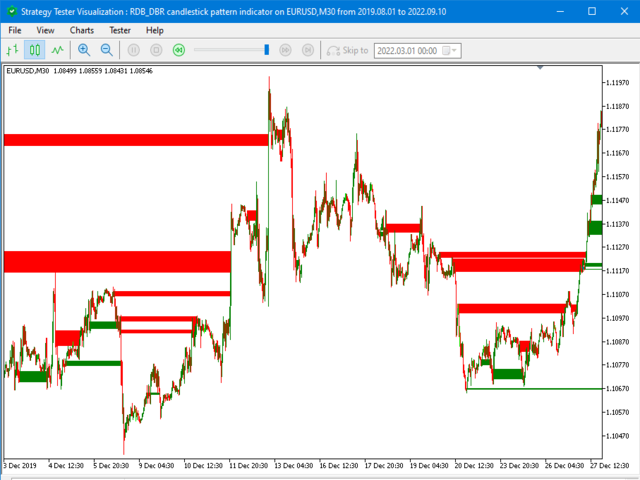
이 표시기는 모든 차트, 모든 시간대 및 브로커에서 수요 및 공급 영역을 감지합니다. 기술적 분석에 적합합니다.
기본적으로 빨간색 선은 강한 판매 영역을 나타내고 녹색 선은 강한 구매 영역을 나타냅니다. 선이 그려지면(녹색 또는 빨간색) 가격이 해당 영역으로 돌아와 선을 닫을 확률이 99%입니다.
입력:
- (bool) Four_candle = false : 내부 계산에 4개의 촛불 규칙을 사용하는 옵션입니다. 기본값은 false로 설정됩니다.
- (bool) Five_candle = false : 내부 계산에 다섯 개의 촛불 규칙을 사용하는 옵션입니다. 기본값은 true로 설정됩니다.
- (color) Buy_color = Green : BUY 신호선의 색상을 선택하는 옵션입니다. 기본값은 녹색으로 설정됩니다.
- (color) Sell_color = Red : SELL 신호선의 색상을 선택하는 옵션입니다. 기본값은 빨간색으로 설정됩니다.
첨부된 비디오는 표시기가 사용자에게 이러한 영역을 알리는 방법을 보여줍니다.