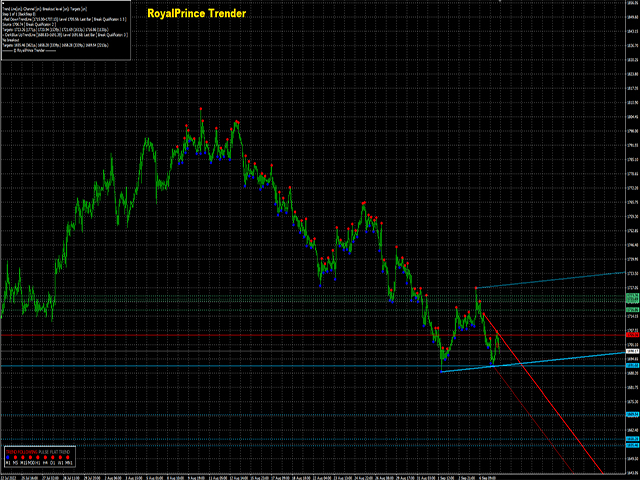
• 미리보기
  • 리뷰
  • 코멘트

RoyalPrince Trender

Trender is a special TrendLine Indicator because it is combined with a NON-REPAINT Signal

Settings:

  • showBars =  if showBars= 0 so the indicator will be shown for all the chart
  • PointLevel = Point Levels; 2 = central bar will be higher (lower) then 2 bars on the left side and 2 bars on the right one.
  • qSteps  = number of steps/ no more than 3
  • BackStep = number of steps back
  • startBar= if startBar=0 so we have recommendation for the current bar, if 1 - for possible next bar
  • TrendLine= True = Trendlines / false = no trend lines
  • Horizontal Line = true = Shows break level lines
  • Channel Line = true = channels which is parallel with trend lines / False = Off 
  • TakeLines = true = Will show expected take profit lines in both directions so if Trend is Bullish look for the Bullish Profit if Trend is Bearish look for the Bearish Profit Lines
  • TrendLine Options =  Show Uptrend Only, Show Downtrend Only, or Show both Trend lines

Works on all pairs and all  TimeFrame

Bottom of Screen you will have a Trend Indicator that will show you what is happening on all Timeframe for that pair it will make it easier so you don't have to switch Timeframes


추천 제품
This is a combination of multiple oscillators into a single divergence system that creates the impression of a more reliable divergence indicator. It is multi-currency based and works best on 15 minutes timeframe and above. Every time a signal is generated, it shows an alert to the user. It is more ideal if combined with other price action indicators or trading systems.
MACD Max
John Louis Fernando Diamante
A flexible 2-Line MACD indicator The default MACD indicator inside MT4, limits you to using the MACD with a fast-EMA, slow-EMA, and signal-SMA. This MACD indicator allows you to set your own MA-Method choices for these 3 components, separately! You can select from SMA-EMA-SMMA-LWMA-DEMA-TEMA, and can even use a separate method for each 3 fast-slow-signal periods. On-chart colored candles, with drawing condition types is included, with a show/hide button too. Features - MA Methods: SMA, EMA, S
VR Cub
Vladimir Pastushak
VR Cub 은 고품질 진입점을 얻는 지표입니다. 이 지표는 수학적 계산을 용이하게 하고 포지션 진입점 검색을 단순화하기 위해 개발되었습니다. 지표가 작성된 거래 전략은 수년 동안 그 효율성을 입증해 왔습니다. 거래 전략의 단순성은 초보 거래자라도 성공적으로 거래할 수 있다는 큰 장점입니다. VR Cub은 포지션 개시 지점과 이익 실현 및 손절매 목표 수준을 계산하여 효율성과 사용 편의성을 크게 높입니다. 간단한 거래 규칙을 이해하려면 아래 전략을 사용한 거래 스크린샷을 살펴보세요. 설정, 세트 파일, 데모 버전, 지침, 문제 해결 등은 다음에서 얻을 수 있습니다. [블로그] 다음에서 리뷰를 읽거나 작성할 수 있습니다. [링크] 버전 [MetaTrader 5] 진입점 계산 규칙 포지션 개설 진입점을 계산하려면 VR Cub 도구를 마지막 최고점에서 마지막 최저점까지 늘려야 합니다. 첫 번째 지점이 두 번째 지점보다 빠른 경우, 거래자는 막대가 중간선 위에서 마감될 때까지 기다립
The Four Moving Averages Message indicator ( please see the description and video ), a version of Four Moving Averages , concurrently displays four Moving Averages with default settings in the main chart window: Green and Red ones represent a short-term trend, Red and Blue ones - mid-term trend, while Blue and Yellow ones - long-term trend. You can change the moving average settings and colors. However, these parameters have been configured so that to allow trading on all time frames. The built-
The indicator detects and displays Shark harmonic pattern (see the screenshot). The pattern is plotted by the extreme values of the ZigZag indicator (included in the resources, no need to install). After detecting the pattern, the indicator notifies of that by a pop-up window, a mobile notification and an email. The indicator highlights the process of the pattern formation and not just the complete pattern. In the former case, it is displayed in the contour triangles. After the pattern is comple
Trend MACD mr
DMITRII GRIDASOV
MT4용 TREND MACD 지표 - 훌륭하고 효율적인 거래 도구입니다! 이 지표는 큰 가격 변동을 포착하는 데 집중하는 트렌드 트레이더에게 좋습니다. TREND MACD는 3개의 선으로 구성되어 있습니다. 녹색 선 - 주요 추세 방향을 표시하고, 파란색 및 자홍색 선은 진입 및 종료를 나타냅니다. 지표를 사용하면 수익을 극대화할 수 있습니다. 수익성 있는 거래에서 너무 일찍 종료하지 마십시오. 지표에는 모바일 및 PC 알림이 내장되어 있습니다. 지표 사용 방법(그림 참조): 1) 파란색 및 자홍색 선이 모두 녹색 선 위에 있는지 확인합니다. 2) 그런 다음 파란색 선이 자홍색 선 위에 있으면 매수합니다. 3) 파란색 선이 자홍색 선 아래에 있으면 거래를 종료합니다. 4) 단기 거래의 경우 그 반대입니다. // 더 많은 훌륭한 전문가 자문가 및 지표는 여기에서 확인할 수 있습니다. https://www.mql5.com/en/users/def1380/seller 이 MQL5
MT4용 외환 지표 "RSI와 2개 이동 평균" 이 지표는 모멘텀 거래 시스템에 매우 적합합니다. "RSI와 2개 MA" 지표를 사용하면 RSI 자체의 빠르고 느린 이동 평균을 볼 수 있습니다. 지표는 매우 일찍 추세 변화를 볼 수 있는 기회를 제공합니다. "RSI와 2개 MA"를 사용하면 추세 방향으로 모멘텀을 포착할 수 있습니다. 매개변수를 통해 이 지표를 설정하는 것은 매우 쉽습니다(그림 참조) 지표는 모든 시간 프레임에서 사용할 수 있습니다. ............................................................................................................................................... // 더 훌륭한 전문가 자문가와 지표는 여기에서 확인할 수 있습니다: https://www.mql5.com/en/users/def1380/seller 이 MQL5 웹사이트에서만
ZhiBiCCI MT4
Qiuyang Zheng
5 (1)
[ZhiBiCCI] indicators are suitable for all cycle use, and are also suitable for all market varieties. [ZhiBiCCI] Green solid line is a reversal of bullish divergence. The green dotted line is a classic bullish divergence. [ZhiBiCCI] The solid line to the red is a reverse bearish divergence. The red dotted line is a classical bearish divergence. [ZhiBiCCI] can be set in the parameters (Alert, Send mail, Send notification), set to (true) to send instant signals to the alarm window, email, in
Owl smart levels
Sergey Ermolov
4.58 (55)
MT5 버전  |   FAQ Owl Smart Levels Indicator 는   Bill Williams 의 고급 프랙탈, 시장의 올바른 파동 구조를 구축하는 Valable ZigZag, 정확한 진입 수준을 표시하는 피보나치 수준과 같은 인기 있는 시장 분석 도구를 포함하는 하나의 지표 내에서 완전한 거래 시스템입니다. 시장과 이익을 취하는 장소로. 전략에 대한 자세한 설명 표시기 작업에 대한 지침 고문-거래 올빼미 도우미의 조수 개인 사용자 채팅 ->구입 후 나에게 쓰기,나는 개인 채팅에 당신을 추가하고 거기에 모든 보너스를 다운로드 할 수 있습니다 힘은 단순함에 있습니다! Owl Smart Levels   거래 시스템은 사용하기 매우 쉽기 때문에 전문가와 이제 막 시장을 연구하고 스스로 거래 전략을 선택하기 시작한 사람들 모두에게 적합합니다. 전략 및 지표에는 눈에 보이지 않는 비밀 공식 및 계산 방법이 없으며 모든 전략 지표는 공개되어 있습니다. Owl Smart Lev
Power Renko MT4
Pierce Vallieres
Power Renko is an indicator which plots Renko bricks underneath the chart using a histogram. You can select the brick size and the timeframe of the Renko bricks as well as whether or not to use the close price or the high/low price of the candles. Renko bricks are based on price alone, not time, therefor the Renko bricks will not be aligned with the chart's time. They are extremely useful for trend trading and many different strategies can be formed from them. Buffers are provided allowing you t
RSI Currency Strength Meter uses RSI (Relative Strength Index) to monitor how strong a currency is, or in other words, if it's being bought or sold by the majority compared to the other currencies. It displays the strength-lines of the currencies of the pair (base and counter currency of the chart) with changeable solid lines. Also, you can add up to five additional currencies to the "comparison pool". If you want to look and compare, for example, EUR, USD and JPY, it will only look at the EURUS
Lyne
Maksim Kalachev
About the Lyne indicator Lyne is a Metatrader 4 (MT4) indicator, the essence of which is to transform the accumulated historical data. The Lyne indicator makes it possible to detect various features and patterns in price dynamics that are invisible to the naked eye. Based on this information, traders can anticipate further price movement and adjust their strategy accordingly. This indicator has proven itself in the scalping strategy. The indicator works without repainting.
PABT Pattern Indicator - it's classical system one of the signal patterns. Indicator logic - the Hi & Lo of the bar is fully within the range of the preceding bar, look to trade them as pullback in trend. In the way if indicator found PABT pattern it's drawing two lines and arrow what showing trend way.  - First line - it's entry point and drawing at: 1. On the high of signal bar or on middle of the signal bar (depending from indicator mode) for buy; 2. On the low of signal bar or on middle of t
Colored trend indicator advanced is a trend indicator that is based on Fast Moving Average and Slow Moving Average and also uses RSI and Momentum to give a trend strength in percent. It is aimed to find more healthy trends with this indicator. This indicator can be used alone as a trend indicator. Colors (Default) Green = Uptrend (Default) Red = Downtrend No color = No trend, no good trend Indicator Parameters WarnPosTrendchange: Warns you when the trend may change. FullColor: See screenshot
Wave Wolf MT4
Andrei Salanevich
거래 단말기의 현재 창에 늑대 파도를 검색하여 표시하도록 설계되었습니다. 거래에 늑대 파도를 사용하는 상인을위한 훌륭한 지표. 거래 전략에서의 적용은 효율성과 수익성을 크게 증가시킬 것입니다. 표시기에 대한 정보 다른 늑대 웨이브 지표와는 달리,웨이브 고원지 외환 지표는 크게 그 효과를 증가 기능을 가지고 있습니다: 첫 번째는 열린 창 5 점 매개 변수(진정한 값)정보 지원을 제공합니다,즉 늑대 파도가 나타난 차트의 창을 확장합니다. 예를 들어,유로화 차트가 열려 있고 각각에 웨이브 월드 표시기가 설치되어있는 경우 유로화 모델이 감지되면 해당 차트가 자동으로 다른 차트의 맨 위에 포 그라운드로 가져 오므로 많은 상품을 거래 할 때 매우 편리합니다.  두 번째 기능은 맥 디에 내장 된 발산 분석,사용자가 자신을 선택할 수있는 매개 변수(기본 설정(12,26,9))입니다. 그런데 일반적인 오실레이터의 값은 작업 창에 표시되지 않으며 점을 형성 할 때 가격 라벨의 색상에만 반영됩
CCI Currency Strength Meter uses CCI (Commodity Channel Index) to monitor how strong a currency is, or in other words, if it's being bought or sold by the majority compared to the other currencies. If you load this indicator on a chart, it will first display the strength-lines of the currencies (base and counter currency of the chart) with changeable solid lines. Also, you can add up to five additional currencies to the "comparison pool," that already has the base and the profit (counter) curren
Nice Trade Point
Muhammed Emin Ugur
This    Nice Trade Point     indicator is designed for signal trading. This indicator generates trend signals. It uses many algorithms and indicators to generate this signal. It tries to generate a signal from the points with the highest trend potential. This indicator is a complete trading product. This indicator does not need any additional indicators. The indicator certainly does not repaint. The point at which the signal is given does not change.     Features and Suggestions Time
TrendInChannel
Andriy Sydoruk
This indicator is the undisputed leader among the indicators. And for this statement there is a good reason. The indicator builds a very high quality channel in which it generates signals to enter! What is the ideal strategy for the trader, since the trader always hesitates when choosing a strategy for the job. That is, this indicator will allow you to solve the dilemma of choosing a job by trend or to the channel, since it combines these two basic concepts. Working with the indicator is very
The indicator displays the data of the Stochastic oscillator from a higher timeframe on the chart. The main and signal lines are displayed in a separate window. The stepped response is not smoothed. The indicator is useful for practicing "manual" forex trading strategies, which use the data from several screens with different timeframes of a single symbol. The indicator uses the settings that are identical to the standard ones, and a drop-down list for selecting the timeframe. Indicator Parame
Absolute price
Aleksey Ivanov
This   indicator is intended for professionals assessing fundamental market trends.  This indicator calculates the index of any instrument and analyzes it.              The index of the state currency shows the real purchasing power of this currency, and the dynamics of this index shows the dynamics of the economic state of the corresponding state. An analysis of the indices of both currencies included in a currency pair makes it much more reliable to identify the trend of this cur
RaysFX MACD Divergence Presentiamo RaysFX MACD Divergence, un indicatore di trading avanzato progettato per i trader moderni. Questo indicatore utilizza la divergenza MACD, uno dei metodi più affidabili nel mondo del trading, per fornirti segnali di trading precisi e tempestivi. Caratteristiche principali: Divergenza MACD: L’indicatore identifica e traccia le divergenze MACD, fornendo segnali di trading potenzialmente redditizi. Personalizzabile: Puoi personalizzare i parametri dell’EMA veloce
DivirgentMAX
Mikhail Bilan
Indicator without redrawing Divergent MAX The DivirgentMAX indicator is a modification based on the MACD. The tool detects divergence based on OsMA and sends signals to buy or sell (buy|sell), taking into account the type of discrepancies detected. Important!!!! In the DivirgentMAX indicator, the optimal entry points are drawn using arrows in the indicator's basement. Divergence is also displayed graphically. In this modification of the MACD, the lag problem characteristic of its predecessor
Algorithm Trend
Abderrazzak Larhouali
Welcome, thank you for choosing us Read carefully before starting If you want to trade on a demo account, put the indicator there. If you want to trade on a real account, put the indicator there and wait about two hours for the data to be collected again. The data differs between the demo and real accounts in several factors. We offer you the latest indicators that will help you make decisions after creating your own technical analysis You will see the entry point that you will use to get
Ichimoku Trade Alarm
Miroslaw Stachowiak
The most effective signals generated by Ichimoku strategies. Ichimoku Trade Alarm is a supplement for Ichimoku Trade Panel and it shows the signals that Expert Advisor reacts to. Visualization of signals:  Price / Kijun sen cross - the candle body must be between Min_Candlestick_Body and Max_Candlestick_Body. The candle must close above / below Kijun sen, minimum in 1/3 of its body. Open candle must be located above / below Kijun sen. Chinkou span must be under the price of 26 periods in advan
Trend Flasher
Amarnath K M
Trend Flasher Trend is your friend is the age old saying quote in trading arena, there are though many ways to gauge the trend and its direction, more scientific measure and logically meaningful will be an ATR break outs to identify and spot the trend and its acceleration, so we created this easy to use trend identification panel and optimized super trend based multi time frame panel entry system to aid and help the traders to make their trading decision. Unique Features of Trend Flasher 1
무한대에서 통화의 강도를 측정하는이 혁신적인 지표는 오랫동안 거래하는 암표 및 거래자에게 없어서는 안될 조수입니다. 통화의 강도/약점을 분석하는 시스템은 오랫동안 알려져 있으며 세계 최고의 거래자들에 의해 시장에서 사용되었습니다. 이 분석 없이는 차익 거래가 완료되지 않습니다. 우리의 지표는 서로 관련하여 기본 통화의 강도를 쉽게 결정합니다. 표시 라인에 차트에 대한 모든 또는 현재 통화 쌍의 수 있도록 즉각적인 분석 및 검색에 대한 강한 진입 점. 표시등,직관적 인 사용하면 신속하게 찾아와 스위치는 모든 쌍,모바일 패널 배치할 수 있는 모두에서 지하실에는 기본 차트. 통화의 강도의 변화의 통지의 타이머 모드는 상인에게 전화로 알림을받을 수있는 기회를 제공합니다.  통화 전력계 무한대 표시기를 사용하기위한 몇 가지 전략: 1. 신흥 추세에 대한 신호로 교차점을 검색 할 통화의 강도의 선형 표시의 차트를 사용하여 2. 추세 반전 신호가 나타난 후 강한 통화 방향으로 두피
Combined MT4
Ahmed Alaaeldin Abdulrahman Ahmed Elherzawi
Welcome to Investment Castle products   This product is exclusively available in the MQL5 market and is not available and will not be available anywehere else. The Combined indicator is a multi-time frame indicator and it is built using 3 indicators: Bands indicator which draws the support and resistance key levels   using up to 5 different time frames Patterns indicator which draws the chart patterns using up to 6 different time frames Spots indicator which shows the common candlestick pattern
All in one divergence
Fatima Hosseini
5 (1)
Download the free version   here. Divergence Divergence refers to when the price of a currency pair moves in one direction while the trend indicator is moving in the opposite direction. With divergence, there can be positive and negative signals. Divergences in Forex trading are quite common signals of technical analysis. These are basic early Forex signals indicating the trend reversal and filter false signals. Application of this indicator It is usually not easy to detect divergences by the t
PZ Divergence Trading
PZ TRADING SLU
5 (3)
Unlock hidden profits: accurate divergence trading for all markets Special Offer: Purchase now to receive free bonuses worth $159! (Read more for details) Tricky to find and scarce in frequency, divergences are one of the most reliable trading scenarios. This indicator finds and scans for regular and hidden divergences automatically using your favourite oscillator. [ Installation Guide | Update Guide | Troubleshooting | FAQ | All Products ] Easy to trade Finds regular and hidden divergence
SuperTrend Classic
Eduardo Mellado Monge
The classic SuperTrend indicator. The best indicator to define trends and small-scale trend changes in any pair and time frame. It is set up in exactly the same way as the TradinView indicator, and can be adjusted and complemented with other indicators to create profitable strategies or expert advisors, or used individually to profit from the market. Based on the average volatility of the last candles and the price movement, it draws a green line below the price if an bullish microtrend is ident
이 제품의 구매자들이 또한 구매함
Gann Made Easy
Oleg Rodin
4.88 (97)
Gann Made Easy 는 mr.의 이론을 사용하여 최고의 거래 원칙을 기반으로 하는 전문적이고 사용하기 쉬운 Forex 거래 시스템입니다. W.D. 간. 이 표시기는 Stop Loss 및 Take Profit Levels를 포함하여 정확한 BUY 및 SELL 신호를 제공합니다. PUSH 알림을 사용하여 이동 중에도 거래할 수 있습니다. 구매 후 연락주세요! 내 거래 팁과 훌륭한 보너스 지표를 무료로 공유하겠습니다! 아마도 Gann 거래 방법에 대해 이미 여러 번 들었을 것입니다. 일반적으로 Gann의 이론은 초보자 거래자뿐만 아니라 이미 거래 경험이 있는 사람들에게도 매우 복잡한 것입니다. Gann의 거래 방식은 이론적으로 적용하기 쉽지 않기 때문입니다. 나는 그 지식을 연마하고 Forex 지표에 최고의 원칙을 적용하기 위해 몇 년을 보냈습니다. 표시기는 적용하기가 매우 쉽습니다. 차트에 첨부하고 간단한 거래 권장 사항을 따르기만 하면 됩니다. 지표는 지속적으로 시장 분석 작업
Atomic Analyst
Issam Kassas
5 (3)
우선적으로 언급할 점은이 거래 지표가 다시 그리지 않고 지연되지 않으며 이를 통해 수동 및 로봇 거래 모두에 이상적이라는 점입니다. 사용자 매뉴얼: 설정, 입력 및 전략. Atomic Analyst는 가격의 강도와 모멘텀을 활용하여 시장에서 더 나은 이점을 찾는 PA Price Action Indicator입니다. 고급 필터를 장착하여 잡음과 거짓 신호를 제거하고 거래 잠재력을 높이는 데 도움이 됩니다. 복잡한 지표의 다중 레이어를 사용하여 Atomic Analyst는 차트를 스캔하고 복잡한 수학적 계산을 간단한 신호와 색상으로 변환하여 초보 트레이더가 이해하고 일관된 거래 결정을 내릴 수 있도록합니다. "Atomic Analyst"는 새로운 및 경험이 풍부한 트레이더를위한 종합적인 거래 솔루션입니다. 프리미엄 지표와 최고 수준의 기능을 하나의 거래 전략에 결합하여 모든 종류의 트레이더에 대한 다재다능한 선택지가되었습니다. 인트라데이 거래 및 스캘핑 전략 : 빠르고 정확한
Trend Pulse
Mohamed Hassan
5 (4)
Please contact me after purchase to immediately get your PDF strategy + documentation for Trend Pulse !  Official release price of $89  ( 3 /50 copies left). Next price is $199 . Introducing Trend Pulse , a unique and robust indicator capable of detecting bullish, bearish, and even ranging trends! Trend Pulse uses a special algorithm to filter out market noise with real precision. If the current symbol is moving sideways, Trend Pulse will send you a ranging signal, letting you know that it
Scalper Inside PRO
Alexey Minkov
4.75 (60)
An exclusive indicator that utilizes an innovative algorithm to swiftly and accurately determine the market trend. The indicator automatically calculates opening, closing, and profit levels, providing detailed trading statistics. With these features, you can choose the most appropriate trading instrument for the current market conditions. Additionally, you can easily integrate your own arrow indicators into Scalper Inside Pro to quickly evaluate their statistics and profitability. Scalper Inside
Trend Punch
Mohamed Hassan
4.91 (22)
This indicator is unstoppable when combined with our other indicator called  Support & Resistance . After purchase, send us a message and you will get it   for  FREE as a BONUS! Introducing Trend Punch , the revolutionary forex trend indicator that will transform the way you trade! Trend Punch is uniquely designed to provide precise buy and sell arrows during strong market trends, making your trading decisions clearer and more confident. Whether you're trading major currency pairs or exotic sym
Gold Stuff
Vasiliy Strukov
4.9 (269)
Gold Stuff는 금을 위해 특별히 설계된 추세 지표이며 모든 금융 상품에서도 사용할 수 있습니다. 표시기가 다시 그려지지 않고 지연되지 않습니다. 권장 기간 H1. 표시기에서 완전 자동 Expert Advisor EA Gold Stuff를 작동합니다. 내 프로필에서 찾을 수 있습니다. 설정 및 개인 보너스를 받으려면 구매 후 즉시 저에게 연락하십시오!   강력한 지원 및 트렌드 스캐너 표시기의 무료 사본을 받으실 수 있습니다. 메시지를 보내주세요. 나!   설정 화살표 그리기 - 켜기 끄기. 차트에 화살표 그리기. 경고 - 가청 경고를 끕니다. 이메일 알림 - 켜기 끄기. 이메일 알림. Puch-notification - 켜기 끄기. 푸시 알림. 다음으로 색 영역을 조정합니다. Gold Stuff는 금을 위해 특별히 설계된 추세 지표이며 모든 금융 상품에서도 사용할 수 있습니다. 표시기가 다시 그려지지 않고 지연되지 않습니다. 권장 기간 H1. 표시기에서 완
Advanced Currency Strength28 Indicator
Bernhard Schweigert
4.91 (667)
현재 26% 할인 초보자 또는 전문가 트레이더를 위한 최고의 솔루션! 이 지표는 우리가 독점 기능과 새로운 공식을 통합했기 때문에 독특하고 고품질이며 저렴한 거래 도구입니다. 단 하나의 차트로 28 Forex 쌍의 통화 강도를 읽을 수 있습니다! 새로운 추세 또는 스캘핑 기회의 정확한 트리거 포인트를 정확히 찾아낼 수 있기 때문에 거래가 어떻게 개선될지 상상해 보십시오. 사용 설명서: 여기를 클릭  https://www.mql5.com/en/blogs/post/697384 그것이 첫 번째, 원본입니다! 쓸모없는 지망생 클론을 사지 마십시오. 더 스페셜  강력한 통화 모멘텀을 보여주는 하위 창의 화살표 GAP가 거래를 안내합니다! 기본 또는 호가 통화가 과매도/과매도 영역(외부 시장 피보나치 수준)에 있을 때 개별 차트의 기본 창에 경고 표시가 나타납니다. 통화 강도가 외부 범위에서 떨어질 때 풀백/반전 경고. 교차 패턴의 특별 경고 추세를 빠르게 볼 수 있는
Currency Strength Wizard
Oleg Rodin
4.92 (51)
통화 강도 마법사는 성공적인 거래를 위한 올인원 솔루션을 제공하는 매우 강력한 지표입니다. 표시기는 여러 시간 프레임의 모든 통화 데이터를 사용하여 이 또는 해당 외환 쌍의 힘을 계산합니다. 이 데이터는 특정 통화의 힘을 확인하는 데 사용할 수 있는 사용하기 쉬운 통화 지수 및 통화 전력선의 형태로 표시됩니다. 필요한 것은 거래하려는 차트에 표시기를 부착하는 것뿐입니다. 표시기는 거래하는 통화의 실제 강세를 보여줍니다. 지표는 또한 추세와 거래할 때 유리하게 사용할 수 있는 구매 및 판매 거래량 압력의 극한값을 보여줍니다. 지표는 또한 피보나치에 기반한 가능한 대상을 보여줍니다. 표시기는 PUSH 알림을 포함한 모든 유형의 알림을 제공합니다. 구매 후 연락주세요. 나는 당신과 거래 팁을 공유하고 당신에게 무료로 훌륭한 보너스 지표를 줄 것입니다! 나는 당신에게 행복하고 유익한 거래를 기원합니다!
FX Power MT4 NG
Daniel Stein
5 (12)
모닝 브리핑 여기 mql5 와 텔레그램에서 FX Power MT4 NG 는 오랫동안 인기 있는 통화 강도 측정기인 FX Power의 차세대 버전입니다. 이 차세대 강도 측정기는 무엇을 제공합니까? 기존 FX Power에서 좋아했던 모든 것 PLUS GOLD/XAU 강도 분석 더욱 정밀한 계산 결과 개별 구성 가능한 분석 기간 더 나은 성능을 위한 사용자 정의 가능한 계산 한도 특별 멀티더 많은 것을보고 싶은 사람들을위한 특별한 다중 인스턴스 설정 모든 차트에서 좋아하는 색상을위한 끝없는 그래픽 설정 수많은 알림 옵션, 중요한 것을 다시는 놓치지 않도록 Windows 11 및 macOS 스타일의 둥근 모서리가 있는 새로운 디자인 마법처럼 움직이는 인디케이터 패널 FX 파워 키 특징 모든 주요 통화의 완전한 강세 이력 모든 시간대에 걸친 통화 강세 이력 모든 브로커 및 차트에서 고유 계산 결과 100% 신뢰할 수있는 실시간100 % 신뢰할 수있는 실시간 계산-> 다시 칠하지 않음
Advanced Currency IMPULSE with ALERT
Bernhard Schweigert
4.91 (495)
현재 31% 할인!! 초보자 또는 전문가 트레이더를 위한 최고의 솔루션! 이 지표는 우리가 독점 기능과 비밀 공식을 통합했기 때문에 독특하고 고품질이며 저렴한 거래 도구입니다. 단 하나의 차트로 28개 통화 쌍 모두에 대한 경고를 제공합니다. 새로운 추세 또는 스캘핑 기회의 정확한 트리거 포인트를 정확히 찾아낼 수 있기 때문에 거래가 어떻게 개선될지 상상해 보십시오! 새로운 기본 알고리즘을 기반으로 구축되어 잠재적인 거래를 훨씬 더 쉽게 식별하고 확인할 수 있습니다. 이는 통화의 강세 또는 약세가 가속되는지 여부를 그래픽으로 표시하고 가속 속도를 측정하기 때문입니다. 자동차의 속도계처럼 생각하면 됩니다. 가속화할 때 Forex 시장에서 동일한 일이 분명히 더 빠르게 발생합니다. 즉, 반대 방향으로 가속화되는 통화를 페어링하면 잠재적으로 수익성 있는 거래를 식별한 것입니다. 통화 모멘텀의 수직선과 화살표가 거래를 안내합니다! 역동적인 Market Fibonacci 23
Order Block Hunter
Noha Mohamed Fathy Younes Badr
5 (1)
Order block hunter indicator is the best indicator for  hunt the order blocks that area where there has been a large concentration of limit orders waiting to be executed Order blocks are identified on a chart by observing previous price action and looking for areas where the price experienced significant movement or sudden changes in direction .This indicator does that for you by using very complicated codes and helps you to take the best areas To buy and sell because it make marks at the best a
현재 20% 할인 ! 초보자 또는 전문가 트레이더를 위한 최고의 솔루션! 이 대시보드 소프트웨어는 28개의 통화 쌍에서 작동합니다. 2가지 주요 지표(Advanced Currency Strength 28 및 Advanced Currency Impulse)를 기반으로 합니다. 전체 Forex 시장에 대한 훌륭한 개요를 제공합니다. 고급 통화 강도 값, 통화 이동 속도 및 모든(9) 시간대의 28 Forex 쌍에 대한 신호를 보여줍니다. 추세 및/또는 스캘핑 기회를 정확히 파악하기 위해 차트의 단일 지표를 사용하여 전체 시장을 볼 수 있을 때 거래가 어떻게 개선될지 상상해 보십시오! 잠재적인 거래를 식별하고 확인하면서 강력한 통화와 약한 통화를 더욱 쉽게 식별할 수 있도록 이 지표에 기능을 내장했습니다. 이 표시기는 통화의 강세 또는 약세가 증가 또는 감소하는지 여부와 모든 시간대에서 수행되는 방식을 그래픽으로 보여줍니다. 추가된 새로운 기능은 현재 시장 조건 변화에 적
우선적으로, 이 거래 도구는 전문적인 거래에 이상적인 비-다시 그리기 및 지연되지 않는 지표입니다.  온라인 강좌, 사용자 매뉴얼 및 데모. 스마트 가격 액션 컨셉트 인디케이터는 신규 및 경험 많은 트레이더 모두에게 매우 강력한 도구입니다. Inner Circle Trader Analysis 및 Smart Money Concepts Trading Strategies와 같은 고급 거래 아이디어를 결합하여 20가지 이상의 유용한 지표를 하나로 결합합니다. 이 인디케이터는 스마트 머니 컨셉트에 중점을 두어 대형 기관의 거래 방식을 제공하고 이동을 예측하는 데 도움을 줍니다.  특히 유동성 분석에 뛰어나 기관이 어떻게 거래하는지 이해하는 데 도움을 줍니다. 시장 트렌드를 예측하고 가격 변동을 신중하게 분석하는 데 탁월합니다. 귀하의 거래를 기관 전략에 맞추어 시장의 동향에 대해 더 정확한 예측을 할 수 있습니다. 이 인디케이터는 시장 구조를 분석하고 중요한 주문 블록을 식별하고 다양한
Enigmera
Ivan Stefanov
5 (4)
에니메라: 시장의 핵심 https://www.enigmera.com 소개 이 지표 및 트레이딩 시스템은 금융 시장에 대한 놀라운 접근 방식입니다. 에니메라는 프랙탈 주기를 사용하여 지지선과 저항선을 정확하게 계산합니다. 진정한 축적 단계를 보여주고 방향과 목표를 제시합니다.  추세에 있든 조정에 있든 작동하는 시스템입니다.  어떻게 작동하나요? 에니메라는 지지선/저항선, 목표선, 편차선의 세 가지 라인으로 구성됩니다. 이 시스템은 과거 데이터를 현재와 미래로 추정하는 일반적인 시장 지표와 달리 현재에 대한 완전한 그림을 제공합니다. 지지선 위에 있으면 실제 지지를 의미하고 저항선 위에 있으면 실제 저항을 의미합니다. 레벨이 깨지면 추세의 변화를 나타냅니다. 다시 그리지 않습니다. 시장이 지속적으로 진화함에 따라 에니메라는 평가 도구를 조정하여 전략을 정기적으로 수정합니다.   이를 통해 모든 시나리오를 철저히 평가할 수 있습니다. 이 시장 지표의 고유성은 분명하며 그 기
Scalper Vault
Oleg Rodin
5 (29)
Scalper Vault 는 성공적인 스캘핑에 필요한 모든 것을 제공하는 전문 스캘핑 시스템입니다. 이 표시기는 외환 및 바이너리 옵션 거래자가 사용할 수 있는 완전한 거래 시스템입니다. 권장 시간 프레임은 M5입니다. 시스템은 추세 방향으로 정확한 화살표 신호를 제공합니다. 또한 상단 및 하단 신호와 Gann 시장 수준을 제공합니다.  이 시스템은 사용하기가 매우 쉽습니다. 원하는 시장 지역의 화살표만 따라가면 됩니다. 엑시트는 가격이 적정 수준에 도달하거나 시장의 고점 또는 저점 신호가 나타날 때 수행됩니다.  표시기는 PUSH 알림을 포함한 모든 유형의 경고를 제공합니다. 인디케이터 구매 후 연락주세요. 내 개인 거래 권장 사항과 훌륭한 보너스 지표를 무료로 공유합니다! 나는 당신에게 행복하고 유익한 거래를 기원합니다!
Trend Screener
STE S.S.COMPANY
4.82 (93)
트렌드 표시기, 트렌드 트레이딩 및 필터링을 위한 획기적인 고유 솔루션, 하나의 도구 안에 내장된 모든 중요한 트렌드 기능! Forex, 상품, 암호 화폐, 지수 및 주식과 같은 모든 기호/도구에 사용할 수 있는 100% 다시 칠하지 않는 다중 시간 프레임 및 다중 통화 표시기입니다. Trend Screener는 차트에 점이 있는 화살표 추세 신호를 제공하는 효율적인 지표 추세 추종 지표입니다. 추세 분석기 표시기에서 사용할 수 있는 기능: 1. 트렌드 스캐너. 2. 최대 이익 분석이 있는 추세선. 3. 추세 통화 강도 측정기. 4. 경고가 있는 추세 반전 점. 5. 경고가 있는 강력한 추세 점. 6. 추세 화살표 Trend Screener Indicator가 있는 일일 분석 예, 일일 신호 성능...등은 여기에서 찾을 수 있습니다.   여기를 클릭하십시오. LIMITED TIME OFFER : Trend Screener Indicator는 50 $ 및 평생 동안만 사용할 수 있
PZ Day Trading
PZ TRADING SLU
3.67 (3)
Effortless trading: non-repainting indicator for accurate price reversals Special Offer: Purchase now to receive free bonuses worth $189! (Read more for details) This indicator detects price reversals in a zig-zag fashion, using only price action analysis and a donchian channel. It has been specifically designed for short-term trading, without repainting or backpainting at all. It is a fantastic tool for shrewd traders aiming to increase the timing of their operations. [ Installation Guide | Up
Gold Channel XAUUSD
Paulo Rocha
5 (2)
Gold Channel is a volatility-based indicator, developed with a specific timing algorithm for the XAUUSD pair, which consists of finding possible corrections in the market. This indicator shows two outer lines, an inner line (retracement line) and an arrow sign, where the theory of the channel is to help identify overbought and oversold conditions in the market. The market price will generally fall between the boundaries of the channel. If prices touch or move outside the channel it is a tra
Apollo Pips PLUS SP
Oleg Rodin
5 (3)
제품을 구매하기 전에 아래 정보를 읽어보세요! Apollo Pips PLUS SP는 독특한 제품입니다! 모든 거래 지표에 액세스할 수 있는 새로운 "APOLLO PIPS" 지표와 "슈퍼 팩" 보너스를 받고 싶은 분들을 위한 것입니다! Apollo Pips PLUS SP 제품을 구매하면 실제로 Apollo Pips 표시기의 완전히 새로운 버전을 구매하게 됩니다. 이 버전의 지표에는 개선된 알고리즘과 사용하기 쉬운 매개변수가 있어 모든 시장 및 거래 스타일에서 지표를 사용할 수 있는 기회를 제공합니다. 이 제품의 구매자는 슈퍼 보너스로 다른 모든 표시기에 무료로 액세스할 수 있습니다! 내 모든 거래 도구에 액세스하고 싶었다면 이 제품이 당신에게 딱 맞습니다! :) 하지만 이것이 전부는 아닙니다! :) 이 제품의 모든 구매자는 또한 내 새로운 지표를 무료로 받을 자격이 있습니다! :) 새로운 거래 지표를 사용할 수 있게 되었는데, 귀하는 저의 특별한 "SUPER PACK" 평생 보너스
RelicusRoad Pro
Relicus LLC
4.73 (141)
이제 $ 147 (몇 가지 업데이트 후 $ 499 증가) - 무제한 계정 (PCS 또는 MACS) RelicusRoad 사용 설명서 + 교육 비디오 + 비공개 Discord 그룹 액세스 + VIP 상태 시장을 보는 새로운 방법 RelicusRoad는 외환, 선물, 암호화폐, 주식 및 지수에 대한 세계에서 가장 강력한 거래 지표로서 거래자에게 수익성을 유지하는 데 필요한 모든 정보와 도구를 제공합니다. 우리는 초보자부터 고급까지 모든 거래자가 성공할 수 있도록 기술적 분석 및 거래 계획을 제공합니다. 미래 시장을 예측할 수 있는 충분한 정보를 제공하는 핵심 거래 지표입니다. 우리는 차트에서 말이 안 되는 여러 지표 대신 완전한 솔루션을 믿습니다. 타의 추종을 불허하는 매우 정확한 신호, 화살표 + 가격 조치 정보를 표시하는 올인원 표시기입니다. 강력한 AI를 기반으로 하는 RelicusRoad는 누락된 정보와 도구를 제공하여 교육하고 성공적인 트레이더인 트레이딩 전문
Advanced Supply Demand
Bernhard Schweigert
4.9 (314)
현재 33% 할인! 초보자나 전문 트레이더를 위한 최고의 솔루션! 이 보조지표는 우리가 다수의 독창적 기능과 새로운 공식을 통합한 독특하고 고품질이며 저렴한 거래 도구입니다. 이 업데이트를 통해 이중 시간대를 표시할 수 있습니다. 더 높은 TF를 표시할 수 있을 뿐만 아니라 차트 TF와 더 높은 TF 모두를 표시할 수 있습니다: 중첩 영역 표시. 모든 Supply Demand 트레이더들이 좋아할 것입니다. :) 중요한 정보 공개 Advanced Supply Demand의 잠재력을 극대화하려면 다음을 방문하십시오. https://www.mql5.com/ko/blogs/post/720245   진입 또는 목표의 명확한 트리거 포인트를 정확히 찾아냄으로 해서 거래가 어떻게 개선될지 상상해 보십시오. 새로운 알고리즘을 기반으로 매수자와 매도자 간의 잠재적인 불균형을 훨씬 더 쉽게 분간할 수 있습니다. 왜냐하면 가장 강한 공급영역과 가장 강한 수요 영역과 과거에 어떻게 진행 되었는지를(이
IX Power MT4
Daniel Stein
5 (6)
IX Power는 마침내 FX Power의 탁월한 정밀도를 외환이 아닌 기호에도 적용했습니다. 좋아하는 지수, 주식, 원자재, ETF, 심지어 암호화폐까지 단기, 중기, 장기 추세의 강도를 정확하게 파악할 수 있습니다. 단말기가 제공하는 모든 것을 분석할 수 있습니다. 사용해 보고 트레이딩 타이밍이 크게 향상되는 것을 경험해 보세요. IX Power 주요 특징 단말기에서 사용 가능한 모든 거래 심볼에 대해 100% 정확한 비재도장 계산 결과 제공 사전 구성 및 추가적으로 개별 구성 가능한 강도 분석 기간의 드롭다운 선택 가능 이메일, 메시지, 모바일 알림을 통한 다양한 알림 옵션 제공 EA 요청을 위한 액세스 가능한 버퍼 더 나은 성능을 위한 사용자 지정 가능한 계산 한도 더 많은 것을 보고 싶은 사용자를 위한 특별 다중 인스턴스 설정 모든 차트에서 좋아하는 색상을 위한 무한한 그래픽 설정 가능 Windows 11 및 macOS 스타일의 둥근 모서리를 가
맞춤형 MT4 지표로 성공적인 외환 거래에 대한 비밀을 발견하십시오! 외환 시장에서 성공을 달성하고 위험을 최소화하면서 일관되게 이익을 얻는 방법을 궁금해 한 적이 있습니까? 여기에 당신이 찾고 있던 답이 있습니다! 거래에 대한 귀하의 접근 방식을 혁신 할 독점적 MT4 지표를 소개 할 수 있습니다. 독특한 다양성 우리의 지표는 Renko 및 Rangebar Candle Formations를 선호하는 사용자를 위해 특별히 설계되었습니다. 우리는 이러한 차트 유형이 많은 숙련 된 거래자들이 선호한다는 것을 이해하기 때문에 우리의 지표가 그들과 완벽하게 통합되어 비교할 수없는 시장 분석을 제공합니다. 명확한 추세 신호 복잡한 분석을 잊어 버리십시오! 우리의 지표는 생생한 색상과 명확한 점 구조를 사용하여 시장 동향을 명확하게 나타냅니다. 빨간색과 파란색 점은 가격 이동 방향에 대해 의심의 여지가 없어 거래에서 빠른 의사 결정을 할 수 있습니다. HH/HL HL/LL
XQ Indicator MetaTrader 4
Marzena Maria Szmit
3.67 (3)
Step into the realm of Forex trading with confidence and precision using XQ, a cutting-edge Forex indicator designed to elevate your trading game to unprecedented heights. Whether you're a seasoned trader or just stepping into the world of currency exchange,   XQ Forex Indicator   empowers you with the insights and signals needed to make informed trading decisions. The signal conditions are a combination of three indicators, and XQ Forex Indicator only display  medium and long-term trends . The
M1 Arrow
Oleg Rodin
4.73 (15)
시장의 두 가지 기본 원칙에 기반한 일중 전략. 알고리즘은 추가 필터를 사용하여 거래량 및 가격 파동 분석을 기반으로 합니다. 지표의 지능형 알고리즘은 두 가지 시장 요인이 하나로 결합될 때만 신호를 제공합니다. 지표는 더 높은 시간 프레임의 데이터를 사용하여 M1 차트에서 특정 범위의 파도를 계산합니다. 그리고 파동을 확인하기 위해 지표는 볼륨 분석을 사용합니다. 이 표시기는 준비된 거래 시스템입니다. 트레이더가 필요로 하는 모든 것은 신호를 따르는 것입니다. 또한 지표는 자신의 거래 시스템의 기초가 될 수 있습니다. 거래는 분 차트에서만 수행됩니다. 지표가 MTF 원리를 사용한다는 사실에도 불구하고 지표 알고리즘은 가능한 한 안정적입니다. 구매 후 반드시 저에게 편지를 보내주세요! 내 거래 설정 및 권장 사항을 공유하겠습니다!
Automated Trendlines
Georgios Kalomoiropoulos
5 (17)
추세선은 외환 거래에서 기술적 분석의 가장 필수적인 도구입니다. 불행히도, 대부분의 거래자는 올바르게 그리지 않습니다. 자동 추세선 표시기는 시장의 추세 움직임을 시각화하는 데 도움이 되는 진지한 거래자를 위한 전문 도구입니다. 추세선 강세 추세선과 약세 추세선에는 두 가지 유형이 있습니다. 상승 추세에서 Forex 추세선은 가격 움직임의 가장 낮은 스윙 포인트를 통해 그려집니다. 최소 두 개의 "최저 저점"을 연결하면 추세선이 생성됩니다. 하락 추세에서 추세선은 가격 움직임의 가장 높은 스윙 포인트를 통해 그려집니다. 최소 두 개의 "최고 최고점"을 연결하면 추세선이 생성됩니다. 추세선이 깨질 때? 강세 추세선은 약세 양초가 강세 추세선 아래에서 닫히고 양초의 고점이 추세선 위에 있을 때 깨집니다. 약세 추세선은 강세 양초가 약세 추세선 위로 마감되고 양초 저점이 추세선 아래에 있을 때 깨집니다. 추세선이 삭제되면? 강세 추
Break and Retest
Mohamed Hassan
4.12 (17)
This Indicator only places quality trades when the market is really in your favor with a clear break and retest. Patience is key with this price action strategy! If you want more alert signals per day, you increase the number next to the parameter called: Support & Resistance Sensitivity.  After many months of hard work and dedication, we are extremely proud to present you our  Break and Retest price action indicator created from scratch. One of the most complex indicators that we made with ove
AW Trend Predictor
AW Trading Software Limited
4.74 (39)
하나의 시스템에서 추세와 고장 수준의 조합입니다. 고급 지표 알고리즘은 시장 노이즈를 필터링하고 추세, 진입점 및 가능한 출구 수준을 결정합니다. 표시기 신호는 통계 모듈에 기록되어 가장 적합한 도구를 선택하여 신호 기록의 효율성을 보여줍니다. 이 표시기는 이익 실현 및 손절매 표시를 계산합니다. 매뉴얼 및 설명 ->   여기   / MT5 버전 ->   여기 지표로 거래하는 방법: Trend Predictor로 거래하는 것은 3단계로 간단합니다. 1단계 - 포지션 열기 70% 이상의 성공률로 매수 신호를 받았습니다. 2단계 - StopLoss 결정 반대 신호로 트렁크 선택 3단계 - 이익 실현 전략 정의 전략 1: TP1 도달 시 전체 포지션 청산 전략 2: TP1 도달 시 포지션의 50% 청산 및 TP2 도달 시 나머지 50% 청산 전략 3: 추세 반전 시 전체 포지션 청산 이익: 결과를 다시 그리지 않음, 신호는 엄격하게 양초가 닫힐 때 어드바이저에서 사용할 수 있습니다. 이
TPSpro RFI Levels
Roman Podpora
4.83 (24)
Reversal First Impulse levels (RFI)    INSTRUCTIONS        RUS       -       ENG              R ecommended to use with an indicator   -   TPSpro  TREND PRO -  Version MT5 A key element in trading is zones or levels from which decisions to buy or sell a trading instrument are made. Despite attempts by major players to conceal their presence in the market, they inevitably leave traces. Our task was to learn how to identify these traces and interpret them correctly. Main functions: Displaying activ
Best Currency Strength Indicator
Tumelo Patrick Rakotsoane
4.6 (48)
Advanced Currency Strength Indicator The Advanced Divergence Currency Strength Indicator. Not only it breaks down all 28 forex currency pairs and calculates the strength of individual currencies across all timeframes , but, You'll be analyzing the WHOLE forex market in 1 window (In just 1 minute) . This indicator is very powerful because it reveals the true movements of the market.  It is highly recommended to  analyze charts knowing the performance of individual currencies or the countries ec
제작자의 제품 더 보기
RoyalPrince Fibo
Richard Louis Pastor
4.8 (30)
Royal Prince Fibonacci , has the most advance Trend detection algorithm built into its Alert system combined with the RoyalPrince Non-repaint Arrows with it's own alert system you will never miss the opportunity of the trade.  2nd picture is how to use Guide on how i use it to Scalp or take long trades. works on all Charts and all Timeframe on mt4. ︎Best Timeframe M15 for scalping  H1 for Day Trading Options: • Fibonacci days High and Lows  • Fibonacci Targets • Fibonacci Alert System • Tren
RoyalPrince Elliot Wave Signal Indicator
Richard Louis Pastor
4.88 (16)
This is an Elliot Waves Indicator Arrow for  Major Swing's  On default settings i have tested this on all Major 28 pairs  and i have had great results   Check out the comments section for more pictures and details.    AFTER PURCHASE PLEASE WRITE A COMMENT  SO I CAN SEND YOU Your Free GIFT   (Includes NON REPAINT VERSION OF SIGNAL) you have a few options of placement  and a few different options for colors.  this is a very simple and effective signal.
RoyalPercision
Richard Louis Pastor
NO HEDGE , NO GRID, NO MARTINGALE, NO SCALP  Precision Box Trading with lots of functions such as  Risk Management , News Filter, Trailing Stop , Lock Profits , Hard TP/SL , Virtual TP/SL , Start/Stop Trading Times.  when using the news filter make sure you add the web-address to your allowed website list. http://calendar.fxstreet.com/ YOU MUST OPTIMIZE FOR EVERY PAIR YOU WANT TO USE THIS EA PROPERLY.  (100% Modeling Quality ) EVERY TICK BASED ON REAL TICKS NO Setfiles includes (This
FREE
RP FourThousand EA
Richard Louis Pastor
4.22 (41)
NO MARTINGALE   NO GRID   NO SCALP NO HEDGE YES TP & SL YES MM Yes Trading Times                          Low DD% SMALLEST ACCOUNT SIZE : $100 (must Limit trades )  TIMEFRAME :   H1 Reminder,  if your back-test isn't the same like mine, that is because of a few factors.  Tick data not 99%   and Spread is different on your broker.     If you use a different broker you need to optimize the ea for your broker. if you need trailingstop you can use other EA to control this like ronz IF you lik
FREE
RoyalityGold
Richard Louis Pastor
NO GRID, NO MARTINGALE, NO HEDGE, NO SCALP,  Expert Advisor for Gold Introducing the cutting-edge expert advisor designed by RoyalPrince  This innovative tool is packed with features to revolutionize your trading experience: Tailor your trading strategy with customizable settings for Timeframes, Lots, Slippage, and Chart Symbol Selection. Utilize advanced functionalities like setting Take Gain and Stop Loss levels based on ATR calculations. Choose from various Trailing Stop methods such as Clas
Fibonacci Calculation Indicator
Richard Louis Pastor
4 (3)
Basic Fibonacci Calculation Indicator  shows Trend, Stoploss, Profit 1,2,3, will show you your daily Highs and your Daily Lows , it will also show you where it expects the price to move to.  best time frame is H1 or higher .  For  a better system that also includes my Non-repaint Indicator please check out my paid Fibo Indicator  https://www.mql5.com/en/market/product/82323
FREE
This is a simple  MT4 Alert to Telegram Signal. Once a trade is placed it will send the Alert to Telegram.    it will require you to make a bot in botfather.  you will need to allow this website on your terminal " https://api.telegram.org/ "  reminder your group or channel will need to be set to public.  if you want to take a screenshot make sure you fill in the section where it says template and place your mt4 template name in that field no need for the .tpl extension.
FREE
Auto Lock TPSLTS
Richard Louis Pastor
Expert Adviser or Manual USER .  This EA will automatically  help you set a Hidden TP/SL it also has the ability to LockProfit when you have hit a target amount of Pips. It has built-in TrailStop and Alerts if needed. Functions - Take profit - Stop loss -Modes for TP/SL  (  Hidden or Visual) - ProfitLock system  -Target point to enable lock profit -After Target point hit then this amount will be Locked (pips) - Trail stop modes    ( Classic ,  Keep Distance,  Step by Step) - Trailstop value -T
Highly accurate supply and Demand indicator that gives you the exact value of where the Demand or supply ends or starts. Has built-in Alerts  Has ability to change colors to whatever you want.  Has special feature to automatically change when the chart crosses into a new zone or breaks free from a weak zone. Great for any Manual Trader Set your own custom alerts  you can have it check the history of the chart to see how other setups of supply and demand where made in the past.
This is a Manual Indicator to help Manual traders see the Trend Visually it allows you to fully control how the candle closes with many different options, and you can plot the path with many different options. This Indicator is best used in Timeframe: H1 or higher Close Candle Methods Close Open High Low Median Typical Weighted Close Median Body (Open+Close)/2 Average (High+Low+Open+Close)/4 Trend Biased Heiken Ashi Close Heiken Ashi Open Heiken Ashi High    Heiken Ashi Low Heiken Ashi Media
UniSystem EA
Richard Louis Pastor
UniSystem EA is a grid EA  makes trading Simple can be used on any pair  Options: Risk =0.1    --------     Risk Range 0.1 to 2   (starting at 0.1 allows you to start at 0.01 lots  ProfitPips =150; -----------   Profit in Pips TimeFrame =0;   -----------  Timeframe set to 0 means current time frame ,  otherwise you can write  in Minutes the time frame you want to use.  TimeStart =3;  ------------  Starthours of the  EA TimeEnd =23; -------------   Stop Hours of the EA HowBar=1200; -----------  H
This is a Non-Repaint Reversal Indicator that will send you an Alert when the signal Appears alerts are done by Mobile, Push notification, Desktop Notification, Email Notifications The indicator can be used on all Time Frames  A reversal non-repaint indicator arrow is a technical analysis tool used to identify potential trend reversals in financial markets. The arrow represents a signal that traders can use to enter or exit positions based on the direction of the arrow. The term "non-repaint" m
ntroducing the "RoyalPrince Universal Indicator" - Your Gateway to Automated Forex Excellence! Unlock the full potential of your trading indicators with our revolutionary Expert Advisor. With Indicator Setup that lets you seamlessly transition your indicators into powerful automated strategies, you're in control like never before. Tailor your trades with precision using trade settings that allow you to set max trades, trade reversals, and define magic numbers for your strategy. Choose between
The valley and peak indicator strategy used in forex is a technical analysis approach that aims to identify potential trend reversals in the market. The strategy is based on identifying peaks and valleys in the price chart, which are points where the price reaches a high or low and then reverses direction. The valley and peak indicator is a tool that helps traders identify these patterns and generate buy and sell signals based on them. Here are the key steps involved in using the valley and pea
Royal Prince Gold MT5
Richard Louis Pastor
NO MARTINGALE, NO HEDGE, NO GRID, NO SCALP,  YES TP/SL , YES Pending Order This EA takes 200-300 Trades per year Best results are on Low Spread ECN Broker  TF: H1 Pair: XAUUSD Leverage: 1:100 Settings:     (All settings in screenshot) mmLots= 0.1 - Fix lot setting ExitAtEndOfDay = false - enable or disable exit end of day ExitOnFriday = true - enable or disable exit on Friday FridayExitTime = 19:00 - time exit on Friday
The new  Royal Prince Master Non-Repaint Indicator MT5 has two control points ?   What does this mean it allows you to use two different indicators  to cross to see to find your signals, those two indicators also can be customized just like if you were to load them individually on a chart. Want to see the indicator in action  check the youtube video.  ALSO IT HAS ALERTS !!!!! List of Different indicators to choose from : 1) Moving Average 2)    Moving Average Convergence/Divergence 3)  O
RoyalPrince Scalper MT5
Richard Louis Pastor
This is the advanced version of my scalper robot, in this version, you can find advance settings for time filter, and also a news filter.  It also has an equity protection and margin protection for when trading. This robot works best in a low spread pair with a low slippage.  It works best on M5-M15 timeframe.    The default settings have been optimized for USDJPY for February 202 32 April 2024 on M15 timeframe. This version should be optimized for your broker because this Expert Advisor needs
Royal Prince RsiMa
Richard Louis Pastor
No Martingale, No Hedge, No Grid,  Powered by RSI and Moving average.  it has the ability to detect a reverse signal and if you use the option to close trades by opposite signal it will close the last trade and open the reversal signal (don't use with trailstop ).   WHEN BACKTESTING USE OPEN PRICE ONLY SINCE EA only Works with OPENPRICE you have the option to put in Lotsize, amount of money or risk percentage for your money management.   Backtest to find the best settings, it is advised th
GridGod MT5
Richard Louis Pastor
5 (2)
A very simple and logic way of thinking about a Grid System EA,   it is designed to work on all different pairs , metals, crypto.   works best in H1 time frame.  Import to remember on a Grid Style EA  don't set your maximum amount of lots to high and use proper management.  If you want to disable max Lots all you have to do is put "0" .   OPTIMIZE WITH 100% Tick Data from your broker if you do not have 100% Modeling Quality then please download your data from tickstory  make sure to optimi
RoyalPrince Donchian EA
Richard Louis Pastor
5 (3)
RoyalPrince Donchian EA (NO MARTINGALE, NO GRID, NO HEDGE)  Opens orders based on OPEN TICK PRICE.  Has many options inside  Fixed Lots,  Hard Take Profit, Hard Stop Loss,   TP & SL  can be set by  Percentage or set in Points or turned off completely.  Dynamic settings for Donchian Channel Indicator Settings ,  Trailstop with the ability to control if you want it only control buy orders or sell orders or both .  also you can control by comment or magic number so that if you have other trades on
RoyalPrince Bands
Richard Louis Pastor
Bollinger Bands is a popular technical analysis tool used by many traders in the Forex market. It was created by John Bollinger, and it consists of three lines that are plotted on a price chart. The middle line is a simple moving average, typically of 20 periods, and it represents the trend direction. The upper and lower bands are two standard deviations away from the middle line, and they represent the volatility of the asset being traded. What makes Bollinger Bands a powerful tool is its abili
필터:
리뷰 없음
리뷰 답변