Hunting Trend MT5
- 지표
- Claudia Ramona Angerer
- 버전: 1.90
- 업데이트됨: 30 7월 2023
- 활성화: 10
66% discount only for the first 5 buyers (4 left), main price: 300 $
Show the signal as a line graph
Prediction of 10 future candles and advanced display
Prediction of individual candles graphically
Can be used in the gold symbol
Can be used in 15 minutes time frame
Can be used only in gold symbol and only 15 minutes time frame
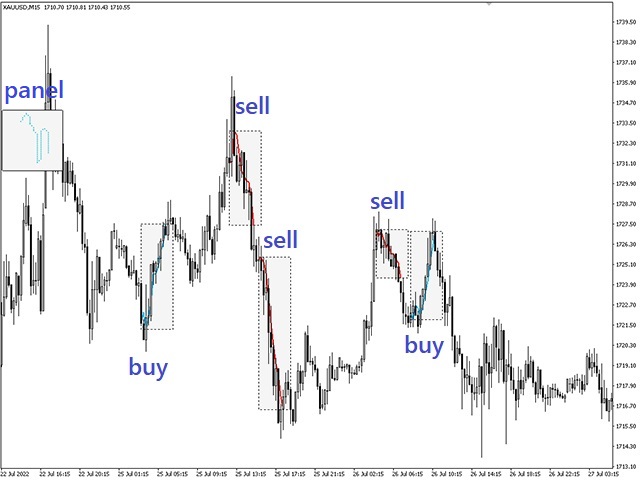
How the indicator works:
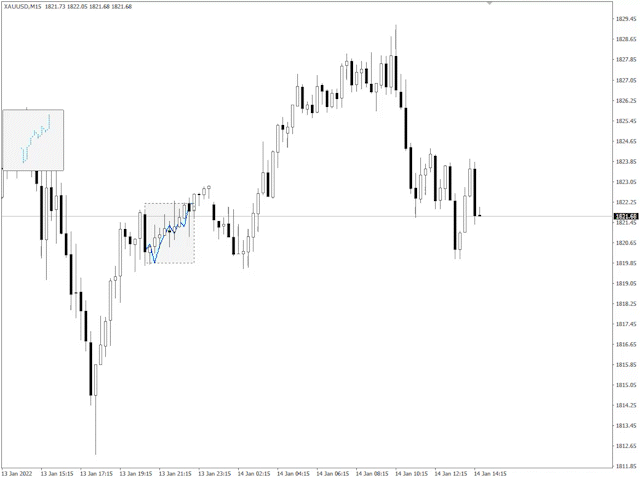
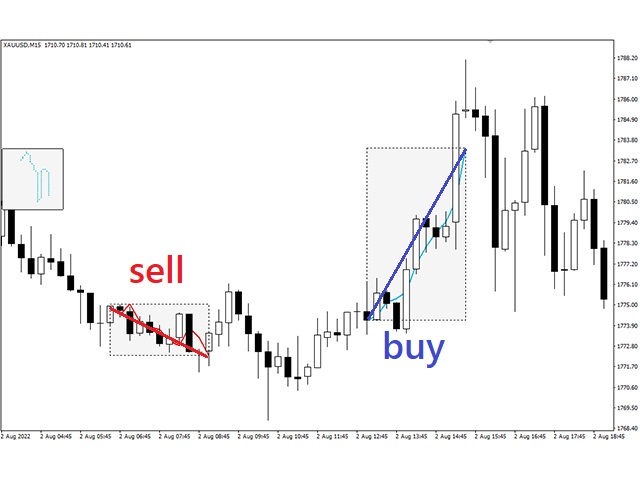
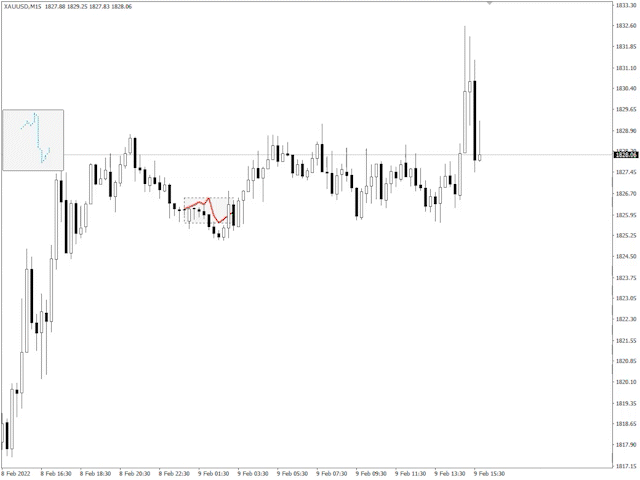
Using complex mathematical calculations, it predicts the future 10 candles.
The predictions of this indicator are based on price. Therefore, it can predict each candle separately
But it is better to see the forecast as a whole and trade with 10 candles.
How to use the indicator:
Run the indicator on the 15-minute time frame and the gold symbol.
The settings of this indicator are very simple.
You can use the indicator using the default settings.
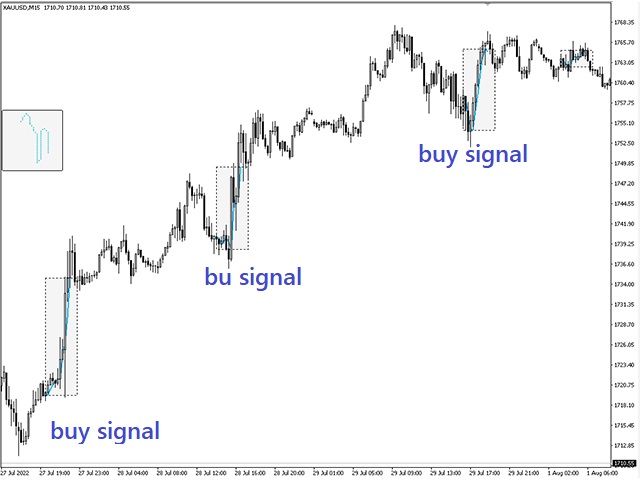
Use it whenever the indicator gives a signal.
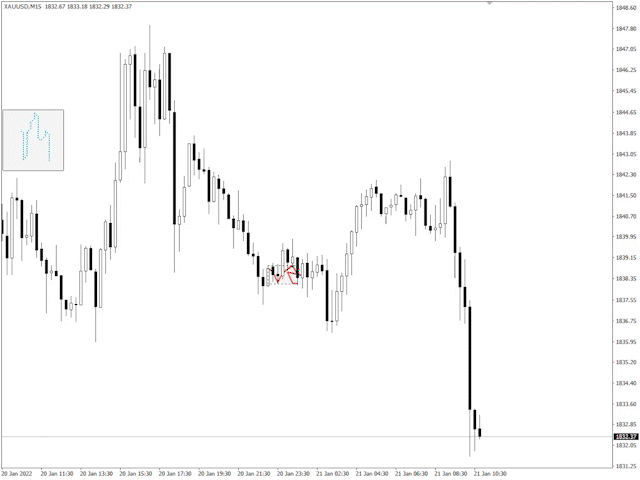
Blue signals (uptrend) are buy signals, and red signals (downtrend) are sell signals.
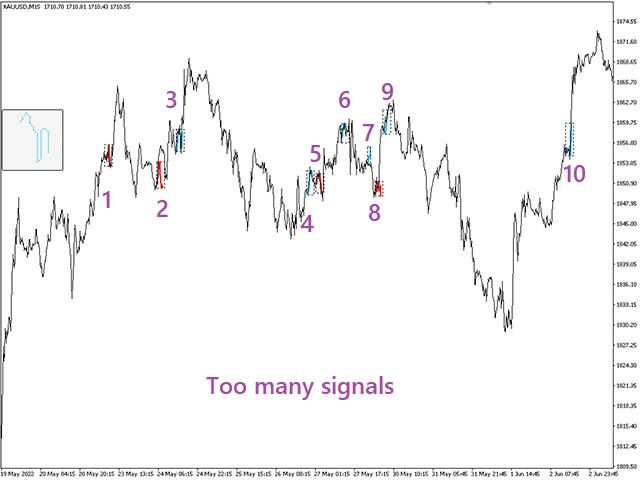
Try to use reliable signals (signals that have high strength).
Signals with a large slope have a high power.
Settings:
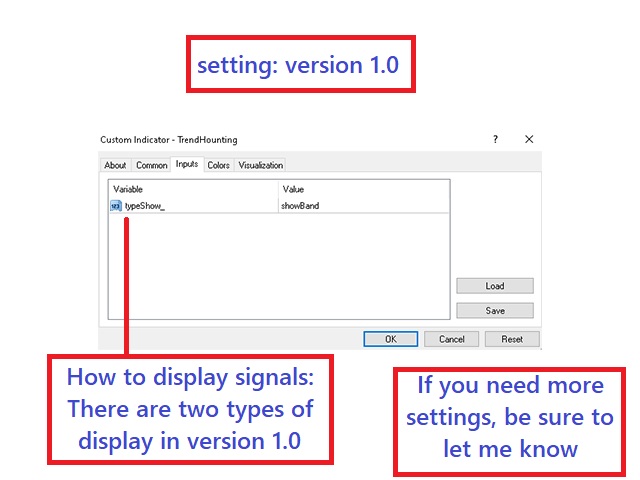
How to display:
Signals have 2 types of display. You can test them.
If you need more settings, be sure to let us know
Features of the indicator:
Can be used in the gold symbol
Can be used in 15 minutes time frame
Fast support
Custom settings can be added (if you need any settings, tell me, I will add them if possible)Frequently Asked Questions (FAQ):
Unfortunately, it is not possible to view past signals in the chart live.
To see old signals, you should use backtest.
You can see all the signals by referring to the backtest section in Metatrader.
MetaTrader must be open to view signals. New signals are displayed when Metatrader is open and the indicator is running.
So to see the new signals, keep the chart open and by using the alarm and notification settings, you can immediately receive the new signals.
What is the average number of daily signals?
For example, on average: 0.75 trades per day
Also, these signals are not regular
That means you may have 4 signals in one day
But in 4 days, don't have any signal
If I use a VPS, can I receive a signal reception alert with my mobile phone?
Yes, enable this option in settings
Mobile notification