Combined MT4
- 지표
- Ahmed Alaaeldin Abdulrahman Ahmed Elherzawi
- 버전: 1.2
- 업데이트됨: 4 2월 2023
- 활성화: 5
Welcome to Investment Castle products
This product is exclusively available in the MQL5 market and is not available and will not be available anywehere else.
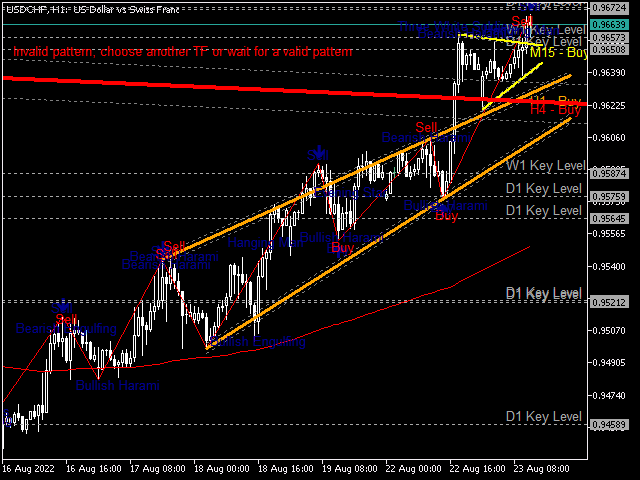
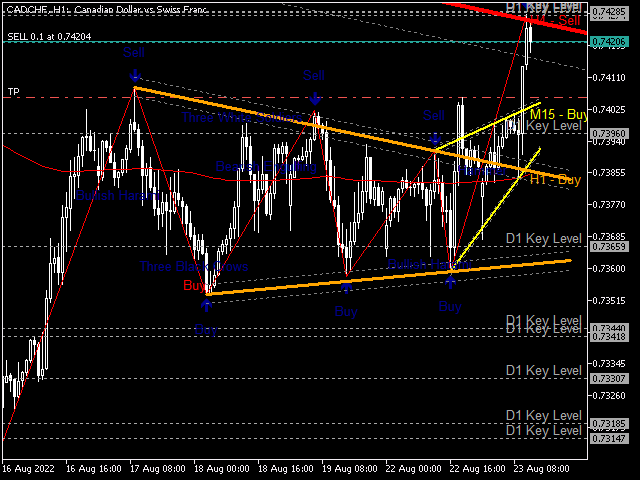
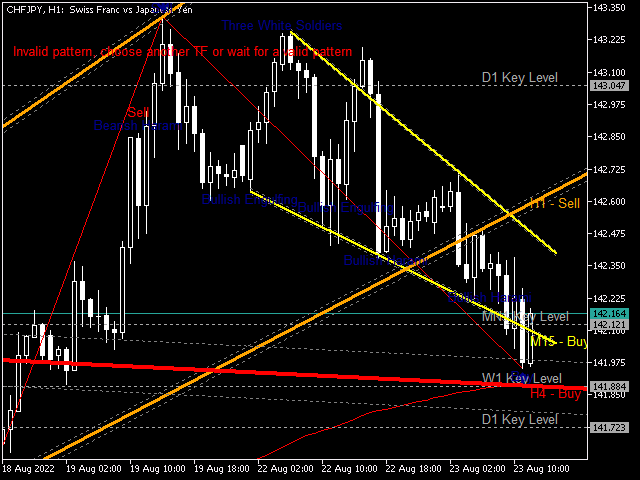
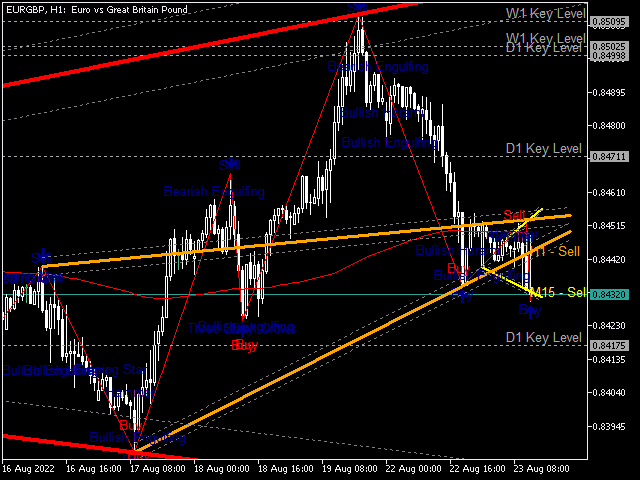
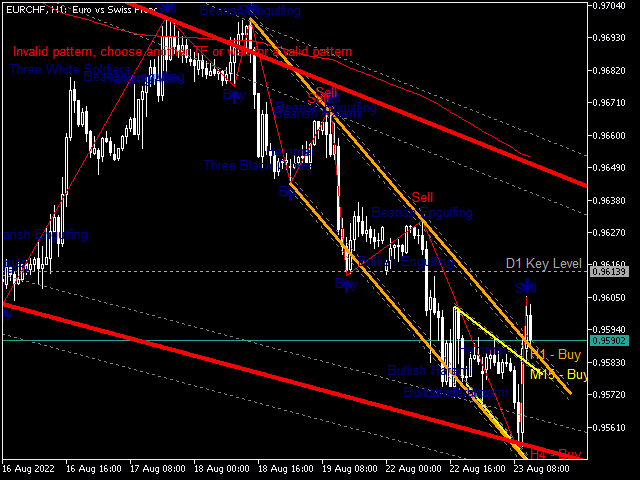
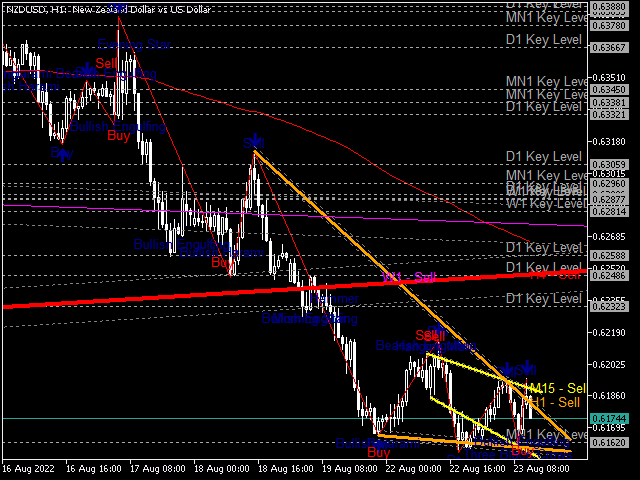
The Combined indicator is a multi-time frame indicator and it is built using 3 indicators:
- Bands indicator which draws the support and resistance key levels using up to 5 different time frames
- Patterns indicator which draws the chart patterns using up to 6 different time frames
- Spots indicator which shows the common candlestick patterns
You will notice the price always reacts to the patterns, key levels and the candlestick patterns as that's how the price action is based on. You will also notice that the price always reacts to the lines of the different time frames. That's why this indicator is very powerful in automating the price action analysis on the chart.
Use the default settings on H1 chart for the best trading setups.
The Combined indicator automates everything for you on any chart time frame, showing the channels, wedges, triangles, etc and all candlestick patterns on the same chart. It will give you comfort when trading or setting the direction of the EA you are using.
For the best results, be familiar with the common chart patterns and you will rely on this indicator solely.
This indicator works with currency pairs, stocks, commodities.