Open Momentum
- 지표
- Claus Dietrich
- 버전: 24.4
- 업데이트됨: 17 4월 2024
- 활성화: 20
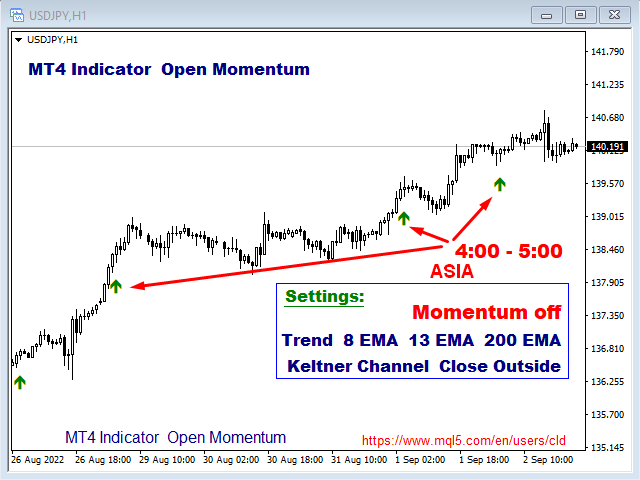
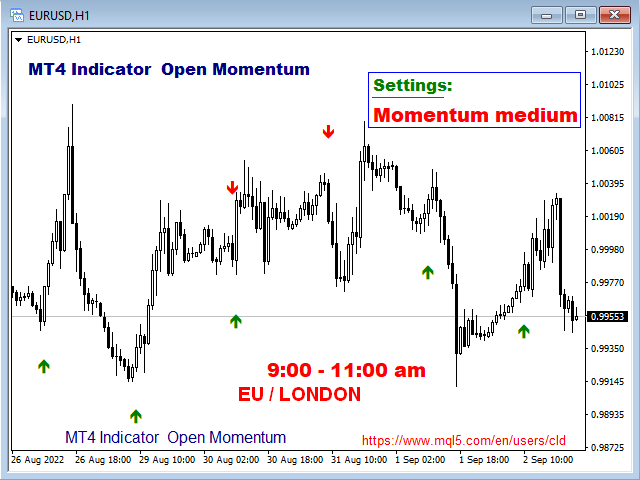
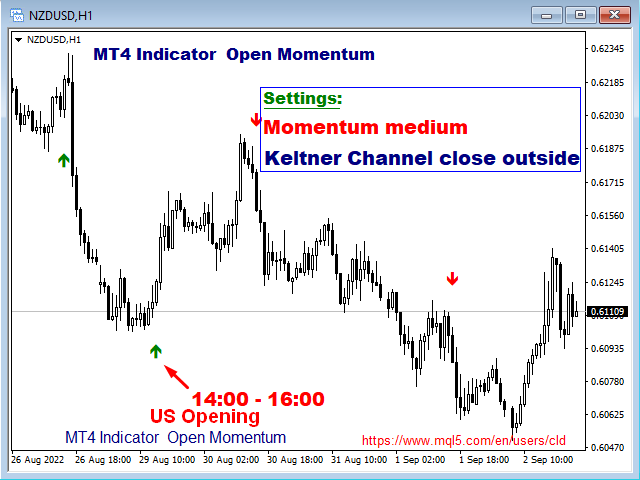
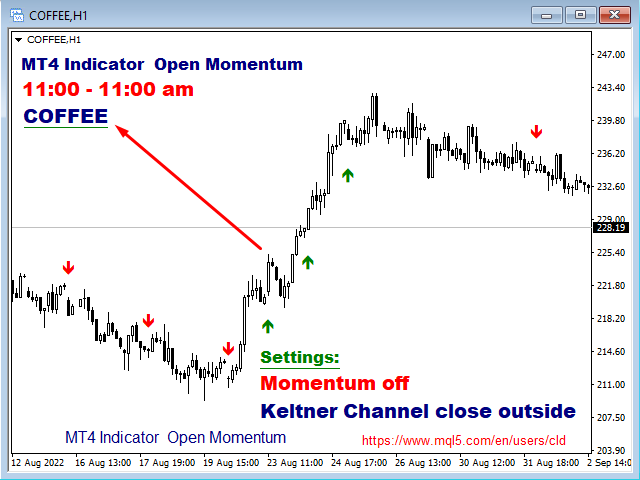
Optimized for Asia- London- US- Open-Session 🕗 🕑 🕝
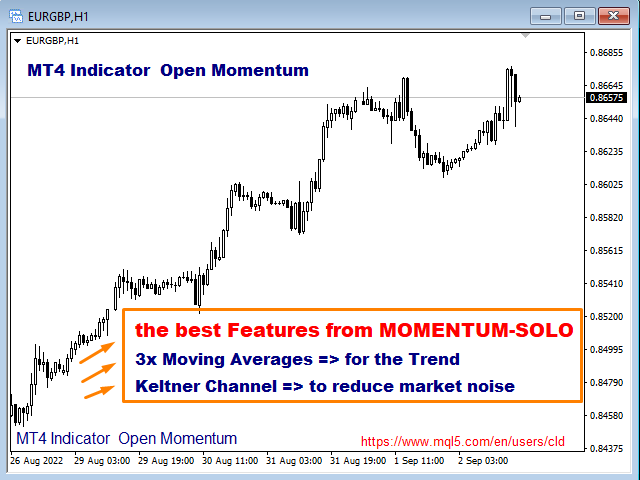
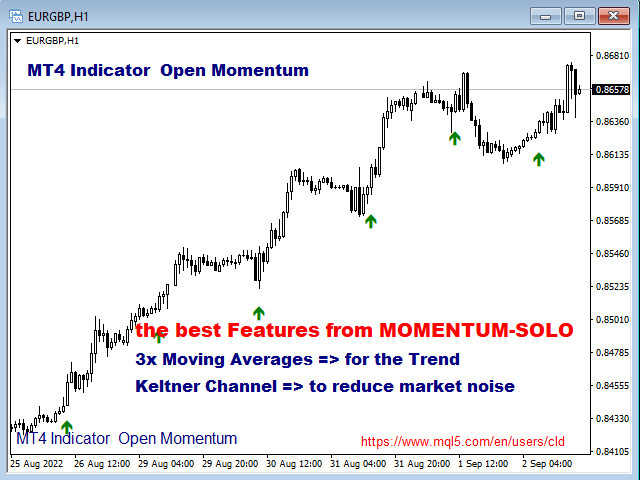
the best Features from MOMENTUM-SOLOtrue Momentum - time-based Indicator
it's based on a self-developed candle Pattern, in relation to the ATR
Filter
- Daytime
- Weekdays
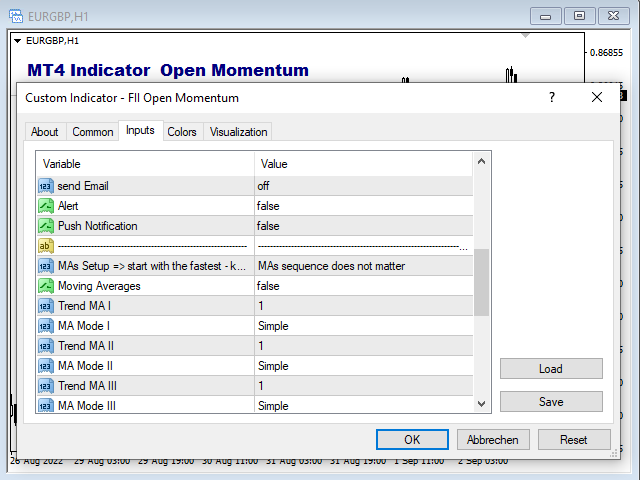
- Moving Averages
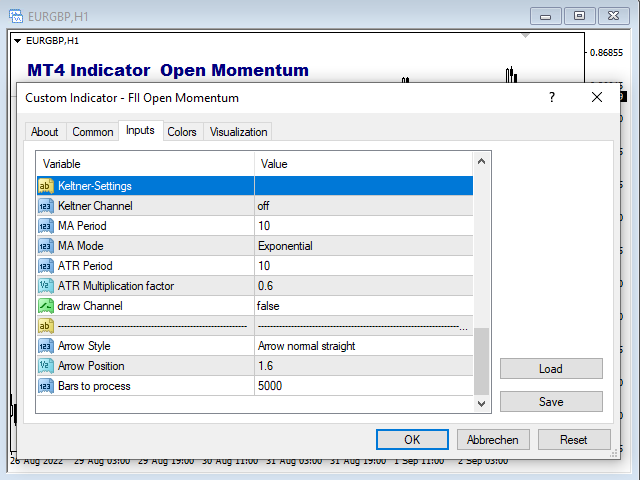
- Keltner-Channel
Advantages
- Optimized for Asia- London- US- Open-Session
- choose your personal times to trade - select Daytime and Weekdays
- Keltner-Channel => to reduce market noise - sideways movement will be hidden
- 3x Moving Averages => for the Trend
- Signal after close - no repaint
Alerts
- Screen-Alert
- Push-Notification
- for more, please go to: https://www.mql5.com/en/blogs/post/750406