UR FrontEndBackEnd
- 지표
- Krzysztof Jan Debski
- 버전: 1.15
- 업데이트됨: 16 5월 2024
- 활성화: 10
UR 프런트엔드백엔드
UR FrontEndBackEnd는 지지와 저항의 가장 정확한 수준을 찾기 위해 제가 가장 좋아하는 공식입니다. 나는 또한 그것들이 얼마나 강한지를 표시하기 위해 그것들을 다른 범주(파선, 실선 및 영역)로 나누었습니다. 모두 버퍼에 저장되므로 다른 도구 내에서 쉽게 액세스하고 구현할 수 있습니다.
추가: 도구가 적용되는 자산에 맞게 도구를 조정해야 할 수 있습니다. 도구에 영향을 미치는 가격의 자릿수 nr 측면에서 자산이 다릅니다. 필요한 매개변수는 설정에서 제공됩니다.
UR FrontEndBackEnd 사용의 이점:
계산의 밀도와 거리를 설정하는 매개변수 2개
지지선과 저항선은 버퍼 내부에 저장되며 주어진 자산의 현재 가격에서 시작하여 오름차순/내림차순으로 저장됩니다.
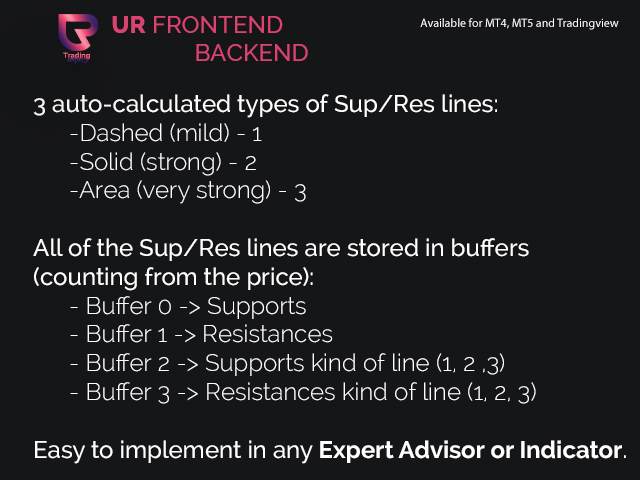
지지선/저항선의 강도에 대한 빠른 시각적 피드백을 위한 3가지 선 -> DASHED, SOLID 및 AREA
도구 업데이트를 최신 상태로 유지하고 빠진 것이 있다고 생각되면 요청을 보낼 수 있는 특별한 텔레그램 채팅이 있습니다!
왜 UR FrondEndBackEnd 입니까?
사용 및 설정이 가장 쉬운 지지/저항 지표이며 다른 도구 내에서 구현하는 것도 가능합니다. 모든 데이터는 쉽게 읽을 수 있으며 4개의 버퍼에 저장됩니다.
UR FrondEndBackEnd를 사용하는 방법?
자세한 내용은 아래 설명을 참조하십시오.
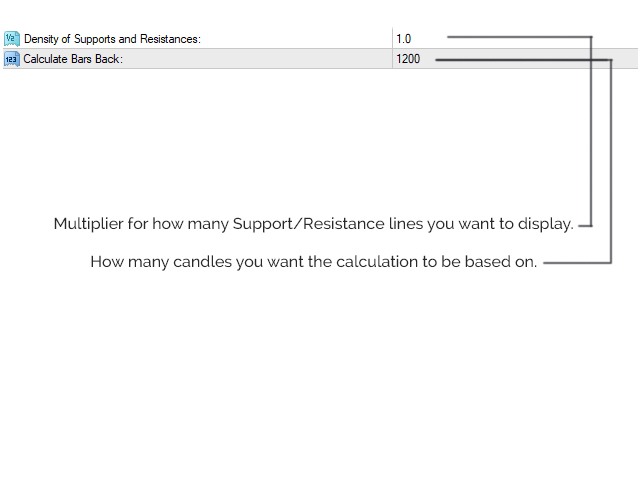
설정
밀도: 계산할 라인 수를 결정합니다.
막대 뒤로: 지표가 차트에서 얼마나 멀리 이동하고 그에 따른 계산을 위해 양초 데이터를 가져와야 합니까?
표시하다
점선: 약한 지지/저항(1)
실선: 강력한 지지/저항(2)
영역선: 매우 강한 지지/저항(3)
가격 위의 모든 라인은 빨간색으로 표시되고 가격 아래의 모든 라인은 파란색으로 표시됩니다.
덧셈
모든 데이터는 4개의 버퍼에 저장됩니다.
- 버퍼 0 -> 가격 하락을 시작하는 지원 라인
- 버퍼 1 -> 가격 상승을 시작하는 저항선
- 버퍼 2 -> 지원 라인의 강도(1, 2, 3)
- 버퍼 3 -> 저항선의 강도(1, 2, 3)