Average directional index
- 지표
- Andrey Kozak
- 버전: 2.0
- 업데이트됨: 30 7월 2022
- 활성화: 20
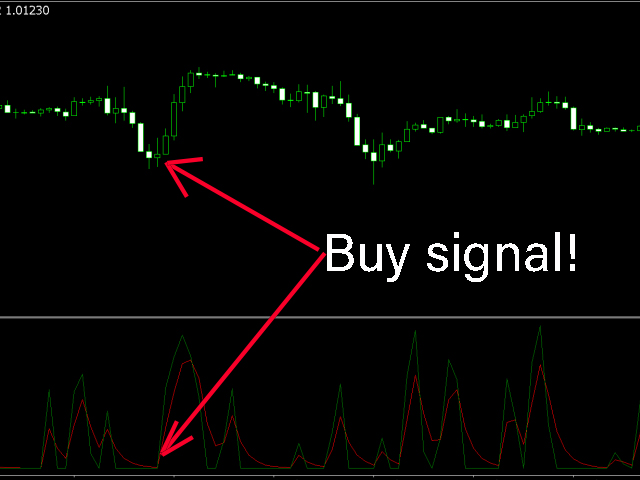
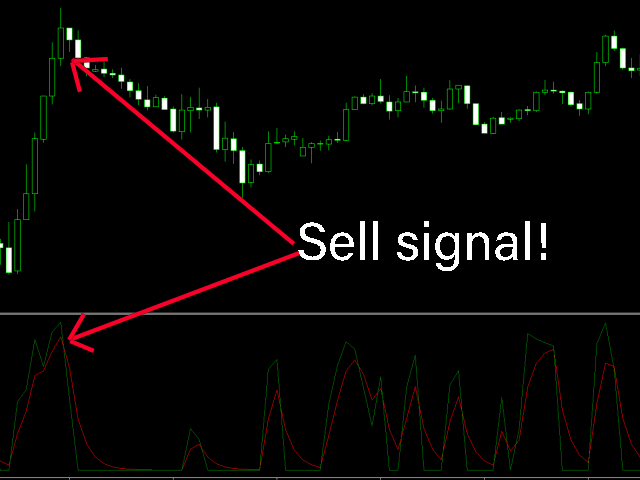
Average directional index - improved indicator formula. This version of ADX much more accurately determines the price reversal points and the direction of the current trend. In addition, using this indicator, you can determine the strength of the trend. When the green line crosses the red line from the bottom up, this means that the trend is turning up or a temporary pullback is forming. When the red line crosses the green line from top to bottom, it means that the trend is turning down or a temporary pullback is forming.
How can you trade with the Average directional index indicator:
- Purchase transactions. Add the Average directional index indicator to the chart + add the standard Moving Average indicator. When the price is above the moving average, we wait for the moment when the green line crosses the red line from the bottom up and open a buy deal.
- Deal for sale. Add the Average directional index indicator to the chart + add the standard Moving Average indicator. When the price is below the moving average, we wait for the moment when the red line crosses the green line from top to bottom and open a sell deal.
Advantages of the Average directional index indicator:
- improved ADX formula
- more than the standard version
- well shows price reversal points
- you can trade on all currency pairs and timeframes
- suitable for trading with a scalping strategy
Settings of the Average directional index indicator:
- period - specifies the period for calculating indicator values
