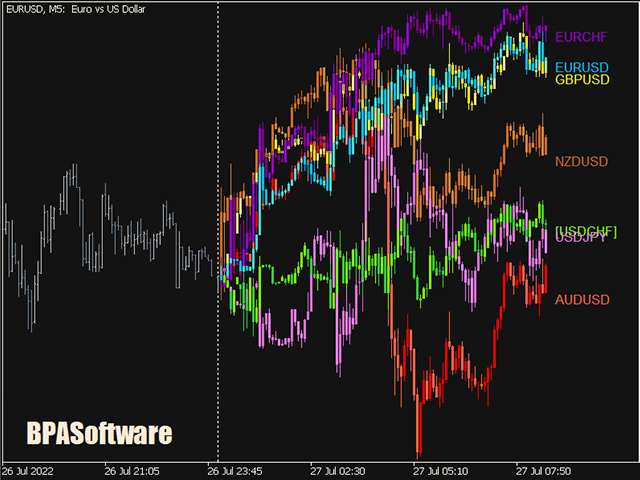
Overlay of multi timeframe charts
- 지표
- BPASoftware Thai Co. Ltd
- 버전: 1.2
- 업데이트됨: 27 7월 2022
- 활성화: 10
The Timeframe Overlay indicator displays price action for multiple timeframes on a single chart, allowing you to quickly assess different timeframes from a single chart.
The advantage is to observe and follow the correlations of price movements in real time to help you find potential trades at a glance.---- Symbol 1 ----
Symbol = EURUSD
Correlation Inverse = false
Display = true
Ratio = 1.0
Ponderation = 5
---- Symbol 2 ----
Symbol = EURCHF
Correlation Inverse = false
Display = true
Ratio = 1.0
Ponderation = 5
---- Symbol 3 ----
Symbol = USDCHF
Correlation Inverse = true
Display = true
Ratio = 1.0
Ponderation = 3
---- Symbol 4 ----
...
---- Miscellaneous ----
Start Time (default: 6:00) = 6:00
Font Size = 14
Shift Size (0, 1, 2) = 0
Price Scale = false
