Volatility Vision modern
- 지표
- Pavel Bereznichenko
- 버전: 1.2
- 활성화: 10
Volatility Vision: Essential for Forex and Stock Markets
Volatility Vision 발견: 당신의 거래 혁명
초보자와 전문가 트레이더 모두에게 완벽함
쉬운 시작 가이드: 우리의 사용자 매뉴얼로 효과적으로 사용하는 방법을 배우세요.
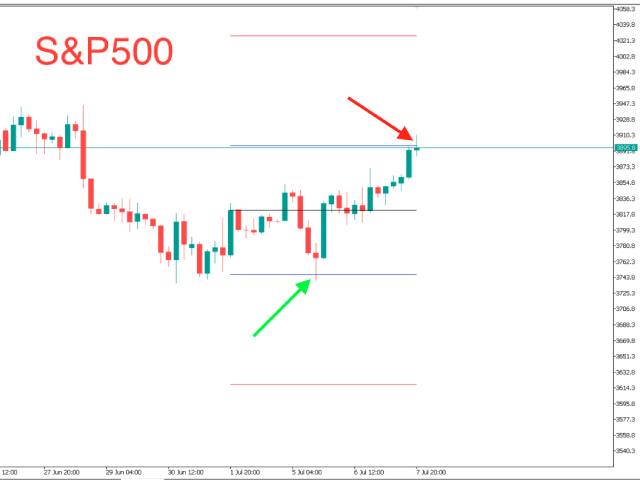
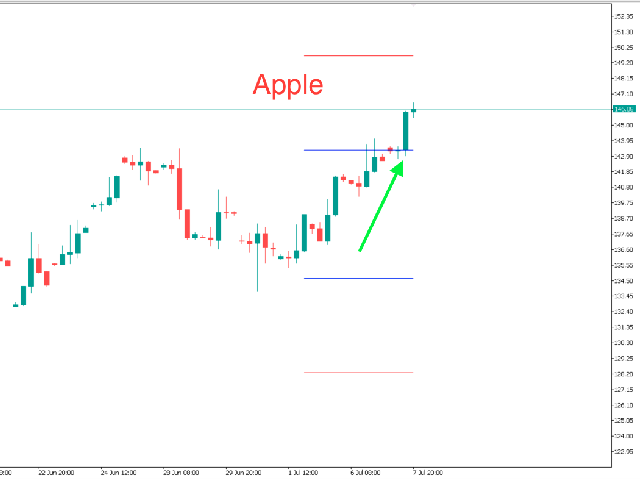
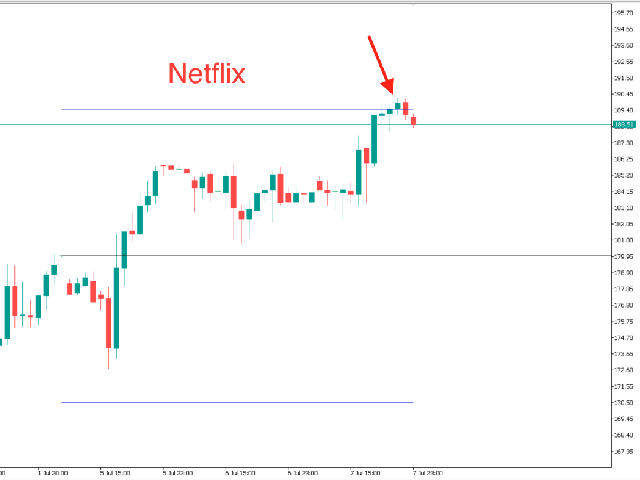
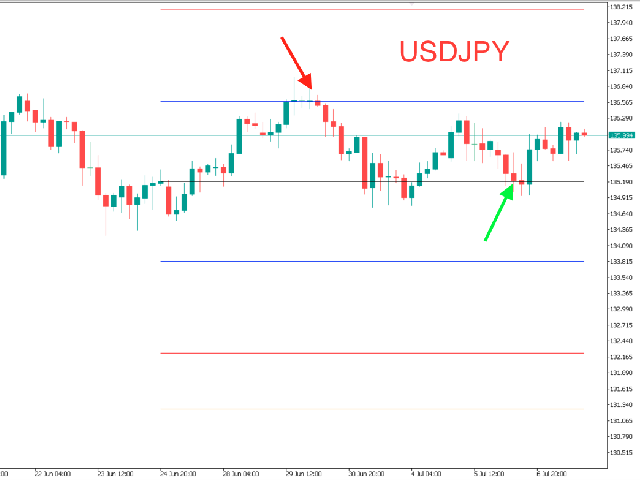
Volatility Vision 지표는 차트에서 정확한 변동성 수준을 표시하는 강력한 도구입니다. 이 다목적 도구는 거래 전략에 통합하는 데 필수적이며 모든 통화 쌍 및 주식 시장과 호환됩니다.
변동성 임계값을 활용하여 한 주 동안의 거래를 자신 있게 관리하세요.
Volatility Vision의 장점
- 정확도 향상: 스토캐스틱 오실레이터에서 흔히 발생하는 거짓 신호를 크게 줄입니다.
- 조기 신호: RSI보다 먼저 거래 신호를 포착하여 놓친 기회를 잡을 수 있습니다.
- 시장 선도: MACD가 반응하기 전에 사전 정보를 제공합니다.
- 신뢰성: CCI의 거짓 신호 문제를 피합니다.
간편한 설정
시작하려면 ATR 값을 입력하세요(기본값은 15). 모든 수준은 일관된 분석을 위해 고정되어 있으며, 데이터 갱신을 위해 시간 프레임을 전환하세요.
지표 가이드
- 파란색 선: 일일 변동성.
- 빨간색 선: 주간 변동성.
- 주황색 선: 월간 변동성.
전통적인 ATR과 Volatility Vision을 결합하여 더 전략적인 기회를 찾으세요. 오늘 바로 거래 전략을 향상시키세요!
지표를 지금 구입하세요: 마켓 방문
설치가 간단하여 즉시 성공을 준비할 수 있습니다!
중요: 정적 값 제한으로 인해 지표는 플랫폼에서 첫 주 동안만 테스트할 수 있습니다.