Spots MT4
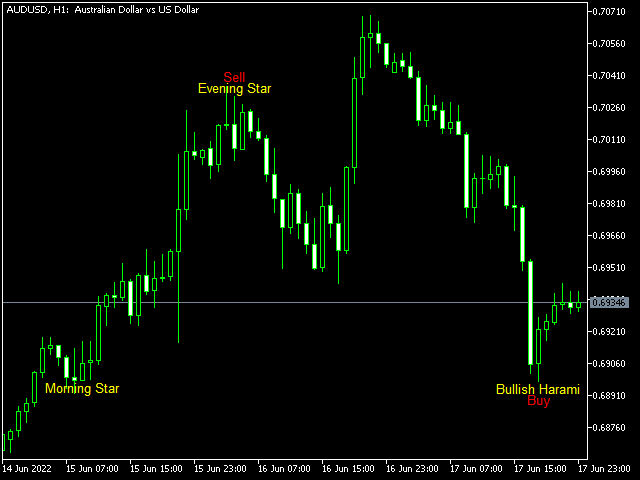
The Spots Indicator can be used for Entering and Exiting your trades based on the common candlestick patterns such as: engulfing, hanging man, doji etc. It is designed to publish desktop and mobile notification every time a signal is triggered. However, it is worth noting that this indicator is recommended to be used with other indicator for confirming the entries.
It is best to use it with the Investment Castle Trend Lines indicator and the Supply and Demand indicator