Market Entropy
- 지표
- Elian Isaac Rodrigues Oliveira
- 버전: 1.0
- 활성화: 5
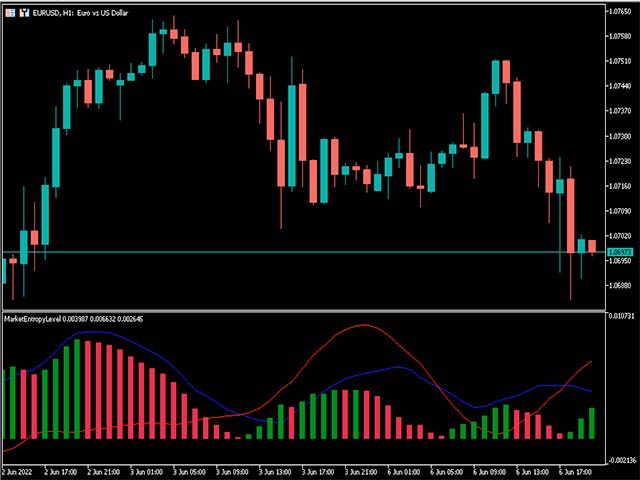
The Market Entropy indicator was created to measure the order of price changes over time.
consists of two lines and a histogram where the lines are responsible for measuring the price movement and the histogram measures the strength of the analyzed movement.
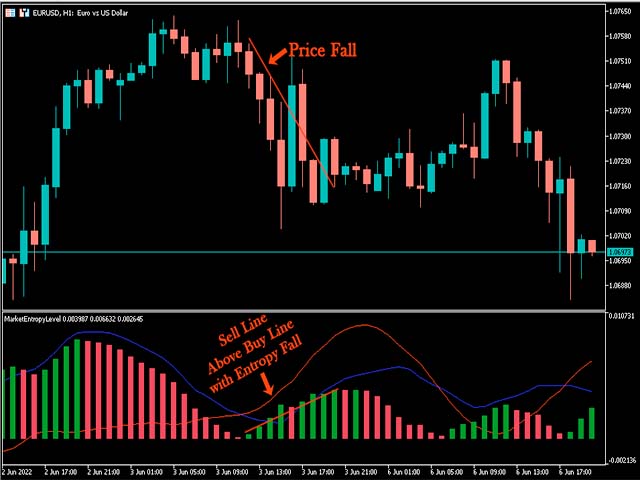
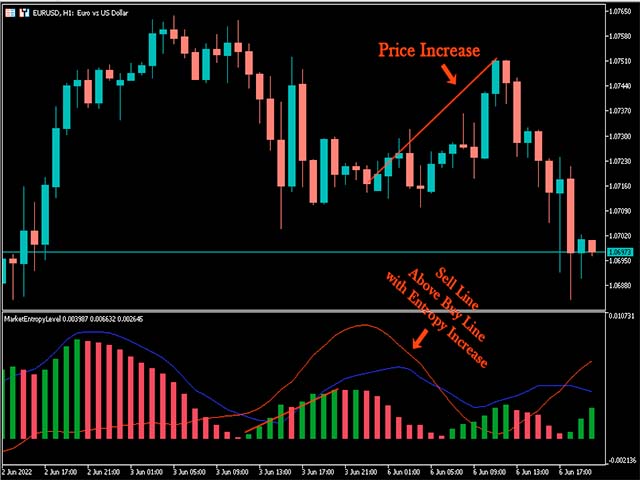
It can be used to find a trend (Image 2) or price reversal (Image 3).
Blue Line: Buy Entropy
Red Line: Sell Entropy
Historgram: Market Entropy
Interpretation:
Buy Line above the Sell Line indicates that in the analyzed period buyers were responsible for moving most of the price.
Sell Line above the Buy Line indicates that in the analyzed period Sellers were responsible for moving most of the price.
The histogram is responsible for measuring the entropy of the market. the higher the value, the lower the entropy indicating greater force of the movement.
below some examples for the EURUSD 1H chart


