Pullback Hunter
- 지표
- Anton Polkovnikov
- 버전: 1.0
- 활성화: 5
PULLBACK HUNTER
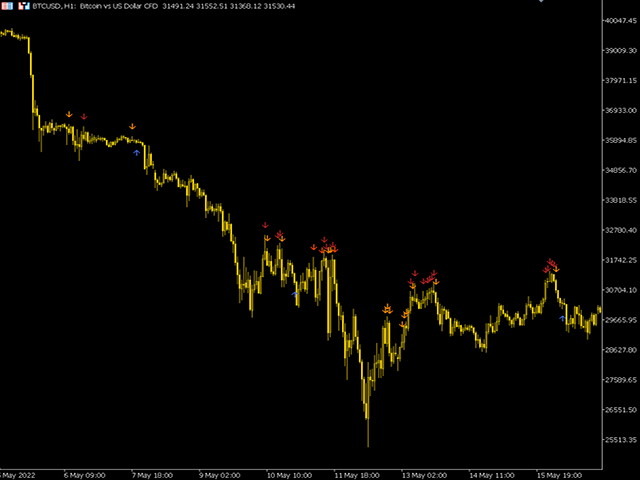
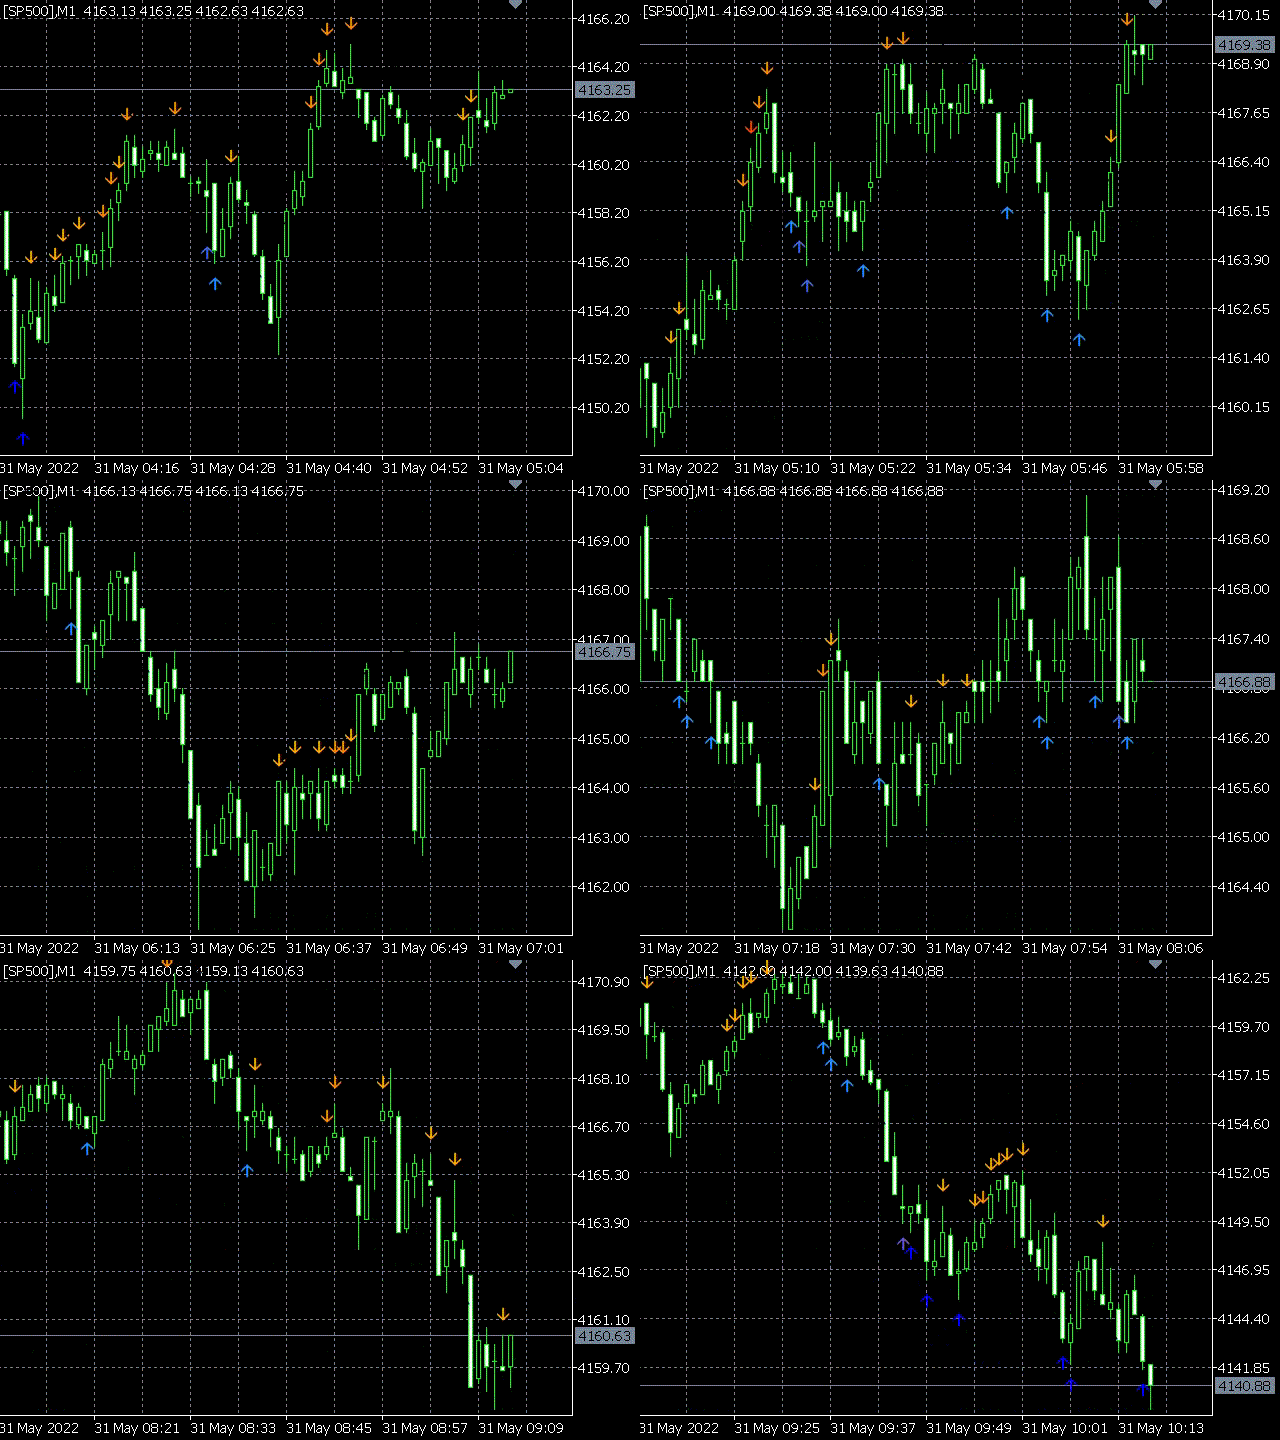
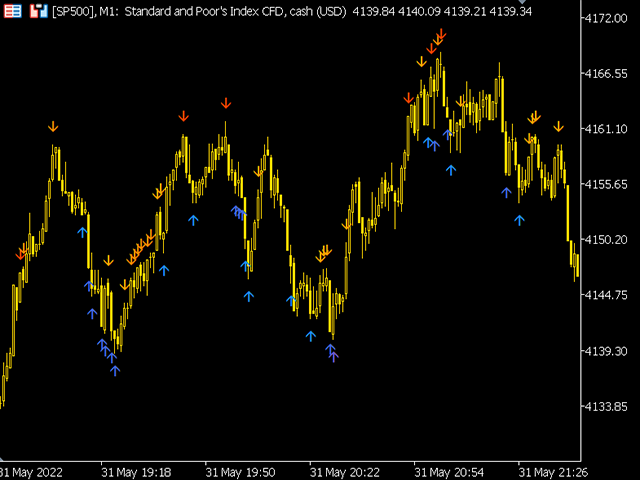
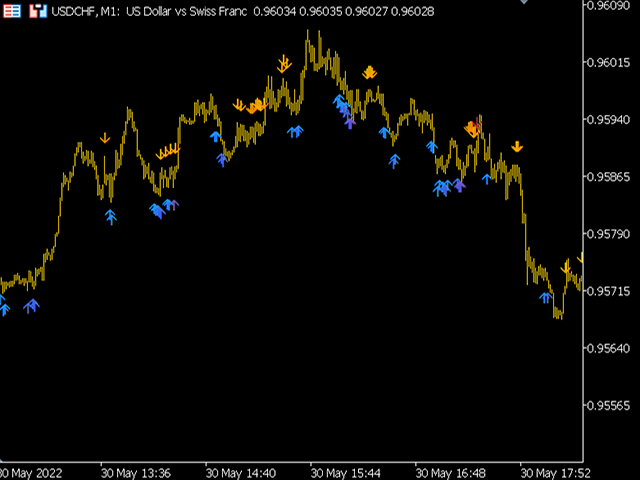
What is every trader's cherished dream? To see without delay the places where the reversal will happen. This, of course, is from the category of magic, though... nothing is impossible. But for now I've prepared for you an indicator that marks in real time the end of corrections to the current movement or in short - catches pullbacks.What is the main point? Many people practice rebounds when the price moves in the direction of the open position. And they do them on the formation of new extrema. Everything is good, but in this case, the weighted average price of the position is not optimal. But if we wait for pullbacks and buy in during the trend, we will get a good average price. This indicator shows the places where the correctional movement is most likely to end.
What is important? It is not recommended to use the indicator "head-on". That is, on the "up" arrow to buy and wait for the down arrow to close the purchase. The optimal use of the indicator is a set position. With the additional tool you filter your direction and on the arrows you buy (or short) in the filtered direction. For example, you use the Cumulative Delta. It shows you buying across the market. You wait for the up arrows and buy. Use additional analytical tools to exit the position.
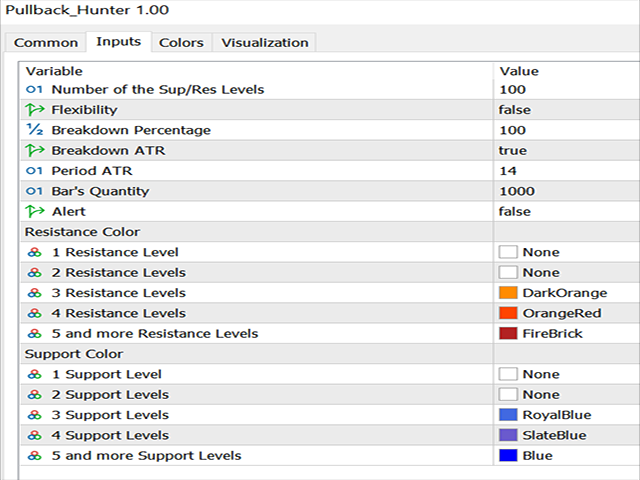
What is the principle of the indicator? Arrows are the places where the price tests the support or resistance levels. These levels are calculated by the algorithm inside the indicator. One and the same candle may test several support levels at the same time. This can be understood by the color of the arrows. If the candlestick has tested one level, then its color will be determined by the setting item "1 Support Level" (see picture "Window of settings"). If two levels, then "2 Support Levels", etc. There may be many candlesticks, which test one single level, and you can disable their display by selecting the color "None".
Signals appear without delay at the end of a candle, if it has tested the level. The signals do not overdraw.
You can select the Number of the Sup/Res levels you want to analyze. You can also enable the Flexibility option for the levels.
The levels disappear if they are broken by the price. The breakdown value is determined by the user in the settings. If the Breakdown ATR item is disabled, the breakdown value is a percentage of the current price, set by the Breakdown Percentage item. Otherwise, the breakdown value is determined by the ATR value, or more precisely by the set percentage of the ATR value (if percentage = 50 and Breakdown ATR = true, then the breakdown is 50% of the current ATR value).
Bar's Quantity - the number of candles to the left on which the indicator signals are displayed.
You can also enable alerts on the appearance of signals.
PULLBACK HUNTER is not an Expert Advisor! When using it, you need to additionally determine the main direction of price movement. Work with the settings and choose the optimal parameters at which the majority of corrective movements are "caught". The indicator works on all timeframes and trading instruments.

