• 미리보기
  • 리뷰
  • 코멘트
  • 새 소식

Fulltrend


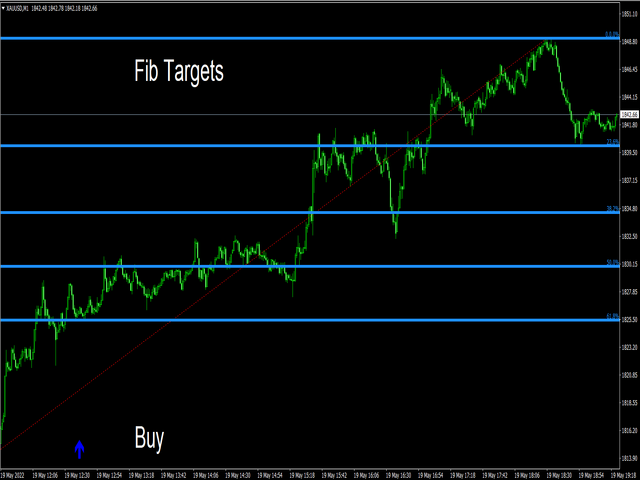
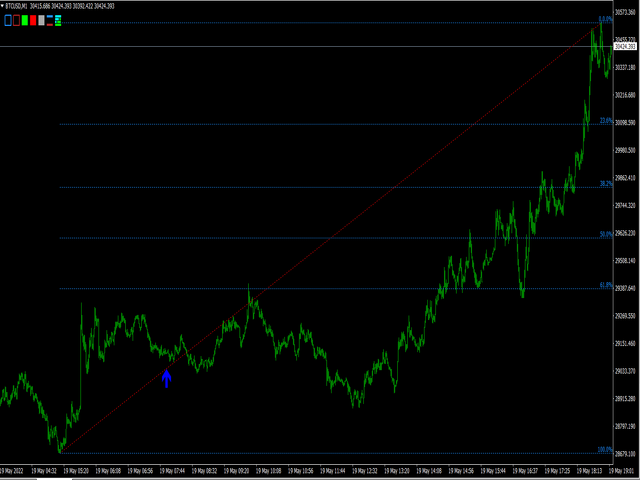
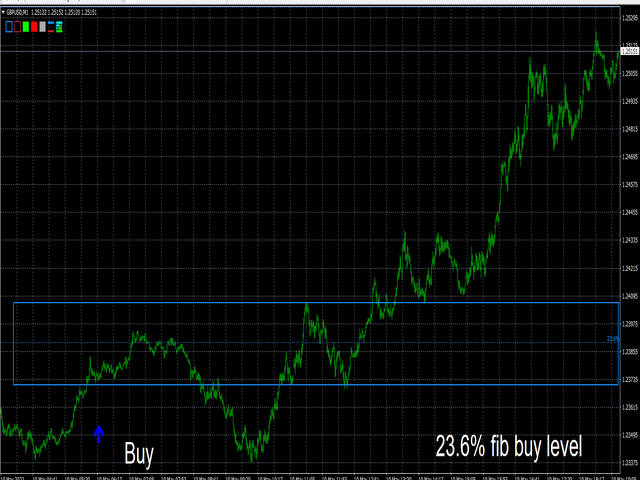
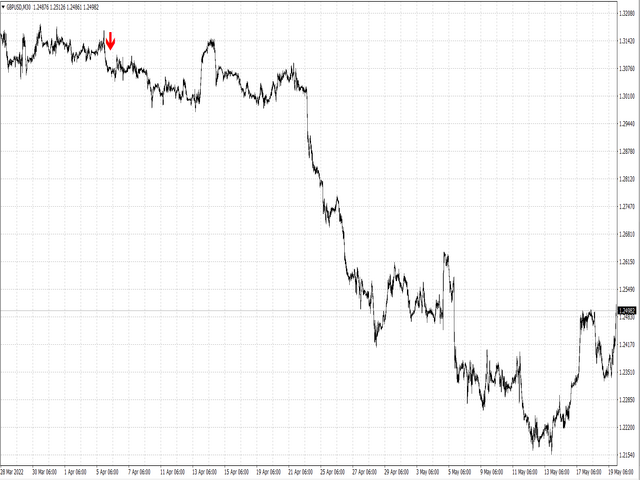
Improve trading with this indicator.  Find areas of buys or sells in Fibonacci retracement areas.  Fulltrend is for scalping and making swing trades.  Fib levels are added for take profits and stop losses. This works on any time frame and can be used by itself or together with other systems and indicators for filters. The indicator doesn't repaint.  Alerts are added and can be true or false.  No need to sit glued to the computer, just set on charts and listen or the alerts to come.  Take a position accordingly and use trailing stops and have targets, use  the swing low or swing high for sl.  Trade during active times, follow global trend.

추천 제품
PZ Divergence Trading
PZ TRADING SLU
5 (3)
Unlock hidden profits: accurate divergence trading for all markets Special Offer: Purchase now to receive free bonuses worth $159! (Read more for details) Tricky to find and scarce in frequency, divergences are one of the most reliable trading scenarios. This indicator finds and scans for regular and hidden divergences automatically using your favourite oscillator. [ Installation Guide | Update Guide | Troubleshooting | FAQ | All Products ] Easy to trade Finds regular and hidden divergence
The indicator detects and displays Shark harmonic pattern (see the screenshot). The pattern is plotted by the extreme values of the ZigZag indicator (included in the resources, no need to install). After detecting the pattern, the indicator notifies of that by a pop-up window, a mobile notification and an email. The indicator highlights the process of the pattern formation and not just the complete pattern. In the former case, it is displayed in the contour triangles. After the pattern is comple
Master scalping M1
Nataliia Marchuk
Master Scalping M1 is an innovative indicator that uses an algorithm to quickly and accurately determine the trend.The indicator calculates the time of opening and closing positions, the indicator's algorithms allow you to find the ideal moments to enter a deal (buy or sell an asset), which increase the success of transactions for most traders. Benefits of the indicator: Easy to assemble, does not overload the chart with unnecessary information. Can be used as a filter for any strategy. Works on
We present you the indicator "Candle closing counter", which will become your indispensable assistant in the world of trading. That’s why knowing when the candle will close can help: If you like to trade using candle patterns, you will know when the candle will be closed. This indicator will allow you to check if a known pattern has formed and if there is a possibility of trading. The indicator will help you to prepare for market opening and market closure. You can set a timer to create a p
Auto Levels
Yaroslav Varankin
Auto Level this tool is able to determine the levels of support and resistance. search and display when the price has broken through the level and when it pushed off from it. the indicator can be useful if you use resistance support levels in your trading. or the highs and lows of the price, then it will greatly simplify your work and help you more quickly and more accurately determine the rebound or breakdown of the current trend or tendencies level. blue line bottom uptrend red line on top dow
This product is a part of  ON Trade Waves Patterns Harmonic Elliot Wolfe you can test free version on EURJPY from this link  Wolf Waves Indicator 울프 웨이브(Wolf Waves) 발견하기 - 귀하의 궁극적인 거래 도구! 어떤 시간 프레임에서든 울프 웨이브를 쉽게 찾을 수 있는 강력한 도구를 찾고 계신가요? 더 이상 찾을 필요가 없습니다! 저희의 울프 웨이브 인디케이터는 이 작업을 쉽게 해내며, 여기서 왜 귀하에게 완벽한지 설명하겠습니다: 주요 기능: 자동 감지: 우리의 울프 웨이브 인디케이터는 복잡한 알고리즘을 사용하여 키 포인트를 자동으로 찾아 차트에 해당 선을 그립니다. 수동으로 패턴을 찾아 다니는 번거로움을 이제 더 이상 느낄 필요가 없습니다. 사용자 친화성: 이 인디케이터는 사용하기 간단하게 설계되어 있어 경험이 풍부한 트레이더든 울프 웨이브에 처음 접하
Trend Map
Maryna Shulzhenko
The Trend Map indicator is designed to detect trends in price movement and allows you to quickly determine not only the direction of the trend, but also to understand the levels of interaction between buyers and sellers. It has no settings and therefore can be perceived as it signals. It contains only three lines, each of which is designed to unambiguously perceive the present moment. Line # 2 characterizes the global direction of the price movement. If we see that the other two lines are above
ZigZag on average
Valeriy Medvedev
This is a well-known ZigZag indicator. But it differs by the fact that its plot is based on values of the middle line which is set by a user. It can display Andrews’ Pitchfork and standard or Bobokus Fibo levels. NO REPAINTING. Parameters Period МА — middle line period. Default value is 34. Minimum value is 4. Maximum value is set at your discretion. Used to calculate price - base price to calculate the middle line. The averaging method - method of smoothing the middle line. Turning pitchfork
MT4용 외환 지표 "Trend ZigZag가 포함된 MACD" MACD 지표 자체는 추세 거래에 가장 널리 사용되는 도구 중 하나입니다. "Trend ZigZag가 포함된 MACD"는 가격 조치 항목과 함께 사용하거나 다른 지표와 함께 사용하는 데 탁월합니다. 이 표시기를 사용하여 가장 정확한 진입 신호를 선택하세요. - MACD가 0(녹색) 위에 있고 지그재그 선이 상승한 경우 - 매수가 행동 패턴만 검색 - MACD가 0(분홍색) 미만이고 지그재그 선이 하향인 경우 - 매도가 행동 패턴만 검색 표시기에는 모바일 및 PC 알림이 내장되어 있습니다. // 더 훌륭한 전문가 자문 및 지표는 여기에서 확인할 수 있습니다: https://www.mql5.com/en/users/def1380/seller 본 MQL5 홈페이지에서만 제공되는 오리지널 제품입니다.
Infinity Trend Pro
Yaroslav Varankin
1 (1)
This is a trend indicator without redrawing Developed instead of the binary options strategy (by the color of the Martingale candlestick) Also works well in forex trading When to open trades (binary options) A signal will appear in the place with a candle signaling the current candle It is recommended to open a deal for one candle of the current timeframe M1 and M5 When a blue dot appears, open a deal up When a red dot appears, open a trade down. How to open trades on Forex. When a signal is rec
Wave Wolf MT4
Andrei Salanevich
거래 단말기의 현재 창에 늑대 파도를 검색하여 표시하도록 설계되었습니다. 거래에 늑대 파도를 사용하는 상인을위한 훌륭한 지표. 거래 전략에서의 적용은 효율성과 수익성을 크게 증가시킬 것입니다. 표시기에 대한 정보 다른 늑대 웨이브 지표와는 달리,웨이브 고원지 외환 지표는 크게 그 효과를 증가 기능을 가지고 있습니다: 첫 번째는 열린 창 5 점 매개 변수(진정한 값)정보 지원을 제공합니다,즉 늑대 파도가 나타난 차트의 창을 확장합니다. 예를 들어,유로화 차트가 열려 있고 각각에 웨이브 월드 표시기가 설치되어있는 경우 유로화 모델이 감지되면 해당 차트가 자동으로 다른 차트의 맨 위에 포 그라운드로 가져 오므로 많은 상품을 거래 할 때 매우 편리합니다.  두 번째 기능은 맥 디에 내장 된 발산 분석,사용자가 자신을 선택할 수있는 매개 변수(기본 설정(12,26,9))입니다. 그런데 일반적인 오실레이터의 값은 작업 창에 표시되지 않으며 점을 형성 할 때 가격 라벨의 색상에만 반영됩
Convergence is when the higher highs and higher lows of an uptrend are also confirmed by our indicator making lower lows which helps us confirm that momentum is increasing and so the trend is likely to continue. Vice versa for a downtrend. Divergence is when we get higher highs on an uptrend but which are not supported by our indicator which makes lower highs and therefore signals the underlying momentum is failing and so a reversal might occur. Vice versa for downtrend. I have combined these me
PZ Penta O MT4
PZ TRADING SLU
The Penta-O is a 6-point retracement harmonacci pattern which usually precedes big market movements. Penta-O patterns can expand and repaint quite a bit. To make things easier this indicator implements a twist: it waits for a donchian breakout in the right direction before signaling the trade. The end result is an otherwise repainting indicator with a very reliable trading signal. The donchian breakout period is entered as an input. [ Installation Guide | Update Guide | Troubleshooting | FAQ | A
This is a new strategy for SUPPLY DEMAND areas It is based on a calculation using the tick volume to detect the big price action in market for both bear /bull actions this smart volume action candles are used to determine the supply and demand areas prices in between main supply and demand lines indicate sideway market  up arrows will be shown when prices moves above the main supply and the secondary supply lines Down arrows will be shown when prices moves below the main demand and the secondary
The indicator detects and displays 3 Drives harmonic pattern (see the screenshot). The pattern is plotted by the extreme values of the ZigZag indicator (included in the resources, no need to install). After detecting the pattern, the indicator notifies of that by a pop-up window, a mobile notification and an email. The indicator highlights the process of the pattern formation and not just the complete pattern. In the former case, it is displayed in the contour triangles. After the pattern is com
MACDivergence MTF
Pavel Zamoshnikov
4.29 (7)
Advanced ideas of the popular MACD indicator: It detects and displays classic and reverse divergences (three methods of detecting divergences). It uses different color to highlight an uptrend and a downtrend. Two methods of determining a trend: а) MACD crosses the 0 level (classic signal); б) MACD crosses its own average (early signal). This is a multi-timeframe indicator: it can display MACD data from other timeframes. Two methods of drawing: classic histogram and line. It generates sound and v
For this set of indicators 1. General information     - Calculates with high performance mathematical algorithms.     - Calculated from the price of candles     - The entry point of this order is filtered by the train EMA and the oscillator.     - Calculate the integrity of the candle 2. How does it work?     - You can see two types of order entry points: the notification on the monitor and the arrow.     - You can trust 75-95 percent of this entry point. 3. Settings     - A complete candle
Noize Absorption Index MT4
Ekaterina Saltykova
5 (1)
Noize Absorption Index - is the manual trading system that measures the difference of pressure between bears forces and bulls forces. Green line - is a noize free index that showing curent situation. Zero value of index shows totally choppy/flat market.Values above zero level shows how powerfull bullish wave is and values below zero measures bearish forces.Up arrow appears on bearish market when it's ready to reverse, dn arrow appears on weak bullish market, as a result of reverse expectation. S
Supply Demand WTC
Stefano Cocconi
Check My Product Contact me to discover all my services  Supply and demand zones are one of the most basic things a beginner forex trader learns. These zones are so important, price reacts off of them even after years since they first developed. And with the supply and demand zones indicator, a forex trader might not need to worry about drawing all these historical zones one after the other. The supply and demand zone indicator accurately draws the supply and demand zones of a currency pair
Divergence is one best ways to trade the financial market as it is a leading indicator of price action that detect high probability reversal and continuation setups.   The AlgoKing Divergence Detector is an RSI and Stochastics Indicator with Divergence Detection. Features Hidden Divergence for trend continuation. Standard or Normal Divergence for trend reversal. Screen Alerts. MetaQuotes Notifications. Email Notifications. RSI Indicator built in. Stochastics Indicator built in. Types of Divergen
VR Cub
Vladimir Pastushak
VR Cub 은 고품질 진입점을 얻는 지표입니다. 이 지표는 수학적 계산을 용이하게 하고 포지션 진입점 검색을 단순화하기 위해 개발되었습니다. 지표가 작성된 거래 전략은 수년 동안 그 효율성을 입증해 왔습니다. 거래 전략의 단순성은 초보 거래자라도 성공적으로 거래할 수 있다는 큰 장점입니다. VR Cub은 포지션 개시 지점과 이익 실현 및 손절매 목표 수준을 계산하여 효율성과 사용 편의성을 크게 높입니다. 간단한 거래 규칙을 이해하려면 아래 전략을 사용한 거래 스크린샷을 살펴보세요. 설정, 세트 파일, 데모 버전, 지침, 문제 해결 등은 다음에서 얻을 수 있습니다. [블로그] 다음에서 리뷰를 읽거나 작성할 수 있습니다. [링크] 버전 [MetaTrader 5] 진입점 계산 규칙 포지션 개설 진입점을 계산하려면 VR Cub 도구를 마지막 최고점에서 마지막 최저점까지 늘려야 합니다. 첫 번째 지점이 두 번째 지점보다 빠른 경우, 거래자는 막대가 중간선 위에서 마감될 때까지 기다립
"The Squeeze indicator attempts to identify periods of consolidation in a market. In general the market is either in a period of quiet consolidation or vertical price discovery. By identifying these calm periods, we have a better opportunity of getting into trades with the potential for larger moves. Once a market enters into a "squeeze," we watch the overall market momentum to help forecast the market direction and await a release of market energy." The StdATR Squeeze Channel combines standard
Mirror
Stanislav Korotky
This indicator predicts rate changes based on the chart display principle. It uses the idea that the price fluctuations consist of "action" and "reaction" phases, and the "reaction" is comparable and similar to the "action", so mirroring can be used to predict it. The indicator has three parameters: predict - the number of bars for prediction (24 by default); depth - the number of past bars that will be used as mirror points; for all depth mirroring points an MA is calculated and drawn on the ch
The Master Figures indicator analyzed the market for the most common chart patterns. The first pattern is called Pin bar . This pattern can rightly be considered one of the most widespread. This pattern looks like a candle with a small body and large tail (wick). Once you see it on the chart, open a position against the wick. It is better to use the resistance lines for closing. Master Figures shows this pattern in the form of circles. A position should be opened when a new candle appears after
BuySellAlert
Oleg Borisov
The BuySellAlert arrow indicator is developed based on the use of HMA, Laguerre, CCI, and ATR . The BuySellAlert arrow indicator: generates  entry points  for BUY and SELL  displays current profit ; displays  current spread. The profitability of the indicator is shown in the screenshot on the example of the GBPUSD pair Does not redraw and works on opening bar. Time frames - M1-M30. Recommended Time frames M5-M15. Setting ALARM - enable/disable the alarm; Push    - enable/disable Push notificatio
MovingFlatBreakout
Stanislav Korotky
This indicator monitors the market for a flat state and possible breakout. The flat state is detected as a predefined number of consecutive bars during which price fluctuates inside a small range. If one of the next bars closes outside the range, breakout is signaled. The indicator shows 3 lines: blue - upper bound of flat ranges AND consecutive breakout areas; red - lower bound of flat ranges AND consecutive breakout areas; yellow - center of flat ranges (NOT including breakout areas). When a b
Fibonacci SR Indicator
Martin Eshleman
3 (2)
Fibonacci SR Indicator This indicator creates support and resistance lines. This indicator is based on Fibonacci Retracement and Extension levels. It will consider many combinations of the Fibonacci levels and draw support/resistance lines based on these. This indicator uses tops and bottoms drawn by the ZigZag indicator in its calculations. The ZigZag can also be drawn on the chart, if necessary. The indicator considers many combinations of past reversal points and Fibonacci ratio levels, and
FREE
Cosmic Diviner X Planet
Olena Kondratenko
4 (2)
This unique multi-currency strategy simultaneously determines the strength of trends and market entry points, visualizing this using histograms on the chart. The indicator is optimally adapted for trading on the timeframes М5, М15, М30, Н1. For the convenience of users, the indicator renders the entry point (in the form of an arrow), recommended take profit levels (TP1, TP2 with text labels) and the recommended Stop Loss level. The take profit levels (TP1, TP2) are automatically calculated for
ZigZag Sniper
Natasha Diedericks
This indicator gives you a modified ZigZag, combined with a special algorithm. Great for scalping. Perfect for channel trading. Parameter TrendPeriod. Features alert functions.  How to use: Simply attach to any chart with default settings. Buy when the line crosses below the price, and blue arrow. Sell when the line crosses above the price, and red arrow. It helps to keep the audible alert set to true. Best results when checking two or more timeframes before entering trades. (See comment #1 for
The indicator displays the data of the Stochastic oscillator from a higher timeframe on the chart. The main and signal lines are displayed in a separate window. The stepped response is not smoothed. The indicator is useful for practicing "manual" forex trading strategies, which use the data from several screens with different timeframes of a single symbol. The indicator uses the settings that are identical to the standard ones, and a drop-down list for selecting the timeframe. Indicator Parame
이 제품의 구매자들이 또한 구매함
Gann Made Easy
Oleg Rodin
4.88 (99)
Gann Made Easy 는 mr.의 이론을 사용하여 최고의 거래 원칙을 기반으로 하는 전문적이고 사용하기 쉬운 Forex 거래 시스템입니다. W.D. 간. 이 표시기는 Stop Loss 및 Take Profit Levels를 포함하여 정확한 BUY 및 SELL 신호를 제공합니다. PUSH 알림을 사용하여 이동 중에도 거래할 수 있습니다. 구매 후 연락주세요! 내 거래 팁과 훌륭한 보너스 지표를 무료로 공유하겠습니다! 아마도 Gann 거래 방법에 대해 이미 여러 번 들었을 것입니다. 일반적으로 Gann의 이론은 초보자 거래자뿐만 아니라 이미 거래 경험이 있는 사람들에게도 매우 복잡한 것입니다. Gann의 거래 방식은 이론적으로 적용하기 쉽지 않기 때문입니다. 나는 그 지식을 연마하고 Forex 지표에 최고의 원칙을 적용하기 위해 몇 년을 보냈습니다. 표시기는 적용하기가 매우 쉽습니다. 차트에 첨부하고 간단한 거래 권장 사항을 따르기만 하면 됩니다. 지표는 지속적으로 시장 분석 작업
Gold Stuff
Vasiliy Strukov
4.9 (269)
Gold Stuff는 금을 위해 특별히 설계된 추세 지표이며 모든 금융 상품에서도 사용할 수 있습니다. 표시기가 다시 그려지지 않고 지연되지 않습니다. 권장 기간 H1. 표시기에서 완전 자동 Expert Advisor EA Gold Stuff를 작동합니다. 내 프로필에서 찾을 수 있습니다. 설정 및 개인 보너스를 받으려면 구매 후 즉시 저에게 연락하십시오!   강력한 지원 및 트렌드 스캐너 표시기의 무료 사본을 받으실 수 있습니다. 메시지를 보내주세요. 나!   설정 화살표 그리기 - 켜기 끄기. 차트에 화살표 그리기. 경고 - 가청 경고를 끕니다. 이메일 알림 - 켜기 끄기. 이메일 알림. Puch-notification - 켜기 끄기. 푸시 알림. 다음으로 색 영역을 조정합니다. Gold Stuff는 금을 위해 특별히 설계된 추세 지표이며 모든 금융 상품에서도 사용할 수 있습니다. 표시기가 다시 그려지지 않고 지연되지 않습니다. 권장 기간 H1. 표시기에서 완
Trend Punch
Mohamed Hassan
4.91 (23)
This indicator is unstoppable when combined with our other indicator called  Support & Resistance . After purchase, send us a message and you will get it   for  FREE as a BONUS! Introducing Trend Punch , the revolutionary forex trend indicator that will transform the way you trade! Trend Punch is uniquely designed to provide precise buy and sell arrows during strong market trends, making your trading decisions clearer and more confident. Whether you're trading major currency pairs or exotic sym
Apollo Pips PLUS SP
Oleg Rodin
5 (3)
제품을 구매하기 전에 아래 정보를 읽어보세요! Apollo Pips PLUS SP는 독특한 제품입니다! 모든 거래 지표에 액세스할 수 있는 새로운 "APOLLO PIPS" 지표와 "슈퍼 팩" 보너스를 받고 싶은 분들을 위한 것입니다! Apollo Pips PLUS SP 제품을 구매하면 실제로 Apollo Pips 표시기의 완전히 새로운 버전을 구매하게 됩니다. 이 버전의 지표에는 개선된 알고리즘과 사용하기 쉬운 매개변수가 있어 모든 시장 및 거래 스타일에서 지표를 사용할 수 있는 기회를 제공합니다. 이 제품의 구매자는 슈퍼 보너스로 다른 모든 표시기에 무료로 액세스할 수 있습니다! 내 모든 거래 도구에 액세스하고 싶었다면 이 제품이 당신에게 딱 맞습니다! :) 하지만 이것이 전부는 아닙니다! :) 이 제품의 모든 구매자는 또한 내 새로운 지표를 무료로 받을 자격이 있습니다! :) 새로운 거래 지표를 사용할 수 있게 되었는데, 귀하는 저의 특별한 "SUPER PACK" 평생 보너스
Scalper Inside PRO
Alexey Minkov
4.75 (60)
An exclusive indicator that utilizes an innovative algorithm to swiftly and accurately determine the market trend. The indicator automatically calculates opening, closing, and profit levels, providing detailed trading statistics. With these features, you can choose the most appropriate trading instrument for the current market conditions. Additionally, you can easily integrate your own arrow indicators into Scalper Inside Pro to quickly evaluate their statistics and profitability. Scalper Inside
Trend Pulse
Mohamed Hassan
5 (5)
Please contact me after purchase to immediately get your PDF strategy + documentation for Trend Pulse !  Official release price of $89  (2 /50 copies left). Next price is $199 . Introducing Trend Pulse , a unique and robust indicator capable of detecting bullish, bearish, and even ranging trends! Trend Pulse uses a special algorithm to filter out market noise with real precision. If the current symbol is moving sideways, Trend Pulse will send you a ranging signal, letting you know that it'
Atomic Analyst
Issam Kassas
5 (3)
우선적으로 언급할 점은이 거래 지표가 다시 그리지 않고 지연되지 않으며 이를 통해 수동 및 로봇 거래 모두에 이상적이라는 점입니다. 사용자 매뉴얼: 설정, 입력 및 전략. Atomic Analyst는 가격의 강도와 모멘텀을 활용하여 시장에서 더 나은 이점을 찾는 PA Price Action Indicator입니다. 고급 필터를 장착하여 잡음과 거짓 신호를 제거하고 거래 잠재력을 높이는 데 도움이 됩니다. 복잡한 지표의 다중 레이어를 사용하여 Atomic Analyst는 차트를 스캔하고 복잡한 수학적 계산을 간단한 신호와 색상으로 변환하여 초보 트레이더가 이해하고 일관된 거래 결정을 내릴 수 있도록합니다. "Atomic Analyst"는 새로운 및 경험이 풍부한 트레이더를위한 종합적인 거래 솔루션입니다. 프리미엄 지표와 최고 수준의 기능을 하나의 거래 전략에 결합하여 모든 종류의 트레이더에 대한 다재다능한 선택지가되었습니다. 인트라데이 거래 및 스캘핑 전략 : 빠르고 정확한
FX Power MT4 NG
Daniel Stein
5 (12)
모닝 브리핑 여기 mql5 와 텔레그램에서 FX Power MT4 NG 는 오랫동안 인기 있는 통화 강도 측정기인 FX Power의 차세대 버전입니다. 이 차세대 강도 측정기는 무엇을 제공합니까? 기존 FX Power에서 좋아했던 모든 것 PLUS GOLD/XAU 강도 분석 더욱 정밀한 계산 결과 개별 구성 가능한 분석 기간 더 나은 성능을 위한 사용자 정의 가능한 계산 한도 특별 멀티더 많은 것을보고 싶은 사람들을위한 특별한 다중 인스턴스 설정 모든 차트에서 좋아하는 색상을위한 끝없는 그래픽 설정 수많은 알림 옵션, 중요한 것을 다시는 놓치지 않도록 Windows 11 및 macOS 스타일의 둥근 모서리가 있는 새로운 디자인 마법처럼 움직이는 인디케이터 패널 FX 파워 키 특징 모든 주요 통화의 완전한 강세 이력 모든 시간대에 걸친 통화 강세 이력 모든 브로커 및 차트에서 고유 계산 결과 100% 신뢰할 수있는 실시간100 % 신뢰할 수있는 실시간 계산-> 다시 칠하지 않음
PZ Day Trading
PZ TRADING SLU
3.67 (3)
Effortless trading: non-repainting indicator for accurate price reversals Special Offer: Purchase now to receive free bonuses worth $189! (Read more for details) This indicator detects price reversals in a zig-zag fashion, using only price action analysis and a donchian channel. It has been specifically designed for short-term trading, without repainting or backpainting at all. It is a fantastic tool for shrewd traders aiming to increase the timing of their operations. [ Installation Guide | Up
Currency Strength Wizard
Oleg Rodin
4.92 (52)
통화 강도 마법사는 성공적인 거래를 위한 올인원 솔루션을 제공하는 매우 강력한 지표입니다. 표시기는 여러 시간 프레임의 모든 통화 데이터를 사용하여 이 또는 해당 외환 쌍의 힘을 계산합니다. 이 데이터는 특정 통화의 힘을 확인하는 데 사용할 수 있는 사용하기 쉬운 통화 지수 및 통화 전력선의 형태로 표시됩니다. 필요한 것은 거래하려는 차트에 표시기를 부착하는 것뿐입니다. 표시기는 거래하는 통화의 실제 강세를 보여줍니다. 지표는 또한 추세와 거래할 때 유리하게 사용할 수 있는 구매 및 판매 거래량 압력의 극한값을 보여줍니다. 지표는 또한 피보나치에 기반한 가능한 대상을 보여줍니다. 표시기는 PUSH 알림을 포함한 모든 유형의 알림을 제공합니다. 구매 후 연락주세요. 나는 당신과 거래 팁을 공유하고 당신에게 무료로 훌륭한 보너스 지표를 줄 것입니다! 나는 당신에게 행복하고 유익한 거래를 기원합니다!
TPSproTREND PrO
Roman Podpora
4.79 (19)
TPSpro TREND PRO는   시장을 자동으로 분석하여 추세와 각 변화에 대한 정보를 제공할 뿐만 아니라 다시 그리지 않고도 거래에 진입할 수 있는 신호를 제공하는 추세 지표입니다! 지표는 각 양초를 사용하여 개별적으로 분석합니다. 다른 임펄스를 언급합니다 - 업 또는 다운 임펄스. 통화, 암호화폐, 금속, 주식, 지수 거래의 정확한 진입점! 버전 MT5                   표시기에 대한 전체 설명       표시기   와 함께 사용하는 것이 좋습니다   -   RFI LEVELS 주요 기능: 렌더링 없이 정확한 입력 신호! 신호가 나타나면 관련성은 유지됩니다! 이는 신호를 제공한 후 변경하여 예금 자금 손실을 초래할 수 있는 다시 그리기 지표와의 중요한 차이점입니다. 이제 더 큰 확률과 정확도로 시장에 진입할 수 있습니다. 화살표가 나타난 후 목표에 도달(이익실현)하거나 반전 신호가 나타날 때까지 캔들을 색칠하는 기능도 있습니다. STOP LOSS / TAK
현재 20% 할인 ! 초보자 또는 전문가 트레이더를 위한 최고의 솔루션! 이 대시보드 소프트웨어는 28개의 통화 쌍에서 작동합니다. 2가지 주요 지표(Advanced Currency Strength 28 및 Advanced Currency Impulse)를 기반으로 합니다. 전체 Forex 시장에 대한 훌륭한 개요를 제공합니다. 고급 통화 강도 값, 통화 이동 속도 및 모든(9) 시간대의 28 Forex 쌍에 대한 신호를 보여줍니다. 추세 및/또는 스캘핑 기회를 정확히 파악하기 위해 차트의 단일 지표를 사용하여 전체 시장을 볼 수 있을 때 거래가 어떻게 개선될지 상상해 보십시오! 잠재적인 거래를 식별하고 확인하면서 강력한 통화와 약한 통화를 더욱 쉽게 식별할 수 있도록 이 지표에 기능을 내장했습니다. 이 표시기는 통화의 강세 또는 약세가 증가 또는 감소하는지 여부와 모든 시간대에서 수행되는 방식을 그래픽으로 보여줍니다. 추가된 새로운 기능은 현재 시장 조건 변화에 적
Advanced Currency Strength28 Indicator
Bernhard Schweigert
4.91 (667)
현재 26% 할인 초보자 또는 전문가 트레이더를 위한 최고의 솔루션! 이 지표는 우리가 독점 기능과 새로운 공식을 통합했기 때문에 독특하고 고품질이며 저렴한 거래 도구입니다. 단 하나의 차트로 28 Forex 쌍의 통화 강도를 읽을 수 있습니다! 새로운 추세 또는 스캘핑 기회의 정확한 트리거 포인트를 정확히 찾아낼 수 있기 때문에 거래가 어떻게 개선될지 상상해 보십시오. 사용 설명서: 여기를 클릭  https://www.mql5.com/en/blogs/post/697384 그것이 첫 번째, 원본입니다! 쓸모없는 지망생 클론을 사지 마십시오. 더 스페셜  강력한 통화 모멘텀을 보여주는 하위 창의 화살표 GAP가 거래를 안내합니다! 기본 또는 호가 통화가 과매도/과매도 영역(외부 시장 피보나치 수준)에 있을 때 개별 차트의 기본 창에 경고 표시가 나타납니다. 통화 강도가 외부 범위에서 떨어질 때 풀백/반전 경고. 교차 패턴의 특별 경고 추세를 빠르게 볼 수 있는
Gold Channel XAUUSD
Paulo Rocha
5 (2)
Gold Channel is a volatility-based indicator, developed with a specific timing algorithm for the XAUUSD pair, which consists of finding possible corrections in the market. This indicator shows two outer lines, an inner line (retracement line) and an arrow sign, where the theory of the channel is to help identify overbought and oversold conditions in the market. The market price will generally fall between the boundaries of the channel. If prices touch or move outside the channel it is a tra
Trend Screener
STE S.S.COMPANY
4.82 (92)
트렌드 표시기, 트렌드 트레이딩 및 필터링을 위한 획기적인 고유 솔루션, 하나의 도구 안에 내장된 모든 중요한 트렌드 기능! Forex, 상품, 암호 화폐, 지수 및 주식과 같은 모든 기호/도구에 사용할 수 있는 100% 다시 칠하지 않는 다중 시간 프레임 및 다중 통화 표시기입니다. Trend Screener는 차트에 점이 있는 화살표 추세 신호를 제공하는 효율적인 지표 추세 추종 지표입니다. 추세 분석기 표시기에서 사용할 수 있는 기능: 1. 트렌드 스캐너. 2. 최대 이익 분석이 있는 추세선. 3. 추세 통화 강도 측정기. 4. 경고가 있는 추세 반전 점. 5. 경고가 있는 강력한 추세 점. 6. 추세 화살표 Trend Screener Indicator가 있는 일일 분석 예, 일일 신호 성능...등은 여기에서 찾을 수 있습니다.   여기를 클릭하십시오. LIMITED TIME OFFER : Trend Screener Indicator는 50 $ 및 평생 동안만 사용할 수 있
- Real price is 80$ - 40% Discount ( It is 49$ now ) Contact me for instruction, any questions! Introduction The breakout and retest strategy is traded support and resistance levels. it involves price breaking through a previous level.  The break and retest strategy is designed to help traders do two main things, the first is to avoid false breakouts. Many false breakouts start with a candlestick that breaks out of a level but ends with an immediate candlestick that brings the price back into t
우선적으로, 이 거래 도구는 전문적인 거래에 이상적인 비-다시 그리기 및 지연되지 않는 지표입니다.  온라인 강좌, 사용자 매뉴얼 및 데모. 스마트 가격 액션 컨셉트 인디케이터는 신규 및 경험 많은 트레이더 모두에게 매우 강력한 도구입니다. Inner Circle Trader Analysis 및 Smart Money Concepts Trading Strategies와 같은 고급 거래 아이디어를 결합하여 20가지 이상의 유용한 지표를 하나로 결합합니다. 이 인디케이터는 스마트 머니 컨셉트에 중점을 두어 대형 기관의 거래 방식을 제공하고 이동을 예측하는 데 도움을 줍니다.  특히 유동성 분석에 뛰어나 기관이 어떻게 거래하는지 이해하는 데 도움을 줍니다. 시장 트렌드를 예측하고 가격 변동을 신중하게 분석하는 데 탁월합니다. 귀하의 거래를 기관 전략에 맞추어 시장의 동향에 대해 더 정확한 예측을 할 수 있습니다. 이 인디케이터는 시장 구조를 분석하고 중요한 주문 블록을 식별하고 다양한
PRO Renko System
Oleg Rodin
5 (26)
PRO Renko System 은 RENKO 차트 거래를 위해 특별히 고안된 매우 정확한 거래 시스템입니다. 이것은 다양한 거래 상품에 적용될 수있는 보편적 인 시스템입니다. 체계는 효과적으로 당신에게 정확한 반전 신호에 접근을 주는 소위 시장 소음을 중화합니다. 이 표시기는 사용하기가 매우 쉽고 신호 생성을 담당하는 매개 변수가 하나만 있습니다. 당신은 쉽게 당신의 선택의 어떤 무역 계기에 공구를 적응시킬 수 있고 renko 막대기의 크기. 나는 항상 당신이 내 소프트웨어로 수익성있게 거래 할 수 있도록 추가 지원을 제공 할 준비가되어 있습니다! 나는 당신에게 행복하고 수익성있는 거래를 기원합니다! 구매 후 저에게 연락하십시오! 내 렌코 차트 생성기를 보내드립니다. 또한 내 개인 권장 사항 및 시스템의 다른 모듈을 무료로 공유 할 것입니다!
Advanced Supply Demand
Bernhard Schweigert
4.9 (314)
현재 33% 할인! 초보자나 전문 트레이더를 위한 최고의 솔루션! 이 보조지표는 우리가 다수의 독창적 기능과 새로운 공식을 통합한 독특하고 고품질이며 저렴한 거래 도구입니다. 이 업데이트를 통해 이중 시간대를 표시할 수 있습니다. 더 높은 TF를 표시할 수 있을 뿐만 아니라 차트 TF와 더 높은 TF 모두를 표시할 수 있습니다: 중첩 영역 표시. 모든 Supply Demand 트레이더들이 좋아할 것입니다. :) 중요한 정보 공개 Advanced Supply Demand의 잠재력을 극대화하려면 다음을 방문하십시오. https://www.mql5.com/ko/blogs/post/720245   진입 또는 목표의 명확한 트리거 포인트를 정확히 찾아냄으로 해서 거래가 어떻게 개선될지 상상해 보십시오. 새로운 알고리즘을 기반으로 매수자와 매도자 간의 잠재적인 불균형을 훨씬 더 쉽게 분간할 수 있습니다. 왜냐하면 가장 강한 공급영역과 가장 강한 수요 영역과 과거에 어떻게 진행 되었는지를(이
NAM Order Blocks
NAM TECH GROUP, CORP.
5 (1)
MT4 Multi-timeframe Order Blocks detection indicator. Features - Fully customizable on chart control panel, provides complete interaction. - Hide and show control panel wherever you want. - Detect OBs on multiple timeframes. - Select OBs quantity to display. - Different OBs user interface. - Different filters on OBs. - OB proximity alert. - ADR High and Low lines. - Notification service (Screen alerts | Push notifications). Summary Order block is a market behavior that indicates order collection
Advanced Currency IMPULSE with ALERT
Bernhard Schweigert
4.91 (495)
현재 31% 할인!! 초보자 또는 전문가 트레이더를 위한 최고의 솔루션! 이 지표는 우리가 독점 기능과 비밀 공식을 통합했기 때문에 독특하고 고품질이며 저렴한 거래 도구입니다. 단 하나의 차트로 28개 통화 쌍 모두에 대한 경고를 제공합니다. 새로운 추세 또는 스캘핑 기회의 정확한 트리거 포인트를 정확히 찾아낼 수 있기 때문에 거래가 어떻게 개선될지 상상해 보십시오! 새로운 기본 알고리즘을 기반으로 구축되어 잠재적인 거래를 훨씬 더 쉽게 식별하고 확인할 수 있습니다. 이는 통화의 강세 또는 약세가 가속되는지 여부를 그래픽으로 표시하고 가속 속도를 측정하기 때문입니다. 자동차의 속도계처럼 생각하면 됩니다. 가속화할 때 Forex 시장에서 동일한 일이 분명히 더 빠르게 발생합니다. 즉, 반대 방향으로 가속화되는 통화를 페어링하면 잠재적으로 수익성 있는 거래를 식별한 것입니다. 통화 모멘텀의 수직선과 화살표가 거래를 안내합니다! 역동적인 Market Fibonacci 23
Enigmera
Ivan Stefanov
5 (4)
에니메라: 시장의 핵심 https://www.enigmera.com 소개 이 지표 및 트레이딩 시스템은 금융 시장에 대한 놀라운 접근 방식입니다. 에니메라는 프랙탈 주기를 사용하여 지지선과 저항선을 정확하게 계산합니다. 진정한 축적 단계를 보여주고 방향과 목표를 제시합니다.  추세에 있든 조정에 있든 작동하는 시스템입니다.  어떻게 작동하나요? 에니메라는 지지선/저항선, 목표선, 편차선의 세 가지 라인으로 구성됩니다. 이 시스템은 과거 데이터를 현재와 미래로 추정하는 일반적인 시장 지표와 달리 현재에 대한 완전한 그림을 제공합니다. 지지선 위에 있으면 실제 지지를 의미하고 저항선 위에 있으면 실제 저항을 의미합니다. 레벨이 깨지면 추세의 변화를 나타냅니다. 다시 그리지 않습니다. 시장이 지속적으로 진화함에 따라 에니메라는 평가 도구를 조정하여 전략을 정기적으로 수정합니다.   이를 통해 모든 시나리오를 철저히 평가할 수 있습니다. 이 시장 지표의 고유성은 분명하며 그 기
PZ Trend Trading
PZ TRADING SLU
4.8 (5)
Capture every opportunity: your go-to indicator for profitable trend trading Special Offer: Purchase now to receive free bonuses worth $159! (Read more for details) Trend Trading is an indicator designed to profit as much as possible from trends taking place in the market, by timing pullbacks and breakouts. It finds trading opportunities by analyzing what the price is doing during established trends. [ Installation Guide | Update Guide | Troubleshooting | FAQ | All Products ] Trade financial
TPSpro RFI Levels
Roman Podpora
4.83 (24)
Reversal First Impulse levels (RFI)    INSTRUCTIONS        RUS       -       ENG              R ecommended to use with an indicator   -   TPSpro  TREND PRO -  Version MT5 A key element in trading is zones or levels from which decisions to buy or sell a trading instrument are made. Despite attempts by major players to conceal their presence in the market, they inevitably leave traces. Our task was to learn how to identify these traces and interpret them correctly. Main functions: Displaying activ
Clear Breakout
Martin Alejandro Bamonte
5 (1)
"Breakout Buy-Sell" 지표는 다양한 시장 세션(도쿄, 런던, 뉴욕) 동안 가격 돌파를 기반으로 매수 및 매도 기회를 식별하고 강조하도록 설계되었습니다. 이 지표는 트레이더가 매수 및 매도 영역뿐만 아니라 이익 실현(TP) 및 손절매(SL) 수준을 명확하게 시각화하는 데 도움이 됩니다. 사용 전략 이 지표는 다음과 같이 사용할 수 있습니다: 초기 설정 : 시장 세션을 선택하고 GMT 오프셋을 조정합니다. 시장 시각화 : 각 세션 시작 시 그려지는 돌파 상자를 관찰합니다. 이러한 상자는 기간의 최고점과 최저점을 나타냅니다. 매수 및 매도 신호 : 상자의 최고점을 초과하는 돌파는 매수 신호로 간주됩니다. 최저점을 밑도는 돌파는 매도 신호로 간주됩니다. 위험 관리 : TP1, TP2, TP3 및 SL 수준을 사용하여 포지션을 관리합니다. TP 수준은 다양한 수익 목표를 위해 설계되었으며 SL은 불리한 움직임으로부터 보호를 보장합니다. 적용 전략 이 지표를 최대한 활용하기 위해
Order Block Hunter
Noha Mohamed Fathy Younes Badr
5 (2)
Order block hunter indicator is the best indicator for  hunt the order blocks that area where there has been a large concentration of limit orders waiting to be executed Order blocks are identified on a chart by observing previous price action and looking for areas where the price experienced significant movement or sudden changes in direction .This indicator does that for you by using very complicated codes and helps you to take the best areas To buy and sell because it make marks at the best a
RelicusRoad Pro
Relicus LLC
4.73 (141)
이제 $ 147 (몇 가지 업데이트 후 $ 499 증가) - 무제한 계정 (PCS 또는 MACS) RelicusRoad 사용 설명서 + 교육 비디오 + 비공개 Discord 그룹 액세스 + VIP 상태 시장을 보는 새로운 방법 RelicusRoad는 외환, 선물, 암호화폐, 주식 및 지수에 대한 세계에서 가장 강력한 거래 지표로서 거래자에게 수익성을 유지하는 데 필요한 모든 정보와 도구를 제공합니다. 우리는 초보자부터 고급까지 모든 거래자가 성공할 수 있도록 기술적 분석 및 거래 계획을 제공합니다. 미래 시장을 예측할 수 있는 충분한 정보를 제공하는 핵심 거래 지표입니다. 우리는 차트에서 말이 안 되는 여러 지표 대신 완전한 솔루션을 믿습니다. 타의 추종을 불허하는 매우 정확한 신호, 화살표 + 가격 조치 정보를 표시하는 올인원 표시기입니다. 강력한 AI를 기반으로 하는 RelicusRoad는 누락된 정보와 도구를 제공하여 교육하고 성공적인 트레이더인 트레이딩 전문
M1 Arrow
Oleg Rodin
4.73 (15)
시장의 두 가지 기본 원칙에 기반한 일중 전략. 알고리즘은 추가 필터를 사용하여 거래량 및 가격 파동 분석을 기반으로 합니다. 지표의 지능형 알고리즘은 두 가지 시장 요인이 하나로 결합될 때만 신호를 제공합니다. 지표는 더 높은 시간 프레임의 데이터를 사용하여 M1 차트에서 특정 범위의 파도를 계산합니다. 그리고 파동을 확인하기 위해 지표는 볼륨 분석을 사용합니다. 이 표시기는 준비된 거래 시스템입니다. 트레이더가 필요로 하는 모든 것은 신호를 따르는 것입니다. 또한 지표는 자신의 거래 시스템의 기초가 될 수 있습니다. 거래는 분 차트에서만 수행됩니다. 지표가 MTF 원리를 사용한다는 사실에도 불구하고 지표 알고리즘은 가능한 한 안정적입니다. 구매 후 반드시 저에게 편지를 보내주세요! 내 거래 설정 및 권장 사항을 공유하겠습니다!
IX Power MT4
Daniel Stein
5 (6)
IX Power는 마침내 FX Power의 탁월한 정밀도를 외환이 아닌 기호에도 적용했습니다. 좋아하는 지수, 주식, 원자재, ETF, 심지어 암호화폐까지 단기, 중기, 장기 추세의 강도를 정확하게 파악할 수 있습니다. 단말기가 제공하는 모든 것을 분석할 수 있습니다. 사용해 보고 트레이딩 타이밍이 크게 향상되는 것을 경험해 보세요. IX Power 주요 특징 단말기에서 사용 가능한 모든 거래 심볼에 대해 100% 정확한 비재도장 계산 결과 제공 사전 구성 및 추가적으로 개별 구성 가능한 강도 분석 기간의 드롭다운 선택 가능 이메일, 메시지, 모바일 알림을 통한 다양한 알림 옵션 제공 EA 요청을 위한 액세스 가능한 버퍼 더 나은 성능을 위한 사용자 지정 가능한 계산 한도 더 많은 것을 보고 싶은 사용자를 위한 특별 다중 인스턴스 설정 모든 차트에서 좋아하는 색상을 위한 무한한 그래픽 설정 가능 Windows 11 및 macOS 스타일의 둥근 모서리를 가
Break and Retest
Mohamed Hassan
4.17 (18)
This Indicator only places quality trades when the market is really in your favor with a clear break and retest. Patience is key with this price action strategy! If you want more alert signals per day, you increase the number next to the parameter called: Support & Resistance Sensitivity.  After many months of hard work and dedication, we are extremely proud to present you our  Break and Retest price action indicator created from scratch. One of the most complex indicators that we made with ove
제작자의 제품 더 보기
HFTHacker
Thomas Bradley Butler
신호: 내 프로필의 HFT Hacker 링크 *테스트 및 사용 전에 EA를 최적화하세요. 최적화된 경우에만 구매하세요. 이는 최적화 방법을 알고 있으며 자신의 장점으로 수익을 창출하기를 원하는 트레이더를 위한 것입니다. 위험 매개변수는 귀하가 설정합니다. 선택한 경우 효과가 없는 거래에 대한 중지로 높은 승률을 얻을 수 있습니다. 장수 위험을 줄입니다. 이는 모든 계정에서 작동하며 위험 관리 도구입니다. 모든 댓글, 설명 및 블로그를 읽으십시오. 최상의 결과를 얻는 방법: https://www.mql5.com/en/blogs/post/754836 MT4 버전: https://www.mql5.com/en/market/product/73834 마이크로초 하나하나가 중요한 초단타매매(HFT)의 분주한 세계에는 HFT 해커라고만 알려진 신비한 인물이 살고 있었습니다. 빛처럼 빠른 반사 신경과 시장의 복잡한 알고리즘을 탐색하는 놀라운 능력을 갖춘 HFT 해커는 트레이더들 사이에서
Black Gold M1
Thomas Bradley Butler
OPTIMIZE BEFORE BACKTEST AND USE Trade crude oil with this EA.  No EA turns hundreds into millions in a year or 2, This is a lie if presented this way.  Black Gold trades Brent Crude on 1 min charts.  It uses RSI, moving averages and directional indicators.  Try it out, load it onto the tester if you have the history and ability to trade Brent crude.    Adjust and optimize to get the most out of the expert advisor
NeuroScalper
Thomas Bradley Butler
5 (2)
업데이트! 화살표가 100 및 200 레벨에 추가되었습니다. 이 지표는 극단적인 접근에 정확하고 주로 1분 기간 동안 매수 포지션을 지원합니다. 다른 시간 프레임을 사용할 수 있지만 수준이 다릅니다. 더 나은 오실레이터이며 차이점을 확인하기 위해 다른 오실레이터와 비교합니다. 신경망 개념을 사용한 데이 트레이드. 이 지표는 기본 형태의 신경망을 사용하여 구매 및 판매 신호를 생성합니다. 1분 차트에서 지표를 사용하십시오. 표시기는 다시 칠하지 않습니다. 1분 차트 또는 다른 레벨을 사용하는 다른 차트를 사용하여 테스터에서 다운로드하여 실행하고 거래를 분석하여 직접 확인하십시오. 시장을 스캘핑할 수 있는 많은 기회. 더 높은 시간 프레임에 사용할 수 있지만 수준은 재량에 따라 변경해야 합니다. 더 높은 시간 프레임은 더 높은 범위를 갖습니다. 이 모델에서 고려해야 할 개념 및 사항: 다중 표시기가 사용되고 가중치가 적용되며 최대 및 최소에 대한 2개의 데이터 포인트가
HFTHackerMT5
Thomas Bradley Butler
5 (1)
신호: 내 프로필의 HFT Hacker 링크 *테스트 및 사용 전에 EA를 최적화하세요. 최적화된 경우에만 구매하세요. 이는 최적화 방법을 알고 있으며 자신의 장점으로 수익을 창출하기를 원하는 트레이더를 위한 것입니다. 위험 매개변수는 귀하가 설정합니다. 선택한 경우 효과가 없는 거래에 대한 중지로 높은 승률을 얻을 수 있습니다. 장수 위험을 줄입니다. 이는 모든 계정에서 작동하며 위험 관리 도구입니다. 모든 댓글, 설명 및 블로그를 읽으십시오. 최상의 결과를 얻는 방법: https://www.mql5.com/en/blogs/post/754836 MT4 버전: https://www.mql5.com/en/market/product/73834 마이크로초 하나하나가 중요한 초단타매매(HFT)의 분주한 세계에는 HFT 해커라고만 알려진 신비한 인물이 살고 있었습니다. 빛처럼 빠른 반사 신경과 시장의 복잡한 알고리즘을 탐색하는 놀라운 능력을 갖춘 HFT 해커는 트레이더들 사이에서
Bitcoin M5
Thomas Bradley Butler
테스트하고 사용하기 전에 EA를 최적화하세요. Bitcoin M5는 5분 차트에서 BTC/USD를 거래하기 위한 것입니다. SL 및 TP는 50000으로 시작해야 합니다. 사용하기 전에 최적화하세요. 거래 전략은 Bollinger Bands 및 Envelopes 지표를 사용하여 거래합니다. 가격이 밴드를 돌파하는 돌파 지점을 포착하고 가격이 한계선을 넘으면 종료하는 트레이딩입니다. 모든 거래에는 고정된 랏 금액이 사용되며 SL과 TP가 있습니다. EA는 로직에서 마틴게일이나 헤징을 사용하지 않습니다. 테스트하고 사용하기 전에 EA를 최적화하세요. Bitcoin M5는 5분 차트에서 BTC/USD를 거래하기 위한 것입니다. SL 및 TP는 50000으로 시작해야 합니다. 사용하기 전에 최적화하세요. 거래 전략은 Bollinger Bands 및 Envelopes 지표를 사용하여 거래합니다. 가격이 밴드를 돌파하는 돌파 지점을 포착하고 가격이 한계선을 넘으면 종
VolumeDayTrader
Thomas Bradley Butler
주식(CFD)에 대해서만 DAYTRADING. 거래에는 작업이 필요합니다. 모든 항목과 종료를 알려주는 바로 가기나 표시기는 없습니다. 이익은 마음의 상태에서 옵니다. 지표는 자금 관리 및 성공 심리학과 함께 사용되는 도구입니다. 볼륨 프로파일에서 불균형을 찾으십시오. 거래 가격 볼륨 불균형. 많은 불균형이 마감 및 공개 및 뉴스에서 발생합니다. 주식의 구매자 대 판매자를 참조하십시오. 5분에서 1시간 동안 사용하여 누가 가격을 통제하고 가격의 불균형을 찾을 수 있는지 확인합니다. 더 큰 주식은 15분 이상입니다. 이전 막대의 숫자를 보려면 색상 볼륨 막대 위로 마우스를 가져갑니다. 현재 막대 볼륨은 상단 모서리에 기록됩니다. 거래량의 불균형을 찾아 가격이 한동안 어떤 방향으로 갈지 확인하십시오. 최상의 결과를 위해 지배적인 경향을 따르십시오 추세가 발전하면 추세를 거래하십시오. 트레일링 스톱을 사용하고 큰 볼륨 반전 불균형을 주시하십시오.
MarketMakerMT5
Thomas Bradley Butler
수요 공급 거래를 자동화합니다. 시장을 만드십시오. 이 EA는 모두가 판매하고 모방하는 인기 있는 수요 공급 지표에서 영감을 받아 만들어졌습니다. EA는 거래와 헤징을 계속하여 시장을 만듭니다. 비 헤징 계정에서도 거래할 수 있습니다. 위험을 평가하고 시간 프레임, 로트 크기, 헤징 기능을 사용해야 합니다. 나는 한 번에 여러 쌍을 껐다가 켜고 한 달에 걸쳐 그것을 거래했습니다. 시스템의 개념: EA는 수요와 공급 수준을 거래합니다. 레벨이 변경되므로 EA는 계속해서 새로운 레벨을 거래할 것입니다. 더 낮은 로트를 가진 많은 쌍으로 분배하는 것은 시스템의 기능입니다. 꾸준한 이득을 유지하면서 큰 하락은 피해야 합니다. SL을 사용할 수 있지만 이것이 옵션이 될 수 있도록 내가 설명한 헷지된 측면입니다. 많은 쌍에 대해 작은 로트에서 얻는 손실은 4%이며 이것은 SL이 없는 것입니다. 더 큰 로트는 6%를 보여주고 있습니다. 따라서 크기가 작을수록 보수적이고 크면 공격적입
NeuroScalperMT5
Thomas Bradley Butler
MT4 indicator version https://www.mql5.com/en/market/product/72342 I personally use this indicator to scalp.  Accurate for accessing extremes and supports for buy positions primarily for 1 minute time frames.  Other time frames can be used but the levels are different. Its a better oscillator and compare with others to see the difference.          Day trade using neuro network concepts.  This indicator uses elementary forms of neuro networks to generate signals to buy and sell. Use the indicat
Pin Bar Scalper
Thomas Bradley Butler
OPTMIZE EA BEFORE BACKTEST AND USE. Pin Bar Scalper scalps pin bars and momentum on 5 minute charts on the EUR/USD.  Optimize the parameters to get the best  out of the EA.  Pin bars are popular candlesticks that show that the price has been taken over by the bulls or bears. The inputs are based around the size of the pin bars in %, which are 3 different ones.  Wicks and body are the calculations within the parameter.  Test file in comments for example only.  Trade the dates _
ForexReversal
Thomas Bradley Butler
4 (1)
인내심은 스트레스 없는 스캘핑의 핵심입니다. 화살표가 200 이동 평균을 통과하는 것을 볼 때 거래하고 이동 평균 필터가 없는 마지막 스윙 포인트에서 확장하거나 추세를 만드십시오. 1분 시간 프레임에 적합하며 일중 움직임을 포착합니다. 후행 정지를 사용하여 쉽게 20핍을 가져오거나 더 큰 추세에 더 오래 머물 수 있습니다. 이 표시기에서 실제로 큰 거래의 사진에 있는 예를 보십시오. 1분의 시간 프레임이 가장 효과적입니다. 트렌드를 보려면 축소하십시오. 화살표는 다시 칠하거나 다시 계산하지 않습니다. 1분 시간 프레임에 연결하고 거래를 연구하고 전략에 사용할 수 있는지 확인하십시오. 나 규칙: 파란색 구매 레드 판매 옆 기간을 피하십시오 거래량이 많을 때 거래하고 모멘텀을 거래하십시오 손절매 사용 인내심은 스트레스 없는 스캘핑의 핵심입니다. 화살표가 200 이동 평균을 통과하는 것을 볼 때 거래하고 이동 평균 필터가 없는 마지막 스윙 포인트에서 확장하거나 추세를 만드
Level 2 Trading
Thomas Bradley Butler
스마트 볼륨 추적기와 결합: https://www.mql5.com/en/market/product/116650 발자국 차트와 결합: https://www.mql5.com/en/market/product/94153 지역 내 거래와 결합: https://www.mql5.com/en/market/product/110194 VOLUM DAY TRADER와 결합: h https://www.mql5.com/en/market/product/72498 주문서와 결합: https://www.mql5.com/en/market/product/102247 레벨 2 트레이딩은 MetaTrader 차트에서 현재 매수 및 매도 거래량을 시각화하는 데 도움이 되는 지표입니다. 이는 시장에서 구매 및 판매 활동을 빠르게 파악하여 압력이 가해지는 위치를 이해할 수 있는 것과 같습니다. 그것이 보여주는 것 입찰 및 매도 금액: 표시기는 매수(매수) 및 매도(매도) 거래량을 보여주는 라벨을 표시
GoldBuyBackScalper
Thomas Bradley Butler
4 (1)
이 표시는 XAU/USD, 1분 차트 전용입니다. 모든 쌍에는 고유한 특성과 가격 변동이 있습니다. 이 지표로 V자형 반전을 거래하십시오. 두피는 후행 정지를 사용하여 매수하고 뉴스는 더 극단적이고 갑작스러운 매도를 유발할 수 있으므로 뉴스를 피합니다. 백테스트에서 1분 시간 프레임에 연결하고 반전 매수를 확인합니다. 표시기는 다시 그리거나 다시 계산하지 않습니다. 활성 시간에만 거래 이 표시는 XAU/USD, 1분 차트 전용입니다. 모든 쌍에는 고유한 특성과 가격 변동이 있습니다. 이 지표로 V자형 반전을 거래하십시오. 두피는 후행 정지를 사용하여 매수하고 뉴스는 더 극단적이고 갑작스러운 매도를 유발할 수 있으므로 뉴스를 피합니다. 백테스트에서 1분 시간 프레임에 연결하고 반전 매수를 확인합니다. 표시기는 다시 그리거나 다시 계산하지 않습니다. 활성 시간에만 거래
TrueSupplyandDemand
Thomas Bradley Butler
This is based on short term strength or weakness and not on moving averages.  Moving averages are used for filter only. Trade supply and demand with arrows. Supply and demand breakouts and strength of the buyers or sellers .  Don't trade buy arrow to sell arrow.  Trade the strength with trendlines or moving averages and use stops.  The arrow can have some strong moves.  Trade on all time frames.  Try it out in the back tester. The pips can be made with this indicator, follow the arrows and mak
ScalpingMaster
Thomas Bradley Butler
Master scalping with this indicator.  Trade on any time frame for scalps on buy or sells.  Follow trends using a 200 moving average and stops and targets.  Use with your own system.  This indicator can give pips if following it correctly.  Stick to rules and pick up pips daily.  Use as entries in a trend, scalp for a few pips or exit on opposite signal.  Best to follow higher time frame trends. Indicator doesn't repaint or recalculate. Rules: Don't trade overnight, only trade during active sessi
DayTradeKing
Thomas Bradley Butler
This indicator is good for small time frames like 1 and 5 minutes and made for day trading. The indicator never repaints or recalculates. The indicator works is for trading swing points in day trading, following bulls or bears.  Its a simple to use, non cluttered indicator with a high success rate.  This indicator works well to capture ranges.  All indicators come with limitations and no indicator or system is always accurate. Use money management for long term trading success.   Place in backte
DTKGold
Thomas Bradley Butler
This is the DayTradeKing for gold on a 1 minute time frame.  It is a different calculation for the range. Use a 200 period moving average as a filter.  Always use stops and avoid news, wait for more conformation.  This looks to capture intraday ranges. Put it in the back tester on 1 minute to see the price action and how it works. Trade with trend Use filter Use stops Alerts are added for pop ups and sound. 
SuperArrowScalper
Thomas Bradley Butler
Trade trends with the Super Scalper Use on all time frames and assets it is  designed for scalping trends. Works good on small time frames for day trading.  The arrows are easy to follow.  This is a simple no repaint/no recalculate arrow indicator to follow trends with.  Use in conjunction with your own system or use moving averages.  Always use stops just below or above the last swing point or your own money management system The indicator comes with push notifications, sound alerts and email
Levels Trading
Thomas Bradley Butler
This indicator is a simple stripped down version of any advanced support and resistance indicator.  All the support and resistance indicators work from a number of bars that have developed over time. Get rid of clutter and confusing levels.  Find levels according to a number of bars. Look at days, session, numbers of hours, periods of consolidation.  Watch levels develop and use as breakout points, or areas of buyers and sellers.  Features and things to consider This indicator is for a frame of
ForexReversalEA
Thomas Bradley Butler
https://www.mql5.com/en/market/product/57345 이 EA는 Forex Reversal 지표를 기반으로 합니다. 시스템을 수동으로 거래하고 싶다면 지표를 다운로드하여 사용해 보십시오. EA는 추세를 따르고 그에 따라 포지션을 열 것입니다. 결과는 더 낮은 드로다운으로 안정적인 이득을 보여주지만 백 테스터, 옵티마이저 및 시간 프레임에서 실험하여 무엇이 작동하는지 확인하십시오. 표시된 모든 결과는 가상입니다. 참고: 이것은 마틴게일이나 그리드가 아닙니다. 지표에 헤지 기능이 있습니다. 이 EA에는 다음과 같은 기능이 있으며 위험에 따라 변경하십시오. EA는 무료 마진에 따라 추가하고 매개변수에 따라 구매 및 판매합니다. 입력을 통해 위험을 제어합니다. inp 5는 판매 inp 7은 구매 고정 스톱 로트 고정 이익실현   여유 마진의 %
MarketMaker
Thomas Bradley Butler
수요 공급 거래를 자동화합니다. 시장을 만드십시오. 이 EA는 모두가 판매하고 모방하는 인기 있는 수요 공급 지표에서 영감을 받아 만들어졌습니다. EA는 거래와 헤징을 계속하여 시장을 만듭니다. 비 헤징 계정에서도 거래할 수 있습니다. 위험을 평가하고 시간 프레임, 로트 크기, 헤징 기능을 사용해야 합니다. 나는 한 번에 여러 쌍을 껐다가 켜고 한 달에 걸쳐 그것을 거래했습니다. 시스템의 개념: EA는 수요와 공급 수준을 거래합니다. EA가 계속해서 새로운 레벨을 거래할 수 있도록 레벨이 변경됩니다. 더 낮은 로트를 가진 많은 쌍 사이에 분배하는 것은 시스템의 기능입니다. 꾸준한 이득을 유지하면서 큰 하락은 피해야 합니다. SL을 사용할 수 있지만 이것이 옵션이 될 수 있도록 내가 설명한 헷지된 측면입니다. 많은 쌍에 대해 작은 로트에서 얻는 손실은 4%이며 이것은 SL이 없는 것입니다. 더 큰 로트는 6%를 보여주고 있습니다. 따라서 크기가 작을수록 보수적이며 크
Top Trader
Thomas Bradley Butler
Top Trader Indicator This is an arrow reversal indicator. This is with deviations and arrows.  Trade a blue arrow for buy and trade a red arrow for sell.  Change the time period and the deviations of the bands.  This is similar to others but these arrows don't repaint.  Load in back tester and study which periods and deviations work the best.  It works on all time frames.  15 min to 1 hr would give good results for take profits.  Try according to your own risk management.
Quant Bot
Thomas Bradley Butler
Quant Bot은 EUR/USD에 대한 1시간 프레임의 추세 거래를 위한 것입니다. 설정된 파일은 없지만 다른 쌍을 사용하는 경우 최적화가 필요할 수 있습니다. 봇 정보: 그것은 유전자 생성을 사용하고 ATR을 사용하여 거래합니다. 커브 핏을 방지하기 위해 앞으로 걷기 기간이 사용되었습니다. EA는 모든 거래에 스탑을 사용합니다. 자금 관리는 잔액의 %로 확장됩니다. 백셋 기간은 2003-2020년이고 앞으로 나아가는 기간은 2020-2022년입니다. (사진 참조). Quant Bot은 EUR/USD에 대한 1시간 프레임의 추세 거래를 위한 것입니다. 설정된 파일은 없지만 다른 쌍을 사용하는 경우 최적화가 필요할 수 있습니다. 봇 정보: 그것은 유전자 생성을 사용하고 ATR을 사용하여 거래합니다. 커브 핏을 방지하기 위해 앞으로 걷기 기간이 사용되었습니다. EA는 모든 거래에 스탑을 사용합니다. 자금 관리는 잔액의 %로 확장됩니다. 백셋 기간은 2003-2020
Crypto Net
Thomas Bradley Butler
Crypto Net은 1시간 단위로 BTCUSD를 거래하기 위한 것입니다. 그것은 전략을 발전시키기 위해 유전자 진화를 사용합니다. 이 EA 거래 추세는 ATR 및 Ichimoku 지표를 따릅니다. 이것은 구축되었으며 Monte Carlo 및 Walk Forward를 포함한 다양한 테스트를 통과했습니다. 입력: 최소 위험인 계정 비율입니다. 최대 로트 수 거래 중단 시간 다른 것은 변경되지 않습니다. Crypto Net은 1시간 단위로 BTCUSD를 거래하기 위한 것입니다. 그것은 전략을 발전시키기 위해 유전자 진화를 사용합니다. 이 EA 거래 추세는 ATR 및 Ichimoku 지표를 따릅니다. 이것은 구축되었으며 Monte Carlo 및 Walk Forward를 포함한 다양한 테스트를 통과했습니다. 입력: 최소 위험인 계정 비율입니다. 최대 로트 수 거래 중단 시간 다른 것은 변경되지 않습니다.
Golden Standard
Thomas Bradley Butler
XAU/USD의 경우 무작위 생성과 추세에 따른 거래를 사용하는 안정적인 거래 시스템입니다. Expert는 XAU/USD 1시간 프레임에서 과적합을 피하기 위해 Monte Carlo 시뮬레이션과 함께 최적화 기간을 완료한 후 품질 데이터로 다시 테스트했습니다. 손절매와 이익실현이 사용됩니다. EA에는 여러 구성이 있으며 거래할 로트 수를 파악하는 것 외에는 할 일이 없습니다. 특징: 잔액 복합 이익의 백분율을 사용합니다. XAU/USD의 경우 무작위 생성과 추세에 따른 거래를 사용하는 안정적인 거래 시스템입니다. Expert는 XAU/USD 1시간 프레임에서 과적합을 피하기 위해 Monte Carlo 시뮬레이션과 함께 최적화 기간을 완료한 후 품질 데이터로 다시 테스트했습니다. 손절매와 이익실현이 사용됩니다. EA에는 여러 구성이 있으며 거래할 로트 수를 파악하는 것 외에는 할 일이 없습니다. 특징: 잔액 복합 이익의 백분율을 사용합니다.
PropTrader
Thomas Bradley Butler
*사용하기 전에 EA를 최적화하세요* EUR/USD에 최적화된 외환 트레이딩 전략 EA(Expert Advisor)를 통해 1~2년 내에 상당한 부를 달성한다는 것은 비현실적인 주장입니다. 백테스팅과 실제 거래는 EUR/USD 통화 쌍에 중점을 둡니다. 이 전략 정보: 이는 우리 전략의 초기 반복을 나타내며 추가 발전 가능성이 있습니다. 100% 품질 데이터로 엄격한 테스트를 거쳤으며 MT4 오류가 없습니다. 이 전략은 추세 추종의 논리적 원리에 따라 운영됩니다. 추세가 강세일 때 EA는 후행 정지를 전개하고 그 반대의 경우도 마찬가지입니다. 본질적으로 이는 간단한 추세 추종 접근 방식입니다. 주요 장점 및 고려 사항: 쉬운 설정: 기본 설정을 그대로 유지하고 원하는 대로 로트 크기만 수정합니다. 위험 관리: 이 전략에는 마틴게일이나 헤징이 사용되지 않습니다. 위험 완화: 각 거래에는 ATR(Average True Range)에 따라 결정되는 추적 중지 및 이익
Down Under
Thomas Bradley Butler
Down Under는 1시간 프레임에 AUD/USD 쌍을 거래합니다. 이 EA는 ATR과 OHLC를 거래합니다. 이 시간 프레임에 이 쌍에 대해 형식이 지정됩니다. 혼합은 분과 함께 사용됩니다. 로트 크기 및 최대. 로트 크기. 잔액의 백분율은 거래에서 승리하면 복리됩니다. 잔고가 변동함에 따라 로트 규모도 변동합니다. 설정: mm 위험 % mm 로트 최대 부지 변경할 사항이 없습니다. 이것은 마틴게일이나 헤징 기능이 없습니다. 변경할 다른 기능은 거래하는 경우 AUD/USD의 CFD입니다. 브로커 플랫폼에서 이를 소수로 변경합니다. 위험 면책 조항 선물, 옵션 및 통화 거래는 모두 잠재적인 보상이 크지만 잠재적인 위험도 큽니다. 이러한 시장에 투자하려면 위험을 인식하고 기꺼이 감수해야 합니다.
Cable Trader
Thomas Bradley Butler
GBP/USD 1 hr. 이 EA는 모멘텀과 세션을 거래합니다. 이것은 고정된 로트 구성요소를 가지고 있으며 개발함에 따라 TP를 계속 수정할 것입니다. 설정: 로트 크기 변경할 사항이 없습니다. 이것은 마틴게일이나 헤징 기능이 없습니다. 변경할 다른 기능은 거래하는 경우 GBP/USD의 CFD입니다. 브로커 플랫폼에서 이를 소수로 변경합니다. 위험 면책 조항 선물, 옵션 및 통화 거래는 모두 잠재적인 보상이 크지만 잠재적인 위험도 큽니다. 이러한 시장에 투자하려면 위험을 인식하고 기꺼이 감수해야 합니다. Cable Trade는 1시간 동안 GBP/USD 쌍을 거래합니다. 라이브 거래 전 데모. 이 EA는 모멘텀과 세션을 거래합니다. 이것은 고정된 로트 구성요소를 가지고 있으며 개발함에 따라 TP를 계속 수정할 것입니다. 설정: 로트 크기 변경할 사항이 없습니다. 이것은 마틴게일이나 헤징 기능이 없습니다. 변경할 다른
Euclidean
Thomas Bradley Butler
Euclidean은 제가 8년 전에 생각해낸 독특한 거래 알고리즘입니다. 이 EA는 이 시스템의 일부입니다. 닫힌 시스템으로 작동합니다. EA는 추세를 포착하기에 각도가 정확할 때 매수를 시작합니다. 정지 손실은 각도에서 10%입니다. 간단합니다. 입력: $1,000에 대한 로트 1 마이크로 로트의 잔액 비율 볼륨 상위 로트 = 최대 로트 수량 이익 수준 = 기본값은 50핍입니다. 방법 및 고려해야 할 사항: 손절매가 내장되어 10%의 각도에서 가격에 따라 거래됩니다. 이익실현은 50핍으로 설정되지만 원하는 금액일 수 있습니다. 1 5분과 같은 짧은 시간에 거래하십시오. 백 테스터에서 이것을 테스트하는 데 오류가 없었습니다. 플랫폼 및 브로커마다 데이터가 다르므로 테스트할 데이터 다운로드를 확인하십시오. Forex 거래에 대한 위험 고지 마진으로 외환 거래는 높은 수준의 위험을 수반하며 모든 투자자에게 적합하지 않을 수 있습니다. 과거의 성과가 미래의 결과
Pip Scalper
Thomas Bradley Butler
모두를 위한 지표 Pip Scalper는 스캘핑 트렌드입니다. 이 표시기로 추세를 더 오래 유지하십시오. 모든 시간 프레임과 자산에서 작동합니다. 이 도구로 매일 핍을 얻으십시오. 200 이동 평균을 사용하여 거래를 필터링하십시오. 더 짧은 기간을 권장합니다. 데이 트레이딩에 사용합니다. 정보 및 사용 방법: Pips Scalper는 장기 추세 거래를 기반으로 합니다. 파란색으로 구매 레드에 판매 200 이동 평균을 필터로 사용하고 활성 기간 동안 거래하십시오. Pip Scalper는 스캘핑 트렌드입니다. 이 표시기로 추세를 더 오래 유지하십시오. 모든 시간 프레임과 자산에서 작동합니다. 이 도구로 매일 핍을 얻으십시오. 200 이동 평균을 사용하여 거래를 필터링하십시오. 더 짧은 기간을 권장합니다. 데이 트레이딩에 사용합니다. 정보 및 사용 방법: Pips Scalper는 장기 추세 거래를 기반으로 합니다. 파란색으로 구매 레드에 판매 200 이동 평
Order Flow Trader
Thomas Bradley Butler
Just a simplified way of observing the volume.  It shows the buy flow against the sell flow.  See the volume coming in and trade with the money.  Visualize the trend rising or falling and trade according to the imbalance in volume.  Use for scalping and trend trading.  Trade by volume coming in. FOOTPRINT CHART:  https://www.mql5.com/en/market/product/94153 Order Book:  https://www.mql5.com/en/market/product/102247 EA Based:  https://www.mql5.com/en/market/product/82585 Note: Works in real
필터:
리뷰 없음
리뷰 답변
버전 1.10 2022.05.19
Added Fib levels