• 미리보기
  • 리뷰 (9)
  • 코멘트 (8)
  • 새 소식

Ticks Bars

4

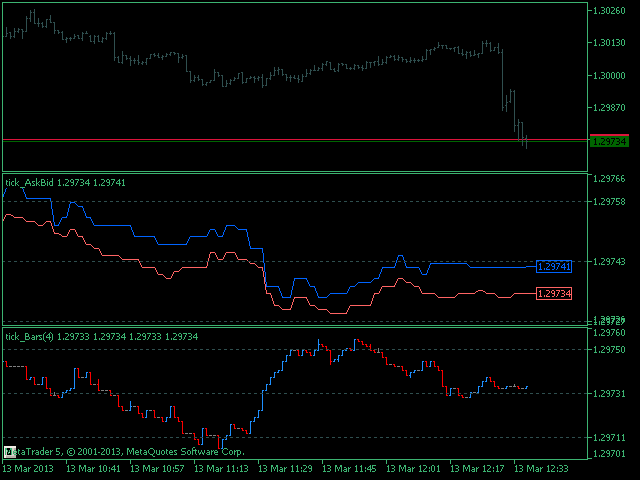
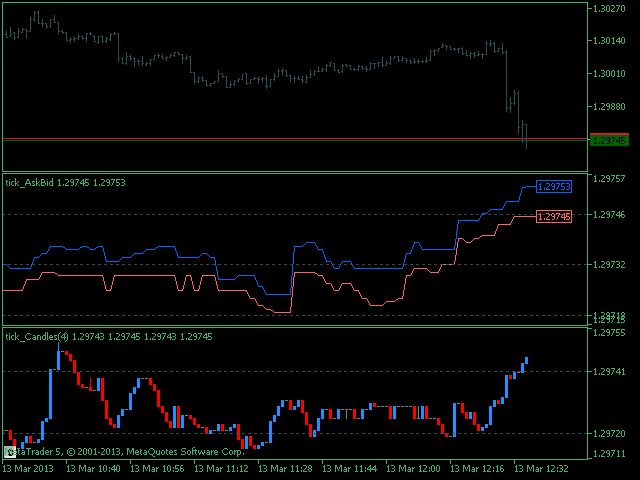
This tick indicator draws synthetic bars/candlesticks that contain a definite number of ticks.

Parameters:

  • option prices - price option. It can be Bid, Ask or (Ask+Bid)/2.
  • the number of ticks to identify Bar - number of ticks that form OHLC.
  • price levels count - number of displayed price levels (no levels are displayed if set to 0 or a lower value).
  • calculated bar - number of bars on the chart.

Buffer indexes: 0 - OPEN, 1 - HIGH, 2 - LOW, 3 - CLOSE.

리뷰 9
jaffer wilson
4354
jaffer wilson 2019.11.29 11:38 
 

This works like charm... :) Wow.

추천 제품
Ticks
Andrej Nikitin
4 (6)
A simple tick indicator of Bid and Ask prices. The period separator (1 minute) is displayed as a histogram. Parameters Show Bid Line - show/hide the Bid line; Show Ask Line - show/hide the Ask line; Show Labels - show/hide the last price values.
FREE
The indicator draws a normal chart by coloring it in colors based on prices calculated by the Heiken Ashi indicator algorithm. That is, the shape of the candles does not change. In fact, this is the same Heiken Ashi that does not distort the price chart. Then there will be a drawing of a cat, because there is nothing more to write about the indicator. .                                                       
FREE
Volume By Color RSJ
JETINVEST
4.5 (4)
This simple indicator paints with a darker color on the volume bar when the quantity traded is above the average of select number of periods of the volume itself, highlighting the moments when there was a large volume of deals above the average. It is also possible to use a configuration of four colors where the color tone shows a candle volume strength. The indicator defaults to the simple average of 20 periods, but it is possible to change to other types of averages and periods. If you like
FREE
DALA Forecast
Grigorii Matsnev
About the indicator: DALA Forecast is a universal tool for predicting the dynamics of time series of any nature. For prediction, modified methods of nonlinear dynamics analysis are used, on the basis of which a predictive model is built using machine learning methods.  To get the trial version of the indicator, you can contact me in private messages. How to use the indicator: Apply the indicator to your chosen financial instrument or indicator with the settings you need. The prediction will b
FREE
如果产品有任何问题或者您需要在此产品上添加功能,请联系我 Contact/message me if you encounter any issue using the product or need extra feature to add on the base version. Floating Highest Lowest MT5 provides you an intuitive and user-friendly method to monitor the floating highest (profit) and lowest (loss) that all your trades together ever arrive. For example, I opened 3 orders, which arrived at $4.71 floating profit when trade following trend. Later when the trend is against me, these 3 orders arrive $30 in loss, and
FREE
AngryVolumes
Stanislav Korotky
This indicator emulates volume delta (buy trades vs sell trades) based on per candle volume and candle shape (direction, size of body and wicks). Artificially separated buy and sell volumes then accumulated for specified number of bars. The indicator shows a histogram of volume delta per bar, as well as a sum of the delta for the given period. What is more important, the indicator allows you to combine current symbol quotes/volumes with quotes/volumes of other related symbols (futures, indices,
FREE
Value Chart Candlesticks
Flavio Javier Jarabeck
4.7 (10)
The idea of a Value Chart indicator was presented in the very good book I read back in 2020 , " Dynamic Trading Indicators: Winning with Value Charts and Price Action Profile ", from the authors Mark Helweg and David Stendahl. The idea is simple and the result is pure genius: Present candlestick Price analysis in a detrended way! HOW TO READ THIS INDICATOR Look for Overbought and Oversold levels. Of course, you will need to test the settings a lot to find the "correct" one for your approach.
FREE
Seconds Charts Demo
Aleksandr Goryachev
5 (1)
Micro  Demo  ******************* Секундные графики в Meta Trader 5 ********************** Более точного инструмента для входа в сделку вы не найдёте. Платная полная версия:  Micro "Second charts" В демоверсии секундные периоды сменяются случайным образом через случайные интервалы времени. Отсутствует автоматическая настройка периодов бесплатных индикаторов.   Входные параметры: Displayed bars - отображаемые бары Step of price levels, pp, 0-off - шаг отрисовки ценовых уровней, пункты Scale
FREE
This is a regression tree indicator for MT4/MT5. This indicator classificate nodes on the time period so that the deviation becomes smaller, and displays regression line and channel for each node. It's free! Attached CartDemo.ex4 and CartDemo.ex5 is a Demo version and has the following limitations: Method is RandomForest only Maximum number of bars is 200 Maximum number of trees is 2 Maximum tree depth is 2 Calculated waste lines are shown Not display correlation coefficients Fu
FREE
Color Bollinger Bands
Jinsong Zhang
5 (2)
。。。。。。。。。。。。。。。。。。。。。。。。。。。。。。。。。。。。。。。。。。。 This indicator is based on Bollinger Bands indicator. It helps user clearly know the Band is expand or contract. The method of use is the same as the traditional Brin channel index. Users can use different color areas to distribute forest channel indicators in expansion or contraction stage. -------------------------------------------------------------------------------------------
FREE
Smart Depth Of Market
Evgeny Shevtsov
4.24 (21)
The indicator displays the orders book, as well as increases its depth, remembering the location of orders that have gone beyond the current "window" view. Indicator capability Display the levels of open positions. Simulation of placing/cancelling/editing pending orders directly in the displayed orders book. Indicator features The orders book display works only on those trading symbols for which it is broadcast by the broker. To reset the information about the rows that were recorded in the
FREE
Waves Sizer
Flavio Javier Jarabeck
3.67 (6)
Wyckoff fans, enjoy! Ideally to be used with the Weis Waves indicator, but it can be easily used alone, the Waves Sizer puts the range (in resulting Price movement) done by the Price on its market swings. You can control how accurate or loose will be the swings. This tool is very helpful for visually know how much the Price has traveled in your Timeframe. This way you can confront this level of effort with the resulting Volume, etc... Weis Waves indicator: https://www.mql5.com/en/market/pro
FREE
This indicator is based on the Bollinger Bands indicator. It helps the user identifying whether to buy or sell. It comes with an alert that will sound whenever a new signal appears. It also features an email facility. Your email address and SMTP Server settings should be specified in the settings window of the "Mailbox" tab in your MetaTrader 5. Blue arrow up = Buy. Red arrow down = Sell. Line = Trailing Stop. You can use one of my Trailing Stop products that automatically move the Stop Loss and
FREE
Panic Meter limited
Dmitriy Gurenko
3.5 (2)
The indicator measures the frequency of incoming ticks to analyze the market activity. Bullish and bearish ticks are analyzed separately, informing about the currently predominant market sentiment. According to observations, an increase in the frequency of ticks (panic) indicates the beginning of strong price changes, and an increase in the frequency of ticks in a particular direction not only accompanies a price change in this direction, but also often anticipates it. The indicator is indispens
FREE
Follow The Line MT5
Oliver Gideon Amofa Appiah
4.42 (31)
This indicator obeys the popular maxim that: "THE TREND IS YOUR FRIEND" It paints a GREEN line for BUY and also paints a RED line for SELL. (you can change the colors). It gives alarms and alerts of all kinds. IT DOES NOT REPAINT and can be used for all currency pairs and timeframes. Yes, as easy and simple as that. Even a newbie can use it to make great and reliable trades. NB: For best results, get my other premium indicators for more powerful and reliable signals. Get them here: https://www.m
FREE
ROC Oscillator Breakout SW
Mohamed Hassan Mohamed Hassan Alsherbiny
When prices breakout resistance levels are combined with Rate of Change oscillator "ROC" breaks out its historical resistance levels then higher chances emerges to record farther prices. It's strongly encouraged to confirm price breakout with oscillator breakout since they have comparable effects to price breaking support and resistance levels; certainly short trades will have the same perception. Concept is based on find swing levels which based on number of bars by each side to confirm peak or
FREE
MiniCandles
Kiyoshi Mizu Miyabi Nori
5 (1)
This indicator is a very simple indicator that draws candlesticks on a chart. However, it is possible to draw not only on the main chart but also on several sub-charts. In addition,it is possible to draw different symbols and timeframes from the main chart. features. 1. any symbols 2. any timeframes 3. two candle type(normal and heikin ashi) 4. many candle colors(intersection with ma_1) 5. pivot line (ver1.2) In case of positive candle,    FULL     : change color if low is over ma_1    PARTIAL :
FREE
Cumulative Delta MT5
Evgeny Shevtsov
4.48 (61)
The indicator analyzes the volume scale and splits it into two components - seller volumes and buyer volumes, and also calculates the delta and cumulative delta. The indicator does not flicker or redraw, its calculation and plotting are performed fairly quickly, while using the data from the smaller (relative to the current) periods. The indicator operation modes can be switched using the Mode input variable: Buy - display only the buyer volumes. Sell - display only the seller volumes. BuySell -
FREE
This indicator is based on the Heiken Ashi indicator. It helps the user identifying whether to buy or sell. It comes with an alert that will sound whenever a new signal appears. It also features an email facility. Your email address and SMTP Server settings should be specified in the settings window of the "Mailbox" tab in your MetaTrader 5. Blue arrow up = Buy. Red arrow down = Sell. Line = Trailing Stop. You can use one of my Trailing Stop products that automatically move the Stop Loss and inc
FREE
RCCMA is a general moving average indicator that works with ReviewCandleChart. Original is "Custom Moving Average" provided by MetaQuotes Software Corp. Based on that source code, I corresponded to ReviewCandleChart . Advantages When ReviewCandleChart is ON, no line will be displayed on the right side from the vertical reference line. When ReviewCandleChart is ON and you press a key such as "Z" or "X" Following that, the MA is drawn. When ReviewCandleChart is OFF, the same drawing as the origi
FREE
Panda Display Spread
Brian P Cusack
5 (2)
This indicator displays the spread Simple and easy to use and fully customisable: View as Pips or Pipettes Chart symbol can be hidden Text display can be changed Change color and text styles Add or hide a decimal point Spacing options between inputs Default screen positions Screen position inputs How to use 1. Simply use the default settings; or 2. Choose to show pips or pipettes; 3. Choose to display symbol, text or decimal; 4. Choose where to place it on the screen; 5. Save settings or save
FREE
Expansoes M
Marcus Vinicius Da Silva Miranda
The M Extensions are variations of the Golden Ratio (Fibonacci Sequence). It is the World's first technique developed for Candle Projections. Advantages: Easy to plot. Candle anchoring; High and accurate precision as support and resistance; Excellent Risk x Return ratio; Works in any timeframe; Works in any asset / market.   The M Extensions are classified into: M0: Zero point (starting candle) RC: Initial candle control region M1: Extension region 1 M2: Extension region 2 M3: Extension r
FREE
This indicator will mirror the assets in use in another metatrader, being able to choose the timeframe and a template. This is the Metatrader 5 Client, it needs the Metatrader 4 or 5 Server versions: Metatrader 4 Mirror Chart Server:   https://www.mql5.com/en/market/product/88644 Metatrader 5 Mirror Chart Server: https://www.mql5.com/en/market/product/88652 Details of how it works in the video.
FREE
Color
Sergey Ponomarev
Индикатор Color служит помощником для начинающего или опытного трейдера для выявления краткосрочного тренда или глобального в зависимости выбранного тайм фрейма, а так же для выявления флетовой зоны, которая очень хорошо видна в местах длинной проторговки в одной зоне индикатора Color. Индикатор не перерисовывается на завершённой свечи , но в моменте появления свечи и образования сигнала, может быть отклонён в прорисовке. Особенности работы индикатора Хорошо определяет тренд на волатильных инстр
FREE
Trendline mt5 indicator
David Muriithi
3 (1)
Are you tired of drawing trendlines every time you're analyzing charts? Or perhaps you would like more consistency in your technical analysis. Then this is for you. This indicator will draw trend lines automatically when dropped on a chart. How it works Works similar to standard deviation channel found on mt4 and mt5. It has 2 parameters: 1. Starting Bar 2. Number of bars for calculation The   starting bar   is the bar which drawing of the trend lines will begin, while the   number of bars for c
FREE
Rainbow MT5
Jamal El Alama
4.33 (3)
Description : Rainbow MT5 is a technical indicator based on Moving Average with period 34 and very easy to use. When price crosses above MA and MA changes color to green, then this is a signal to buy. When price crosses below MA and MA changes color to red, then this is a signal to sell. The Expert advisor ( Rainbow EA MT5 ) based on Rainbow MT5 indicator is now available here . MT4 version is available here .
FREE
BoxInside MT5
Evgeny Shevtsov
5 (4)
This indicator calculates the volume profile and places labels that correspond to the VAH, VAL and POC levels, for each candle individually. Indicator operation features The indicator works on the timeframes from M3 to MN, but it uses the history data of smaller periods: M1 - for periods from M3 to H1, M5 - for periods from H2 to H12, M30 - for the D1 period, H4 - for the W1 period, D1 - for the MN period. The color and location of the VAL, VAH and POC labels on the current candle are consider
FREE
Smart Grid MT5
Dmitry Kotov
4.67 (6)
Smart Grid MT5 automatically recognizes any symbol, period and scale of the chart and marks it up accordingly. It is possible to mark up the chart by trading sessions. The grid consists of the two main line types. Vertical lines There are two visualization methods: Standard - the lines are divided into three types, separating: Small time period. Medium time period. Large time period. Trading Session - the lines are divided into groups (a total of ten). Each group has two lines: the first is re
FREE
헤이킨 아시 MT5 인디케이터 헤이킨 아시 MT5 인디케이터는 표준 가격 데이터를 더 부드럽고 추세 중심의 캔들스틱으로 변환하여 시장 트렌드와 잠재적인 역전 지점을 더 쉽게 식별할 수 있도록 하는 강력한 도구입니다. 주요 특징: 명확한 트렌드 식별: 다른 캔들 색상으로 상승 추세와 하락 추세를 시각적으로 구분합니다. 노이즈 감소: 가격 변동을 필터링하여 시장의 주요 움직임을 더 명확하게 표시합니다. 조기 트렌드 감지: 표준 차트에서 트렌드 변화가 명확해지기 전에 잠재적인 트렌드 변화를 예측합니다. 다용도성: 독립적으로 사용하거나 다른 기술적 지표와 함께 종합적인 분석에 사용할 수 있습니다. 사용자 정의 설정: 인디케이터를 특정 거래 선호도와 전략에 맞게 조정할 수 있습니다. 장점: 트렌드를 식별하고 잠재적인 진입 및 청산 지점을 파악하는 능력을 향상시킵니다. 시장 노이즈의 영향을 줄이고 중요한 가격 변동에 집중합니다. 시장 역학에 대한 더 명확한 이해를 바탕으로 더 나은 거래 결정
FREE
Market Profile 3 ForexArby com
Hussien Abdeltwab Hussien Ryad
3.92 (13)
Market Profile 3 MetaTrader 5 indicator  version 4.70— is a classic Market Profile implementation that can show the price density over time, outlining the most important price levels, value area, and control value of a given trading session. This indicator can be attached to timeframes between M1 and D1 and will show the Market Profile for daily, weekly, monthly, or even intraday sessions. Lower timeframes offer higher precision. Higher timeframes are recommended for better visibility. It is als
FREE
이 제품의 구매자들이 또한 구매함
Atomic Analyst MT5
Issam Kassas
4.79 (19)
우선적으로 언급할 점은이 거래 지표가 다시 그리지 않고 지연되지 않으며 이를 통해 수동 및 로봇 거래 모두에 이상적이라는 점입니다. 사용자 매뉴얼: 설정, 입력 및 전략. Atomic Analyst는 가격의 강도와 모멘텀을 활용하여 시장에서 더 나은 이점을 찾는 PA Price Action Indicator입니다. 고급 필터를 장착하여 잡음과 거짓 신호를 제거하고 거래 잠재력을 높이는 데 도움이 됩니다. 복잡한 지표의 다중 레이어를 사용하여 Atomic Analyst는 차트를 스캔하고 복잡한 수학적 계산을 간단한 신호와 색상으로 변환하여 초보 트레이더가 이해하고 일관된 거래 결정을 내릴 수 있도록합니다. "Atomic Analyst"는 새로운 및 경험이 풍부한 트레이더를위한 종합적인 거래 솔루션입니다. 프리미엄 지표와 최고 수준의 기능을 하나의 거래 전략에 결합하여 모든 종류의 트레이더에 대한 다재다능한 선택지가되었습니다. 인트라데이 거래 및 스캘핑 전략 : 빠르고 정확한
Atbot
Zaha Feiz
4.96 (28)
AtBot: 작동 방식 및 사용 방법 ### 작동 방식 MT5 플랫폼용 "AtBot" 지표는 기술 분석 도구의 조합을 사용하여 매수 및 매도 신호를 생성합니다. 01:37 단순 이동 평균(SMA), 지수 이동 평균(EMA), 평균 진폭 범위(ATR) 지수를 통합하여 거래 기회를 식별합니다. 또한 Heikin Ashi 캔들을 사용하여 신호의 정확성을 향상시킬 수 있습니다. 구매 후 리뷰를 남기면 특별 보너스 선물을 받게 됩니다. ### 주요 기능: - 비재표시: 신호는 플로팅 후 변경되지 않습니다. - 비재작성: 신호는 일관되며 변경되지 않습니다. - 지연 없음: 지연 없이 시기적절한 신호를 제공합니다. - 다양한 시간대: 거래 전략에 맞게 모든 시간대에서 사용할 수 있습니다. ### 운영 단계: #### 입력 및 설정: - firstkey (TrendValue): 추세 감지의 민감도를 조정합니다. - Secondkey (SignalValue): 매수/매도 신호 생성의 민감도를 정의
우선 이 거래 시스템이 리페인팅, 리드로잉 및 레이그 인디케이터가 아니라는 점을 강조하는 것이 중요합니다. 이는 수동 및 로봇 거래 모두에 이상적인 것으로 만듭니다. 온라인 강좌, 설명서 및 프리셋 다운로드. "스마트 트렌드 트레이딩 시스템 MT5"은 새로운 및 경험이 풍부한 트레이더를 위해 맞춤형으로 제작된 종합적인 거래 솔루션입니다. 10개 이상의 프리미엄 인디케이터를 결합하고 7개 이상의 견고한 거래 전략을 특징으로 하여 다양한 시장 조건에 대한 다목적 선택이 가능합니다. 트렌드 추종 전략: 효과적인 트렌드 추이를 타기 위한 정확한 진입 및 손절 관리를 제공합니다. 반전 전략: 잠재적인 트렌드 반전을 식별하여 트레이더가 범위 시장을 활용할 수 있게 합니다. 스캘핑 전략: 빠르고 정확한 데이 트레이딩 및 단기 거래를 위해 설계되었습니다. 안정성: 모든 인디케이터가 리페인팅, 리드로잉 및 레이그가 아니므로 신뢰할 수 있는 신호를 보장합니다. 맞춤화: 개별 거래 선호도를 고려한 맞춤
Gold Stuff mt5
Vasiliy Strukov
4.9 (185)
Gold Stuff mt5는 금을 위해 특별히 설계된 추세 지표이며 모든 금융 상품에서도 사용할 수 있습니다. 표시기가 다시 그려지지 않고 지연되지 않습니다. 권장 기간 H1. 설정 및 개인 보너스를 받으려면 구매 후 즉시 저에게 연락하십시오!     강력한 지원 및 트렌드 스캐너 표시기의 무료 사본을 받으실 수 있습니다. 메시지를 보내주세요. 나!   설정 화살표 그리기 - 켜기 끄기. 차트에 화살표 그리기. 경고 - 가청 경고를 끕니다. 이메일 알림 - 켜기 끄기. 이메일 알림. Puch-notification - 켜기 끄기. 푸시 알림. 다음으로 색 영역을 조정합니다. Gold Stuff mt5는 금을 위해 특별히 설계된 추세 지표이며 모든 금융 상품에서도 사용할 수 있습니다. 표시기가 다시 그려지지 않고 지연되지 않습니다. 권장 기간 H1. 설정 및 개인 보너스를 받으려면 구매 후 즉시 저에게 연락하십시오!   설정 화살표 그리기 - 켜기 끄기. 차트에
TPSproTREND PrO MT5
Roman Podpora
4.89 (9)
TPSpro TREND PRO  - is a trend indicator that automatically analyzes the market and provides information about the trend and each of its changes, as well as giving signals for entering trades without redrawing! The indicator uses each candle, analyzing them separately. referring to different impulses - up or down impulse. Exact entry points into transactions for currencies, crypto, metals, stocks, indices!  Version MT4               DETAILED DESCRIPTION               R ecommended to use with an
TPSpro RFI Levels MT5
Roman Podpora
4.67 (9)
Reversal First Impulse levels (RFI)      INSTRUCTIONS        RUS       -       ENG              R ecommended to use with an indicator   -   TPSpro  TREND PRO -  Version MT4                 A key element in trading is zones or levels from which decisions to buy or sell a trading instrument are made. Despite attempts by major players to conceal their presence in the market, they inevitably leave traces. Our task was to learn how to identify these traces and interpret them correctly. Main functi
Entry Points Pro for MT5
Yury Orlov
4.56 (163)
다시 색을 칠하지 않고 거래에 진입할 수 있는 정확한 신호를 제공하는 MT5용 지표입니다. 외환, 암호화폐, 금속, 주식, 지수 등 모든 금융 자산에 적용할 수 있습니다. 매우 정확한 추정값을 제공하고 매수와 매도의 가장 좋은 시점을 알려줍니다. 하나의 시그널로 수익을 내는 지표의 예와 함께 비디오 (6:22)시청하십시오! 대부분의 거래자는 Entry Points Pro 지표의 도움으로 첫 거래 주 동안 트레이딩 결과를 개선합니다. 저희의   Telegram Group 을 구독하세요! Entry Points Pro 지표의 좋은점. 재도색이 없는 진입 신호 신호가 나타나고 확인되면(시그널 캔들이 완성된 경우) 신호는 더 이상 사라지지 않습니다. 여타 보조지표의 경우 신호를 표시한 다음 제거되기 때문에 큰 재정적 손실로 이어집니다. 오류 없는 거래 게시 알고리즘을 통해 트레이드(진입 또는 청산)를 할 이상적인 순간을 찾을 수 있으며, 이를 통해 이를 사용하는 모든 거래자의
우선적으로, 이 거래 도구는 전문적인 거래에 이상적인 비-다시 그리기 및 지연되지 않는 지표입니다.  온라인 강좌, 사용자 매뉴얼 및 데모. 스마트 가격 액션 컨셉트 인디케이터는 신규 및 경험 많은 트레이더 모두에게 매우 강력한 도구입니다. Inner Circle Trader Analysis 및 Smart Money Concepts Trading Strategies와 같은 고급 거래 아이디어를 결합하여 20가지 이상의 유용한 지표를 하나로 결합합니다. 이 인디케이터는 스마트 머니 컨셉트에 중점을 두어 대형 기관의 거래 방식을 제공하고 이동을 예측하는 데 도움을 줍니다.  특히 유동성 분석에 뛰어나 기관이 어떻게 거래하는지 이해하는 데 도움을 줍니다. 시장 트렌드를 예측하고 가격 변동을 신중하게 분석하는 데 탁월합니다. 귀하의 거래를 기관 전략에 맞추어 시장의 동향에 대해 더 정확한 예측을 할 수 있습니다. 이 인디케이터는 시장 구조를 분석하고 중요한 주문 블록을 식별하
Quantum Trend Sniper
Bogdan Ion Puscasu
4.92 (48)
소개       Quantum Trend Sniper Indicator는   추세 반전을 식별하고 거래하는 방식을 변화시키는 획기적인 MQL5 지표입니다! 13년 이상의 거래 경험을 가진 숙련된 트레이더 팀이 개발한       Quantum Trend Sniper 표시기       매우 높은 정확도로 추세 반전을 식별하는 혁신적인 방법으로 거래 여정을 새로운 차원으로 끌어올리도록 설계되었습니다. ***Quantum Trend Sniper Indicator를 구입하면 Quantum Breakout Indicator를 무료로 받을 수 있습니다!*** Quantum Trend Sniper Indicator는 추세 반전을 식별하고 세 가지 이익실현 수준을 제안할 때 경고, 신호 화살표를 제공합니다. 초보자 거래자와 전문 거래자 모두에게 적합합니다. Quantum EA 채널:       여기를 클릭하세요 MT4 버전:       여기를 클릭하세요
Trend Screener Pro MT5
STE S.S.COMPANY
4.88 (67)
트렌드 표시기, 트렌드 트레이딩 및 필터링을 위한 획기적인 고유 솔루션, 하나의 도구 안에 내장된 모든 중요한 트렌드 기능! Forex, 상품, 암호 화폐, 지수 및 주식과 같은 모든 기호/도구에 사용할 수 있는 100% 다시 칠하지 않는 다중 시간 프레임 및 다중 통화 표시기입니다. Trend Screener는 차트에 점이 있는 화살표 추세 신호를 제공하는 효율적인 지표 추세 추종 지표입니다. 추세 분석기 표시기에서 사용할 수 있는 기능: 1. 트렌드 스캐너. 2. 최대 이익 분석이 있는 추세선. 3. 추세 통화 강도 측정기. 4. 경고가 있는 추세 반전 점. 5. 경고가 있는 강력한 추세 점. 6. 추세 화살표 Trend Screener Indicator가 있는 일일 분석 예, 일일 신호 성능...등은 여기에서 찾을 수 있습니다. 여기를 클릭하십시오. LIMITED TIME OFFER : Trend Screener Indicator는 50$ 및 평생 동안만 사용할 수 있습니다
FX Power MT5 NG
Daniel Stein
5 (6)
모닝 브리핑 여기 mql5 와 텔레그램에서 FX Power MT5 NG 는 오랫동안 인기 있는 통화 강도 측정기인 FX Power의 차세대 버전입니다. 이 차세대 강도 측정기는 무엇을 제공합니까? 기존 FX Power에서 좋아했던 모든 것 PLUS GOLD/XAU 강도 분석 더욱 정밀한 계산 결과 개별 구성 가능한 분석 기간 더 나은 성능을 위한 사용자 정의 가능한 계산 한도 특별 멀티더 많은 것을보고 싶은 사람들을위한 특별한 다중 인스턴스 설정 모든 차트에서 좋아하는 색상을위한 끝없는 그래픽 설정 수많은 알림 옵션, 중요한 것을 다시는 놓치지 않도록 Windows 11 및 macOS 스타일의 둥근 모서리가 있는 새로운 디자인 마법처럼 움직이는 인디케이터 패널 FX 파워 키 특징 모든 주요 통화의 완전한 강세 이력 모든 시간대에 걸친 통화 강세 이력 모든 브로커 및 차트에서 고유 계산 결과 100% 신뢰할 수있는 실시간100 % 신뢰할 수있는 실시간 계산-> 다시 칠하지 않음
FX Volume MT5
Daniel Stein
4.94 (17)
모닝 브리핑을 통해 세부 정보와 스크린샷으로 매일 시장 업데이트를 받으세요 여기 mql5 및 텔레그램에서 FX 거래량은 브로커의 관점에서 시장 심리에 대한 실제 통찰력을 제공하는 최초이자 유일한 거래량 지표입니다. 브로커와 같은 기관 시장 참여자가 외환 시장에서 어떤 포지션을 취하고 있는지에 대한 훌륭한 통찰력을 COT 보고서보다 훨씬 빠르게 제공합니다. 차트에서 이 정보를 직접 확인하는 것은 트레이딩의 진정한 판도를 바꾸고 획기적인 솔루션입니다. 다음과 같은 고유한 시장 데이터 인사이트의 이점 비율 는 통화의 매수/매도 포지션 비율을 백분율로 표시 비율 변화 는 선택한 기간 내 매수 비율과 비율 변화를 표시 총 거래량 는 해당 통화의 총 거래량(롱 및 숏)을 로트 단위로 보여줍니다 Volumes Long 는 해당 통화의 모든 롱 포지션의 거래량을 보여줍니다 Volumes Short 는 해당 통화의 모든 숏 포지션의 거래량을 보여줍니다 Net Long 는 순 롱 포지션의 거래량
IX Power MT5
Daniel Stein
4.17 (6)
IX Power는   마침내 FX Power의 탁월한 정밀도를 외환이 아닌 기호에도 적용했습니다. 좋아하는 지수, 주식, 원자재, ETF, 심지어 암호화폐까지 단기, 중기, 장기 추세의 강도를 정확하게 파악할 수 있습니다. 단말기가 제공하는   모든 것을 분석할   수 있습니다. 사용해 보고 트레이딩   타이밍이 크게 향상되는   것을 경험해 보세요. IX Power 주요 특징 단말기에서 사용 가능한 모든 거래 심볼에 대해 100% 정확한 비재도장 계산 결과 제공 사전 구성 및 추가적으로 개별 구성 가능한 강도 분석 기간의 드롭다운 선택 가능 이메일, 메시지, 모바일 알림을 통한 다양한 알림 옵션 제공 EA 요청을 위한 액세스 가능한 버퍼 더 나은 성능을 위한 사용자 지정 가능한 계산 한도 더 많은 것을 보고 싶은 사용자를 위한 특별 다중 인스턴스 설정 모든 차트에서 좋아하는 색상을 위한 무한한 그래픽 설정 가능 Windows 11 및 macOS 스타일의 둥
XQ Indicator MetaTrader 5
Marzena Maria Szmit
3.5 (2)
Step into the realm of Forex trading with confidence and precision using XQ, a cutting-edge Forex indicator designed to elevate your trading game to unprecedented heights. Whether you're a seasoned trader or just stepping into the world of currency exchange, XQ Forex Indicator empowers you with the insights and signals needed to make informed trading decisions. The signal conditions are a combination of three indicators, and XQ Forex Indicator only display  medium and long-term trends . The ind
Easy Buy Sell Signal Alert
Franck Martin
4.86 (7)
Easy By Sell is a market indicator for opening and closing positions. It becomes easy to track market entries with alerts. It indicates trend reversal points when a price reaches extreme values ​​and the most favorable time to enter the market. it is as effective as a Fibonacci to find a level but it uses different tools such as an algorithm based on ATR indicators and Stochastic Oscillator. You can modify these two parameters as you wish to adapt the settings to the desired period. My othe
이 대시보드는 선택한 심볼에 대해 사용 가능한 최신 고조파 패턴을 표시하므로 시간을 절약하고 더 효율적으로 사용할 수 있습니다 /   MT4 버전 . 무료 인디케이터:   Basic Harmonic Pattern 인디케이터 열 Symbol :   선택한 심볼이 나타납니다 Trend :   강세 또는 약세 Pattern :   패턴 유형(가틀리, 나비, 박쥐, 게, 상어, 사이퍼 또는 ABCD) Entry :   진입 가격 SL:   스톱로스 가격 TP1:   1차 테이크프로핏 가격 TP2:   2차 테이크프로핏 가격 TP3:   3차 테이크프로핏 가격 Current price:   현재 가격 Age (in bars):   마지막으로 그려진 패턴의 나이 주요 입력 Symbols :   "28개 주요 통화쌍" 또는 "선택한 심볼" 중에서 선택합니다. Selected Symbols :   쉼표로 구분하여 모니터링하려는 원하는 심볼("EURUSD,GBPUSD,XAUUSD")
TrendMaestro5
Stefano Frisetti
note: this indicator is for METATRADER4, if you want the version for METATRADER5 this is the link:  https://www.mql5.com/it/market/product/108106 TRENDMAESTRO ver 2.4 TRENDMAESTRO recognizes a new TREND in the bud, he never makes mistakes. The certainty of identifying a new TREND is priceless. DESCRIPTION TRENDMAESTRO identifies a new TREND in the bud, this indicator examines the volatility, volumes and momentum to identify the moment in which there is an explosion of one or more of these data a
Golden Spikes Premium
Kwaku Bondzie Ghartey
Golden Spikes Detector Overview: The Golden Spikes Premium is a groundbreaking trading indicator meticulously crafted for the Boom and Crash indices on the Deriv market. Tailored to meet the needs of discerning traders, this powerful tool operates exclusively on the one-minute timeframe, providing timely and precise signals to maximize your trading potential. The Golden Spikes Detector stands out in its ability to deliver accurate signals, ensuring that you capitalize on market opportunities wit
Gartley Hunter Multi
Siarhei Vashchylka
5 (8)
Gartley Hunter Multi - An indicator for searching for harmonic patterns simultaneously on dozens of trading instruments and on all possible timeframes. Manual (Be sure to read before purchasing) | Version for MT4 Advantages 1. Patterns: Gartley, Butterfly, Shark, Crab. Bat, Alternate Bat, Deep Crab, Cypher 2. Simultaneous search for patterns on dozens of trading instruments and on all possible timeframes 3. Search for patterns of all possible sizes. From the smallest to the largest 4. A
PZ Support Resistance MT5
PZ TRADING SLU
4.17 (6)
Unlock key market insights with automated support and resistance lines Special Offer: Purchase now to receive free bonuses worth $89! (Read more for details) Tired of plotting support and resistance lines? This is a multi-timeframe indicator that detects and plots supports and resistance lines in the chart with the same precision as a human eye would. As price levels are tested over time and its importance increases, the lines become thicker and darker, making price leves easy to glance and ev
Matrix Arrow Indicator MT5
Juvenille Emperor Limited
5 (14)
매트릭스 화살표 표시기 MT5 는 외환, 상품, 암호 화폐, 지수, 주식과 같은 모든 기호/도구에 사용할 수 있는 100% 다시 칠하지 않는 다중 기간 표시기를 따르는 고유한 10 in 1 추세입니다.  Matrix Arrow Indicator MT5 는 다음과 같은 최대 10개의 표준 지표에서 정보와 데이터를 수집하여 초기 단계에서 현재 추세를 결정합니다. 평균 방향 이동 지수(ADX) 상품 채널 지수(CCI) 클래식 하이켄 아시 캔들 이동 평균 이동 평균 수렴 발산(MACD) 상대 활력 지수(RVI) 상대 강도 지수(RSI) 포물선 SAR 스토캐스틱 오실레이터 윌리엄스의 백분율 범위 모든 지표가 유효한 매수 또는 매도 신호를 제공하면 강력한 상승/하락 추세를 나타내는 다음 캔들/막대가 시작될 때 해당 화살표가 차트에 인쇄됩니다. 사용자는 사용할 표시기를 선택하고 각 표시기의 매개변수를 개별적으로 조정할 수 있습니다. 매트릭스 화살표 표시기 MT5는 선택한 표시기에서만 정보를 수
Volume by Price MT5
Brian Collard
3.6 (5)
The Volumebyprice.com Indicator for MetaTrader 5 features Volume Profile and Market Profile TPO (Time Price Opportunity). Volume and TPO histogram bar and line charts. Volume Footprint charts. TPO letter and block marker collapsed and split structure charts. Static, dynamic and flexible range segmentation and compositing methods with relative and absolute visualizations. Session hours filtering and segment concatenation with Market Watch and custom user specifications. Graphical layering, posit
ICT, SMC, SMART MONEY CONCEPTS, SMART MONEY, Smart Money Concept, Support and Resistance, Trend Analysis, Price Action, Market Structure, Order Blocks, BOS/CHoCH,   Breaker Blocks ,  Momentum Shift,   Supply&Demand Zone/Order Blocks , Strong Imbalance,   HH/LL/HL/LH,    Fair Value Gap, FVG,  Premium  &   Discount   Zones, Fibonacci Retracement, OTE, Buy Side Liquidity, Sell Side Liquidity, BSL/SSL Taken, Equal Highs & Lows, MTF Dashboard, Multiple Time Frame, BigBar, HTF OB, HTF Market Structure
Volatility Trend System - a trading system that gives signals for entries. The volatility system gives linear and point signals in the direction of the trend, as well as signals to exit it, without redrawing and delays. The trend indicator monitors the direction of the medium-term trend, shows the direction and its change. The signal indicator is based on changes in volatility and shows market entries. The indicator is equipped with several types of alerts. Can be applied to various trading in
Blahtech Supply Demand MT5
Blahtech Limited
4.54 (13)
Was: $299  Now: $99   Supply Demand uses previous price action to identify potential imbalances between buyers and sellers. The key is to identify the better odds zones, not just the untouched ones. Blahtech Supply Demand indicator delivers functionality previously unavailable on any trading platform. This 4-in-1 indicator not only highlights the higher probability zones using a multi-criteria strength engine, but also combines it with multi-timeframe trend analysis, previously confirmed swings
금 TMAF MTF - 최고의 주식 기술 지표입니다. 지표 알고리즘은 자산의 가격 움직임을 분석하고 변동성과 잠재적 진입 구간을 반영합니다. 최고의 지표 신호입니다: - 매도 = TMA1의 빨간색 상한선 위의 TMA2의 빨간색 상한선 + 위의 빨간색 프랙탈 인디케이터 + 같은 방향의 노란색 SR 신호 화살표. - 매수 = TMA2의 파란색 하한선 아래 TMA1의 파란색 하한선 + 아래에서 파란색 프랙탈 표시기 + 같은 방향의 아쿠아 SR 신호 화살표. 인디케이터의 장점 1. 이 인디케이터는 높은 정확도로 신호를 생성합니다. 2. 확인 된 화살표 신호는 다시 그려지지 않으며 프랙탈 신호는 절반 기간 동안 다시 그릴 수 있습니다. 3. 모든 브로커의 메타트레이더 5 거래 플랫폼에서 거래할 수 있습니다. 4. 모든 자산(통화, 금속, 암호화폐, 주식, 지수 등)을 거래할 수 있습니다. 5. M30-H1 차트주기(중기 트레이딩)에서 거래하는 것이 좋습니다. 6
Automated Trendlines MT5
Georgios Kalomoiropoulos
추세선은 외환 거래에서 기술적 분석의 가장 필수적인 도구입니다. 불행히도, 대부분의 거래자는 올바르게 그리지 않습니다. 자동 추세선 표시기는 시장의 추세 움직임을 시각화하는 데 도움이 되는 진지한 거래자를 위한 전문 도구입니다. 추세선 강세 추세선과 약세 추세선에는 두 가지 유형이 있습니다. 상승 추세에서 Forex 추세선은 가격 움직임의 가장 낮은 스윙 포인트를 통해 그려집니다. 최소 두 개의 "최저 저점"을 연결하면 추세선이 생성됩니다. 하락 추세에서 추세선은 가격 움직임의 가장 높은 스윙 포인트를 통해 그려집니다. 최소 두 개의 "최고 최고점"을 연결하면 추세선이 생성됩니다. 추세선이 깨질 때? 강세 추세선은 약세 양초가 강세 추세선 아래에서 닫히고 양초의 고점이 추세선 위에 있을 때 깨집니다. 약세 추세선은 강세 양초가 약세 추세선 위로 마감되고 양초 저점이 추세선 아래에 있을 때 깨집니다. 추세선이 삭제되면? 강세 추
TPA True Price Action indicator reveals the true price action of the market makers through 100% non-repainting signals strictly at the close of a candle! TPA shows entries and re-entries, every time the bulls are definitely stronger than the bears and vice versa. Not to confuse with red/green candles. The shift of power gets confirmed at the earliest stage and is ONE exit strategy of several. There are available now two free parts of the TPA User Guide for our customers. The first "The Basics"
The 1 2 3 Pattern Scanner MT5
Reza Aghajanpour
5 (16)
** All Symbols x All Timeframes scan just by pressing scanner button ** ***Contact me after purchase to send you instructions and add you in "123 scanner group" for sharing or seeing experiences with other users. After 17 years of experience in the markets and programming, Winner indicator is ready. I would like to share with you! Introduction The 123 Pattern Scanner indicator with a special enhanced algorithm is a very repetitive common pattern finder with a high success rate . Interestingly,
Auto Order Block with break of structure based on ICT and Smart Money Concepts (SMC) Futures Break of Structure ( BoS )             Order block ( OB )            Higher time frame Order block / Point of Interest ( POI )    shown on current chart           Fair value Gap ( FVG ) / Imbalance   -  MTF      ( Multi Time Frame )    HH/LL/HL/LH  -  MTF      ( Multi Time Frame )  Choch  MTF      ( Multi Time Frame )  Volume Imbalance     ,  MTF          vIMB Gap’s Power of 3 Equal High
제작자의 제품 더 보기
Ticks Bands
Andrej Nikitin
The Bollinger Bands indicator drawn using a tick chart. After launching it, wait for enough ticks to come. Parameters: Period - period of averaging. Deviation - deviation from the main line. Price levels count - number of displayed price levels (no levels are displayed if set to 0). Bar under calculation - number of bars on the chart for the indicator calculation. Buffer indexes: 0 - BASE_LINE, 1 - UPPER_BAND, 2 - LOWER_BAND, 3 - BID, 4 - ASK.
AccountQuickReport
Andrej Nikitin
5 (2)
The script creates account summary report in a separate window. The report can be created for all deals and on deals for selected financial instruments. It is possible to specify a time interval of calculation and save report to htm-file. The script creates account summary report in a separate window. The report can be created for all deals and for deals of the selected financial instruments. It is possible to specify a time interval of calculation and save report to htm-file. Input paramet
Ticks RSI
Andrej Nikitin
The Relative Strength Index indicator drawn using a tick chart. After launching it, wait for enough ticks to come. Parameters: RSI Period - period of averaging. overbuying level - overbought level. overselling level - oversold level. calculated bar - number of bars on the chart for the indicator calculation. The following parameters are intended for adjusting the weight of RSI signals (from 0 to 100). You can find their description in the Signals of the Oscillator Relative Strength Index section
Ticks
Andrej Nikitin
4 (6)
A simple tick indicator of Bid and Ask prices. The period separator (1 minute) is displayed as a histogram. Parameters Show Bid Line - show/hide the Bid line; Show Ask Line - show/hide the Ask line; Show Labels - show/hide the last price values.
FREE
TrailingStop MA 4
Andrej Nikitin
4 (3)
The indicator draws two simple moving averages using High and Low prices. The MA_High line is displayed when the moving average is directed downwards. It can be used for setting a stop order for a sell position. The MA_Low line is displayed when the moving average is directed upwards. It can be used for setting a stop order for a buy position. The indicator is used in the TrailingStop Expert Advisor. Parameters Period - period of calculation of the moving average. Deviation - rate of convergence
FREE
TrailingStop MA
Andrej Nikitin
3.8 (5)
The indicator draws two simple moving averages using High and Low prices. The MA_High line is displayed when the moving average is directed downwards. It can be used for setting a stop order for a sell position. The MA_Low line is displayed when the moving average is directed upwards. It can be used for setting a stop order for a buy position. The indicator is used in the TrailingStop Expert Advisor. Parameters Period - period of calculation of the moving average. Deviation - rate of convergence
FREE
Tick
Andrej Nikitin
4.33 (3)
A simple tick indicator of Bid and Ask prices. The period separator (1 minute) is displayed as a histogram. Parameters Price_levels_count - number of price levels to be displayed. Bar_under_calculation - number of bars of the indicator to be displayed on the chart.
FREE
Ticks RSI 4
Andrej Nikitin
The Relative Strength Index indicator drawn using a tick chart. After launching it, wait for enough ticks to come. Parameters: RSI Period - period of averaging. overbuying level - overbought level. overselling level - oversold level. calculated bar - number of bars on the chart for the indicator calculation. The following parameters are intended for adjusting the weight of RSI signals (from 0 to 100). You can find their description in the Signals of the Oscillator Relative Strength Index section
The Envelopes indicator drawn using a tick chart. After launching it, wait for enough ticks to come. Parameters: Averaging period - period of averaging. Smoothing type - type of smoothing. Can have any values of the enumeration ENUM_MA_METHOD . Option prices - price to be used. Can be Ask, Bid or (Ask+Bid)/2. Deviation of boundaries from the midline (in percents) - deviation from the main line in percentage terms. Price levels count - number of displayed price levels (no levels are displayed if
The Stochastic Oscillator indicator is drawn on the tick price chart. After launching it, wait for enough ticks to come. Parameters: K period - number of single periods used for calculation of the stochastic oscillator; D period - number of single periods used for calculation of the %K Moving Average line; Slowing - period of slowing %K; Calculated bar - number of bars in the chart for calculation of the indicator. The following parameters are intended for adjusting the weight of signals of the
Ticks MACD 4
Andrej Nikitin
The Moving Average Convergence/Divergence(MACD) indicator drawn using a tick chart. After launching it, wait for enough ticks to come. Parameters: Fast EMA period - indicator drawn using a tick chart. Slow EMA period - slow period of averaging. Signal SMA period - period of averaging of the signal line. calculated bar - number of bars on the chart for the indicator calculation. The following parameters are intended for adjusting the weight of MACD signals (from 0 to 100). You can find their desc
Ticks Bands 4
Andrej Nikitin
The Bollinger Bands indicator drawn using a tick chart. After launching it, wait for enough ticks to come. Parameters: Period - period of averaging. Deviation - deviation from the main line. Price levels count - number of displayed price levels (no levels are displayed if set to 0). Bar under calculation - number of bars on the chart for the indicator calculation. Buffer indexes: 0 - BASE_LINE, 1 - UPPER_BAND, 2 - LOWER_BAND, 3 - BID, 4 - ASK.
Ticks OsMA 4
Andrej Nikitin
The Moving Average of Oscillator(OsMA) indicator drawn using a tick chart. After launching it, wait for enough ticks to come. Parameters: Fast EMA period - fast period of averaging. Slow EMA period - slow period of averaging. Signal SMA period - period of averaging of the signal line. calculated bar - number of bars for the indicator calculation.
Ticks CCI 4
Andrej Nikitin
The Commodity Channel Index(CCI) indicator drawn using a tick chart. After launching it, wait for enough ticks to come. Parameters: period - number of single periods used for the indicator calculation. calculated bar - number of bars for the indicator calculation. The following parameters are intended for adjusting the weight of CCI signals (from 0 to 100). You can find their description in the Signals of the Commodity Channel Index section of MQL5 Reference. The oscillator has required directio
Ticks ADX 4
Andrej Nikitin
The Average Directional Movement Index indicator drawn using a tick chart. After launching it, wait for enough ticks to come. Parameters: Period - period of averaging. Сalculated bar - number of bars on the chart for the indicator calculation. Buffer indexes: 0 - MAIN_LINE, 1 - PLUSDI_LINE, 2 - MINUSDI_LINE.
Tick StdDev 4
Andrej Nikitin
The Standard Deviation (StdDev) indicator drawn using a tick chart. After launching it, wait for enough ticks to come. Parameters: Period - period of averaging. Method - method of averaging. calculated bar - number of bars for the indicator calculation.
Ticks Momentum 4
Andrej Nikitin
The Momentum indicator drawn using a tick chart. After launching it, wait for enough ticks to come. Parameters: period - period of the indicator calculation. levels count - number of displayed levels (no levels are displayed if set to 0) calculated bar - number of bars for the indicator calculation.
Ticks Bulls 4
Andrej Nikitin
The Bulls Power indicator drawn using a tick chart. After launching it, wait for enough ticks to come. Parameters: Period - period of averaging. The number of ticks to identify high/low - number of single ticks for determining high/low. Calculated bar - number of bars for the indicator calculation. The following parameters are intended for adjusting the weight of Bulls Power signals (from 0 to 100). You can find their description in the Signals of the Bulls Power oscillator section of MQL5 Refer
Ticks Bears 4
Andrej Nikitin
The  Bears Power indicator drawn using a tick chart. After launching it, wait for enough ticks to come. Parameters: Period - period of averaging. The number of ticks to identify high/low - number of single ticks for determining high/low. Calculated bar - number of bars for the indicator calculation. The following parameters are intended for adjusting the weight of Bears Power signals (from 0 to 100). You can find their description in the Signals of the Bears Power oscillator section of MQL5 Refe
Tiks ATR 4
Andrej Nikitin
The  Average True Range (ATR)  indicator drawn using a tick chart. After launching it, wait for enough ticks to come. Parameters: ATR Period  - number of single periods used for the indicator calculation. The number of ticks to identify Bar  - number of single ticks that form OHLC. Price levels count  - number of displayed price levels (no levels are displayed if set to 0 or a lower value). price mode  - choice of prices under calculation (can be bid, ask or average). Сalculated bar  - number of
Tiks WPR 4
Andrej Nikitin
The  Williams' Percent Range (%R)  indicator drawn using a tick chart. After launching it, wait for enough ticks to come. Parameters: WPR Period  - period of the indicator. Overbuying level  - overbought level. Overselling level  - oversold level. price mode  - choice of prices under calculation (can be bid, ask or average). Сalculated bar  - number of bars for the indicator calculation. The following parameters are intended for adjusting the weight of WPR signals (from 0 to 100). You can find t
The  Price Channel  indicator drawn using a tick chart. After launching it, wait for enough ticks to come. Parameters: Period  - period for determining the channel boundaries. Price levels count  - number of displayed price levels (no levels are displayed if set to 0). price mode  - choice of prices under calculation (can be bid, ask or average). Bar under calculation  - number of bars on the chart for the indicator calculation. Buffer indexes: 0 - Channel upper, 1 - Channel lower, 2 - Channel m
Abigail 4
Andrej Nikitin
Description: Abigail is a medium-term trading system making profit during the price rollback. The Expert Advisor has been optimized for working on EURUSD. However, it can successfully work with other currency pairs as well. You can examine the Expert Advisor's trading statistics for different brokers and symbols at MetaTrader 4 and MetaTrader 5 Trading Signals sections. Parameters: Risk management: enter volume - market entry volume. If the value is greater than 0 - number of lots, if less than
TimeFilter indicator allows you to visually select bit masks (GoodHourOfDay, BadHoursOfDay, GoodDayOfWeek, BadDaysOfWeek) for the  Intraday Time Filter  module of trading signals of the Standard Library. The use of time filters allows you to take into account the particulars of each trading session in performing trading operations.
TimeFilter simple 4
Andrej Nikitin
1 (1)
The indicator is an inter-week hourly filter. When executing trading operations, the indicator allows considering time features of each trading session. Permissive and restrictive filter intervals are set in string form. The used format is [first day]-[last day]:[first hour]-[last hour]. See the screenshots for examples. Parameters: Good Time for trade - intervals when trading is allowed. Bad Time for trade - intervals when trading is forbidden. time filter shift (hours) - hourly shift. percent
TrailingStop 4
Andrej Nikitin
4.83 (6)
The Expert Advisor modifies the Stop Loss order position opened for the instrument of the current chart based on indicator values. Uses indicators Parabolic SAR ,  NRTR (Nick Rypock Trailing Reverse) ,  Moving Average  or linear regression channel. Switchable modes: Trailing stop only when in profit; Trailing stop only following the price; On every teak or on formed bars; Trailing for each order separately or for a total position. Has an option of "hidden stop", also you can exclude individual
The script creates account summary report in a separate window. The report can be created for all deals and for deals on selected financial instruments. It is possible to specify a time interval of calculation and save report to an htm file. Script inputs report starting date - initial report generation date. symbols selection for report - select a method of choosing tools for a report generation. allSymbol - report is generated for deals performed on all symbols. onlyCurrentSymbol - report
The EA performs trade operations of closing position groups. Positions are grouped by type. It is possible to select orders by the profit (loss) value. It is possible to form the closure groups manually. You can set a value for automatic closure of a positions group after reaching a certain profit/loss level or price level. The additional functions of the EA are called using the hot keys: SHIFT+A - show/hide Auto exit options. SHIFT+S - show/hide Settings panel. SHIFT+V - sound ON/OFF. SHIFT+I -
The Expert Advisor for increasing (or opening) market positions. Allows specifying the desired risk, target and searching for the best open price and trade volume. Configurable Parameters: lots - directly the volume of the position increase. % equity - the amount of growth as a percentage of the amount of funds. stop loss - directly the level of the stop loss order. loss - the level of the stop loss order depending on the allowable loss. take profit - directly the take profit level of
The Expert Advisor notifies that a price has crossed a line on the chart. It handles two types of lines - horizontal line and a trendline. The number of lines is unlimited. Parameters: prefix of signal line - prefix of object (line) names processed by the indicator. If the parameter is empty, it handles all object types: horizontal lines and trendlines. price Mode - price type (bid or ask). timeout - crossing alert timeout. number of repeats - the limit of crossing alert repeats. number of comme
필터:
jaffer wilson
4354
jaffer wilson 2019.11.29 11:38 
 

This works like charm... :) Wow.

[삭제] 2019.01.14 07:07 
 

사용자가 평가에 대한 코멘트를 남기지 않았습니다

Gennadiy Voltornist
11909
Gennadiy Voltornist 2017.12.22 17:25 
 

사용자가 평가에 대한 코멘트를 남기지 않았습니다

Andrei
836
Andrei 2017.11.09 15:45 
 

사용자가 평가에 대한 코멘트를 남기지 않았습니다

Daniel Andrejczuk
5596
Daniel Andrejczuk 2017.11.09 14:08 
 

사용자가 평가에 대한 코멘트를 남기지 않았습니다

Nork
6194
Nork 2016.12.21 07:35 
 

사용자가 평가에 대한 코멘트를 남기지 않았습니다

Rodrigo da Silva Boa
7136
Rodrigo da Silva Boa 2016.01.09 13:20 
 

사용자가 평가에 대한 코멘트를 남기지 않았습니다

[삭제] 2014.05.16 08:51 
 

사용자가 평가에 대한 코멘트를 남기지 않았습니다

Vadim Strelkov
7710
Vadim Strelkov 2014.04.04 09:42 
 

사용자가 평가에 대한 코멘트를 남기지 않았습니다

리뷰 답변
버전 1.11 2021.03.01
recompiled