Forex Master Pattern
- 지표
- Alberto Gauer Borrego
- 버전: 1.9
- 업데이트됨: 29 10월 2024
- 활성화: 5
Be mindful to choose the appropriate number of historical bars used for calculation according to the timeframe you load the indicator in.
I recommend that you use the strategy tester if you wanna analyze more than 10K bars historically. Instead of trying to load 20K, 30K bars for the algorithm to analyze and draw boxes, it is better if you configure the strategy tester to start where you want to perform your longer term historical analysis.
Indicator Parameters:
They are all self-explanatory, except Type. You can choose between 1 and 2.
1 is better suited for LTF (M1 to M30)
2 is better suited for HTF (H1 and upwards)
However, this is my personal preference. You can of course experiment and choose what looks best for you.
If you wanna learn more about this tool and method, I recommend you to watch the video posted (and also all the other videos from the channel).
PS: The 1st time you launch the indicator on a new symbol, or when you launch the platform and it contains a chart or charts where the indicator was loaded previously, It's normal to sometimes notice an odd behavior (lines may seem to print weirdly and alerts might reflect that too). From what I can tell it's because missing segments of historical data. By scrolling the chart back to force some historical data do be downloaded, waiting for 30 seconds at least for current data to download then changing timeframe back and forth will take care of it.
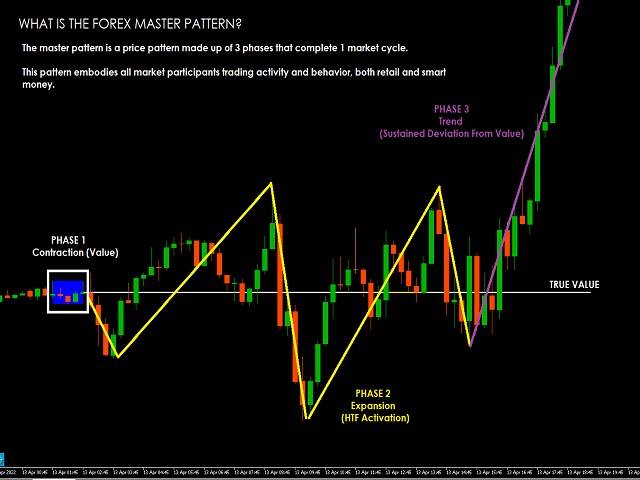


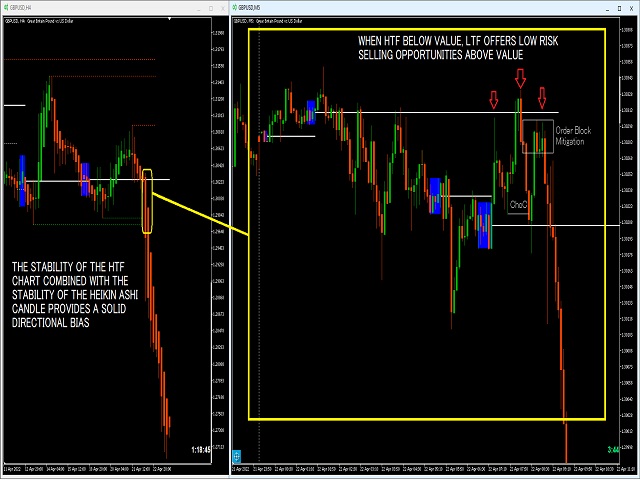


To me, it is a simplified version of the Market profile & Volume profile.