Dynamic Double Moving Averages
- 지표
- Aleksandr Kononov
- 버전: 1.0
이동 평균은 이동 중에 변경됩니다. 표시기는 이동 평균을 계산할 기간을 자동으로 선택합니다. 움직임이 방향성 일수록 평균화 기간이 길어집니다. 추세가 느려지면 이동 평균의 기간이 감소하고 더 빨라집니다. 이를 통해 추세 변화에 더 빨리 반응 할 수 있습니다.
표시기는 추세 또는 추세 반전 지점에서 잘 작동합니다. 옆 방향으로 표시기는 다른 방법으로 사용할 수 있습니다(예:빠르게 움직이는 표시기가 느린 표시기를 위쪽으로 교차 할 때).이 신호는 판매 신호입니다. 또는 채널을 사용하여 대략적인 구매 또는 판매 영역을 결정할 수 있습니다. 설정에서 채널 표시를 활성화 할 수 있습니다.
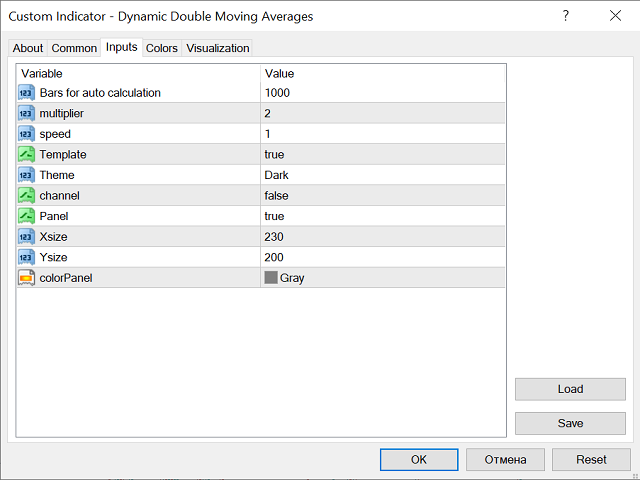
매개 변수:
자동 계산을위한 막대-이 막대 수에 대해 표시기는 극단을 찾고 마지막 극단의 시간에 따라 이동 평균의 기간을 계산합니다.
승수-이동 평균의 차이를 설정합니다.
속도-이동 평균의 전환 속도를 한 기간에서 다른 기간으로 변경합니다.
채널-채널 표시를 활성화 또는 비활성화합니다.
인터페이스의 편의를 위해 다른 설정도 있습니다.
이동 평균의 기간을 변경하는 설정에는 매개 변수가 없습니다.
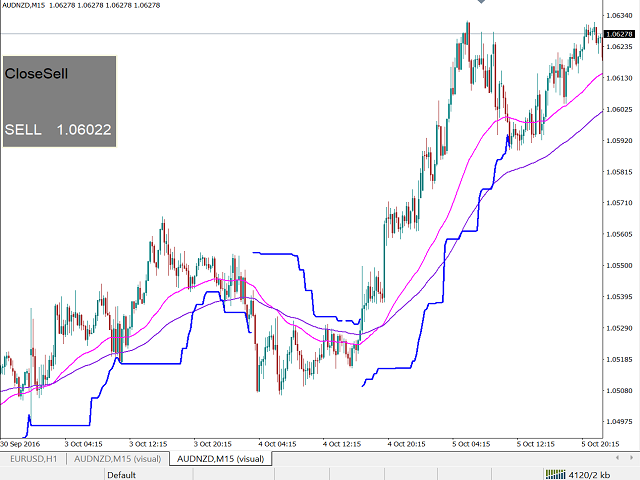


This is a cool indicator if your going to have moving average crossovers, but my problem was the size and location of the advisory box. The size of the box can be adjusted, but it should not be in the location where candles need to be viewed. It would also be nice to be able to adjust the moving averages to what others use. But they appear to be set in stone. Thank you for sharing.