Fair value gap
- 지표
- Santi Dankamjad
- 버전: 4.0
- 업데이트됨: 27 7월 2023
- 활성화: 5
Fair value gap (FVG) = Imbalance zone
Fair value gap Indicator MT4 is the most accurate and customizable indicator on the market. It was developed to facilitate the analysis of operations based on candlestick patterns and supply-demand zones. These zones are possible movement reversal points. For this indicator is generated by the order block of smart money concept.
| High Time Frame (HTF) To Find High Quality Order Block | Low Time Frame (LTF) To Find a secure Entry |
|---|---|
| W1 | D1, H4 |
| D1 | H4, H1, M30 |
| H4 | H1, M15 |
| H1 | M30, M15, M5 |
| M30, M15 | M5, M1 |
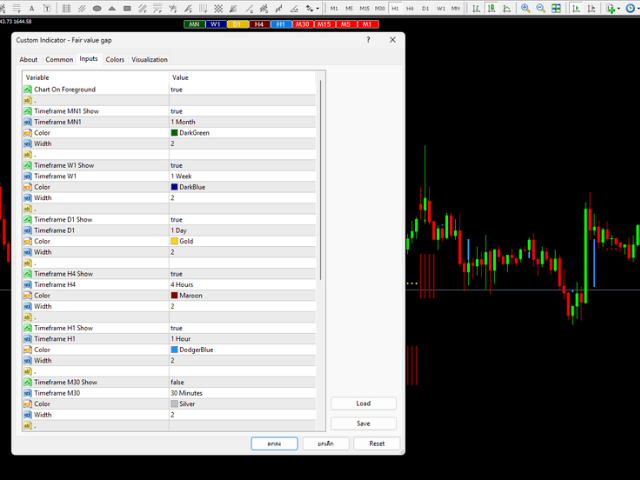
Input parameters:
1. Multiple timeframes : M1 M5 M15 M30 H1 H4 D1 W1 MN1
2. Default input: H1 H4 D1 W1 MN1
3. Notifications / Send Emails / Notifications
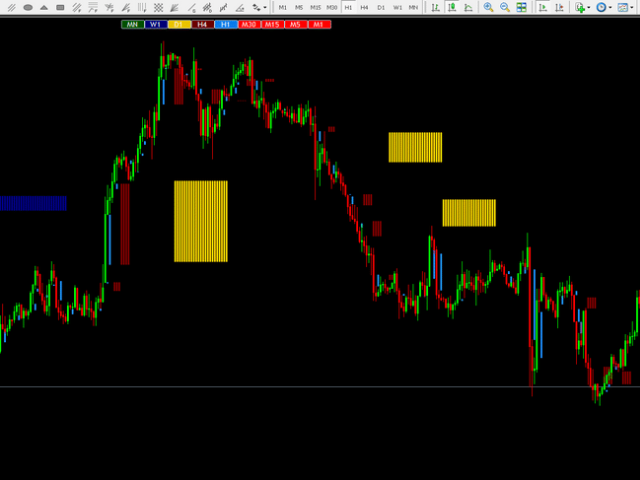
How is this indicator useful?
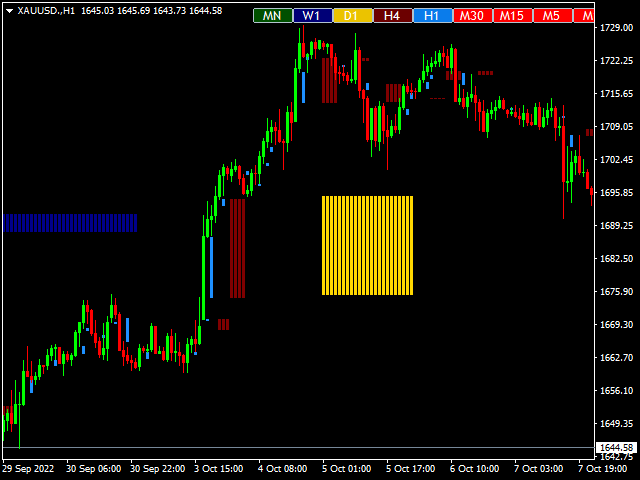
When fair value gap indicator is imported into the chart, you will see a blue box and a skyblue box.
For the blue box is an uptrend and the skyblue box is a downtrend.
Buying and Selling Strategy :
1. Follow the trend
- Uptrend a blue box will appear.
- Downtrend a skyblue box will appear.
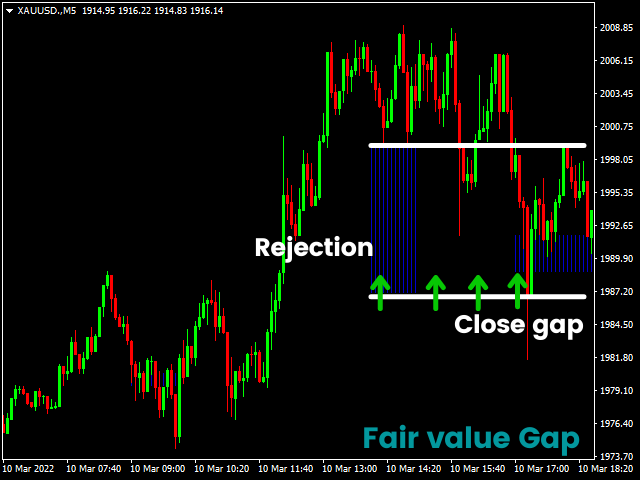
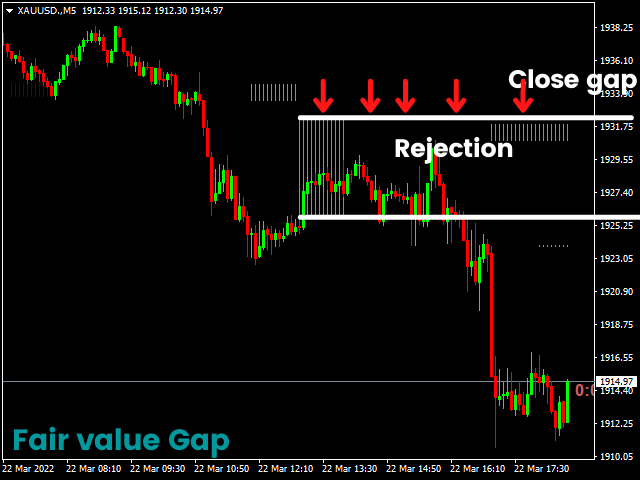
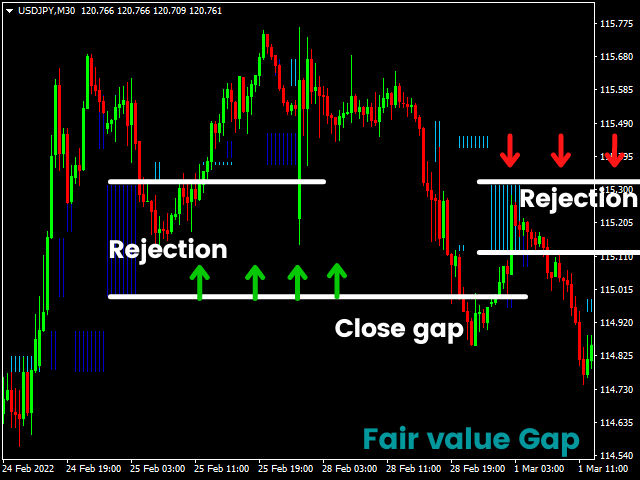
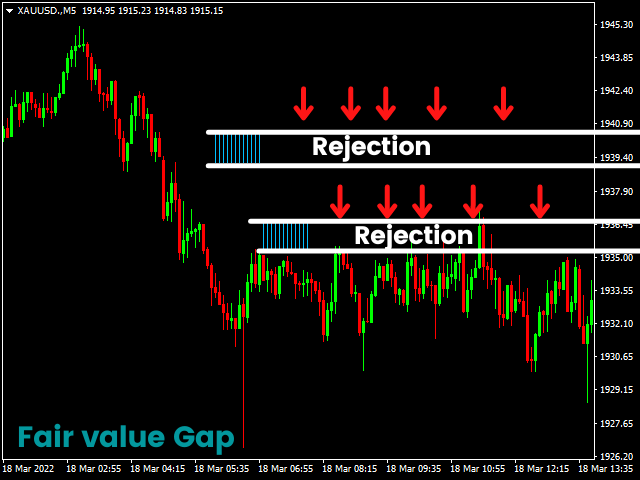
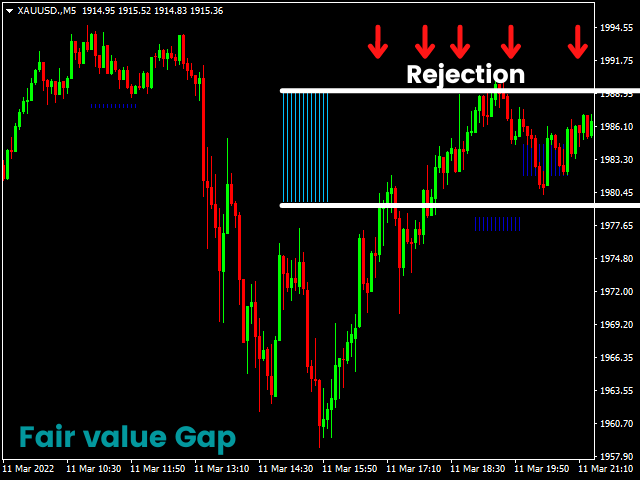
2. Pivot point or trend reversal point (Price rejection)
- The price runs from top to bottom and hits the blue box. Give a view to uptrend (The first touch only to price rejection and secound or third the price close gap)
- The price runs from the bottom up and hit the skyblue box. Give a view to downtrend (The first touch only to price rejection and secound or third the price close gap)
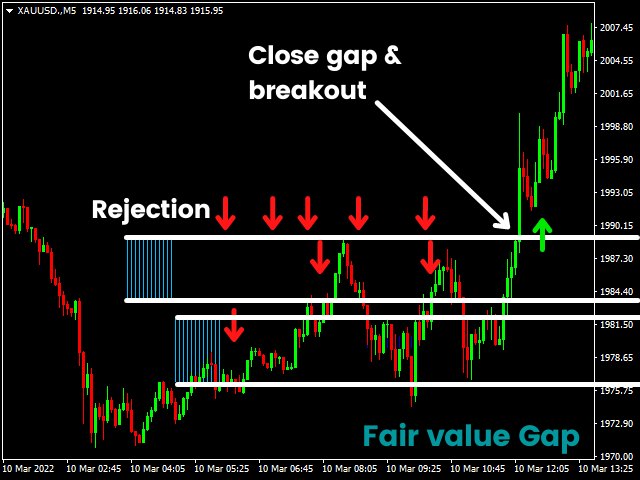
3. The price is intense and breaks through the box to the other side.
- The price runs from top to bottom and quickly breaks through the blue box. Gives a view of the downtrend immediately
- The price runs from the bottom up, and quickly breaks through the skyblue box. Gives an immediate uptrend view
Trading tricks : Super Order Block and FVG
1. Strong Market Structure Break (MSB)
2. MSB Happens at once without prior range.
3. MSB happens with FVG (Fair Value gap) or Pump/Dump
4. Order Block Pattern in this indicator
5. Fast Pump/Dump and Slow pullback
6. Keys Level --> Support & Resistance
7. First test to OB --> Demand & Supply Zone
8. Entry order Confirm by Candle price action or Indicator BB RSI MACD etc.
Suitable for traders of all levels. new traders and expert traders
1. Day traders
2. Fast trading strategy or scalping
3. Binary options like IQ Option, Quotex
4. Follow trend traders
5. Trader Reversal
User Manual : Thai language
https://docs.google.com/presentation/d/1C0OFzV8ZSCvZp7z55DX6DD7izcx8PsA0b0LsGB0LxFY/edit?usp=sharing