Order Block Type I
- 지표
- Santi Dankamjad
- 버전: 1.0
- 활성화: 5
OBTE = Order Block Type I
OBTI Indicator MT4 is the most accurate and customizable indicator on the market. It was developed to facilitate the analysis of operations based on candlestick patterns and supply-demand zones. These zones are possible movement reversal points. For this indicator is generated by the order block of smart money concept.
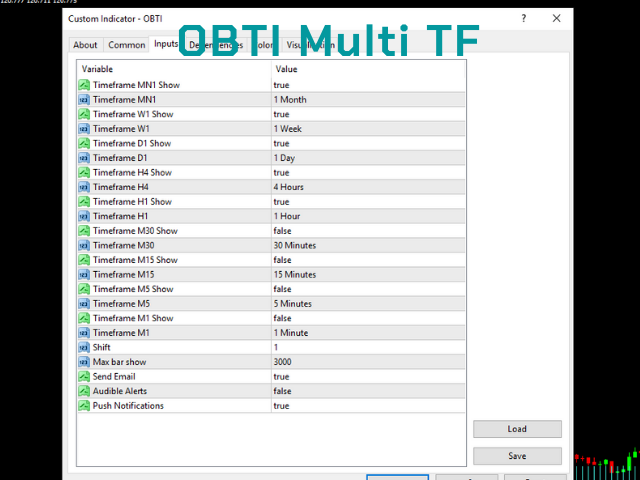
Input parameters:
1. Multiple timeframes : M1 M5 M15 M30 H1 H4 D1 W1 MN1
2. Default input: H1 H4 D1 W1 MN1
3. Notifications / Send Emails / Notifications
How is this indicator useful?
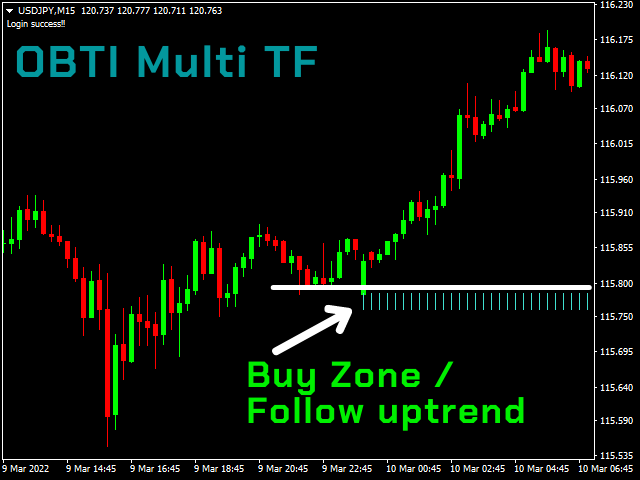
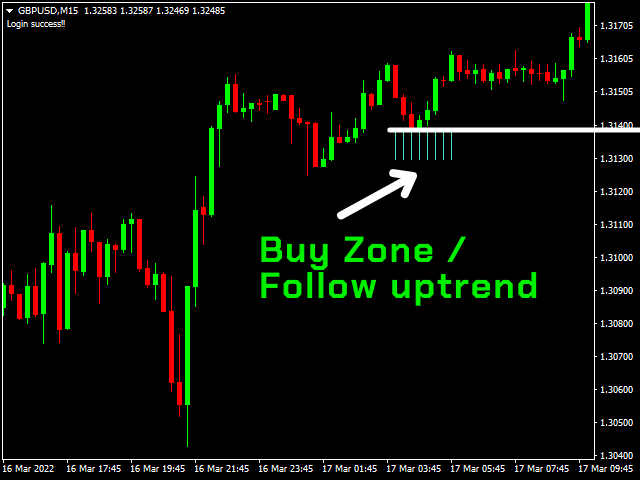
When OBTI is imported into the chart, you will see a green box and a pink box.
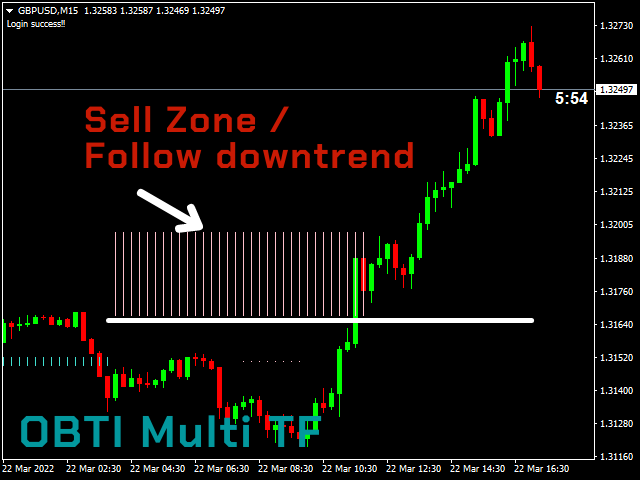
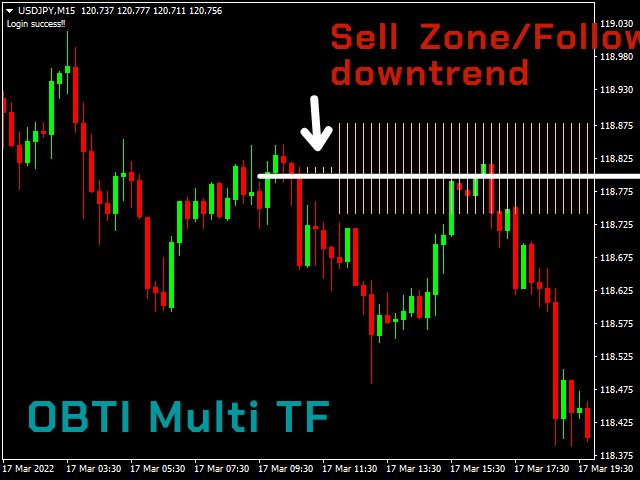
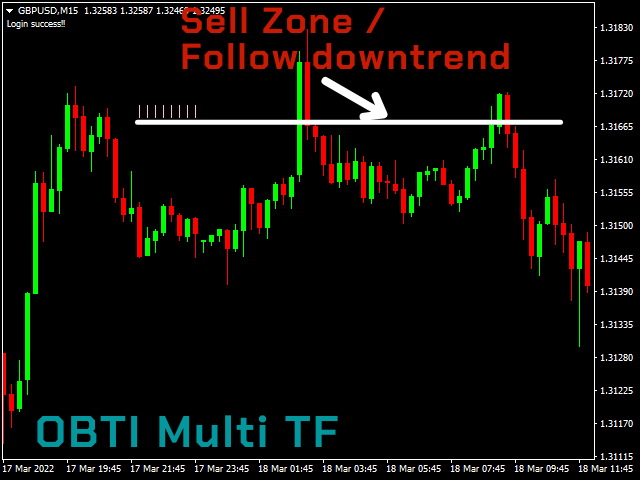
For the green box is an uptrend and the pink box is a downtrend.
Buying and Selling Strategy :
1. Follow the trend
- Uptrend a green box will appear.
- Downtrend a pink box will appear.
2. Pivot point or trend reversal point
- The price runs from top to bottom and hits the green box. Give a view to uptrend
- The price runs from the bottom up and hit the pink box. Give a view to downtrend
3. The price is intense and breaks through the box to the other side.
- The price runs from top to bottom and quickly breaks through the green box. Gives a view of the downtrend immediately
- The price runs from the bottom up, and quickly breaks through the pink box. Gives an immediate uptrend view
Trading tricks :
1. The size of the box horizontally means that the time frame is high.
2. Vertical box size means the price during OBTI is intense, so the price will revert and test box 1 - 2 times
3. OBTI with higher time frame will produce better results than less time frames, for example OBTI D1 is more accurate than OBTI H1
Suitable for traders of all levels. new traders and expert traders
1. Day traders
2. Fast trading strategy or scalping
3. Binary options like IQ Option, Quotex
4. Follow trend traders
5. Trader Reversal