Real Currency Strength
- 지표
- Genorse Iii Gilbert
- 버전: 1.0
- 활성화: 5
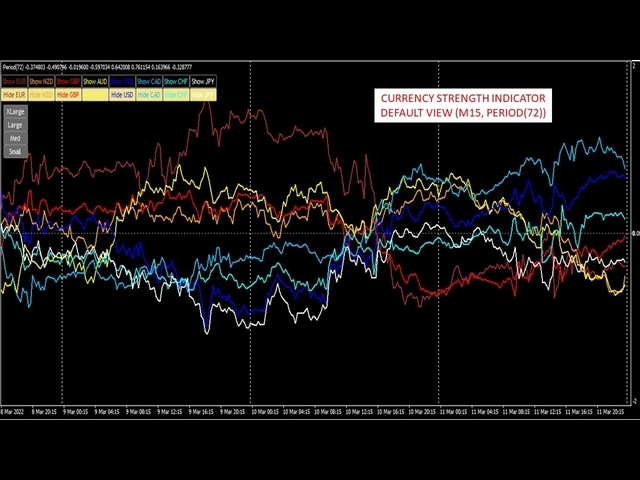
This is a real time, non-repainting, currency strength indicator with 'every' tick-level accuracy. Why wait 5 minutes, 30 minutes, or an hour to see which currency is the strongest or weakest when you can witness the currency appetite of market participants in real time. The Real Currency Strength Indicator (CSI) uses the most precise method in calculating a currency’s performance, tailored to your specific trading style. View all eight major currencies (EUR, GBP, AUD, NZD, USD, CAD, CHF, JPY) or only select currencies you wish to see. This indicator keeps it simple without sacrificing visibility of the most important details. Whether you place the indicator on a chart’s M1 timeframe or daily, the CSI updates in real time without reshaping any of the previous data. Enjoy the ease and flexibility of changing time frames and the period of candles you wish to observe. Learn how to use this single indicator as currency strength indicator, sentiment indicator, RISK-ON/OFF indicator, Market exhaustion indicator, and a volatility indicator and increase your edge.
Indicator inputs:
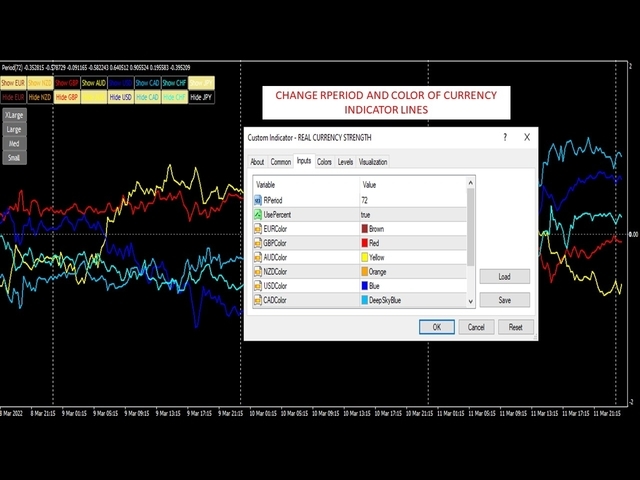
RPeriod - Enter the value of the periods you wish to observe. For example, if you are on the M1 timeframe, a period of 1440 would present the currency strength (in real time) of each currency, since twenty-four hours ago. No need to wait for one minute to elapse to see the next data point. The currency strength indicator moves in real time.
UsePercent - Choose between "true" or "false." When "true" is selected, the value of each indicator represents the percent change of the currency based on the RPeriod and timeframe selected. If "false" is selected, the value of each indicator represents the change in pips of each indicator. Recommend leaving UsePercent to "true."
___Color - Each currency has a default color. Change the indicator color for each currency to suit your needs.
Level - add key levels to the indicator, based on user input.
Indicator buttons:
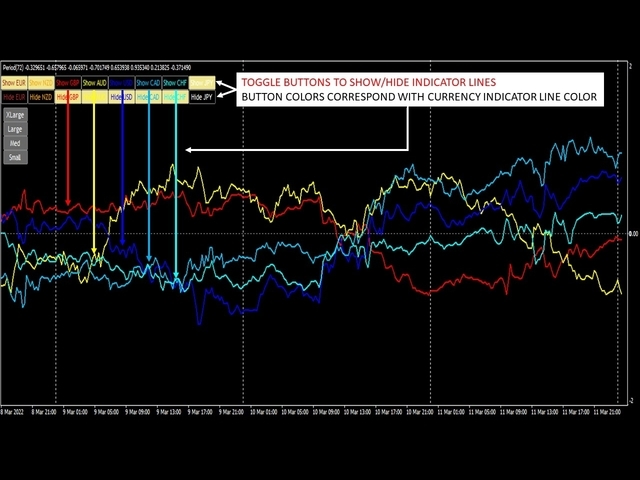
Show/Hide - Each currency has a button to toggle between "Show" and "Hide," which will show or hide the indicator line. If you do not wish to see a particular currency, switch the currency to "Hide." By default, all currency indicator lines are shown.
Indicator Views - There are four view buttons, labeled "XLarge," "Large," "Med," and "Small." Each view has a default timeframe and period that best represents different market lengths for common traders. Small view is best suited for scalpers; Med view is best suited for intraday traders; Large view is best suited for day traders; and XLarge view is best suited for position traders. You can tailor your views by changing the timeframe and RPeriod and saving the chart as a template.
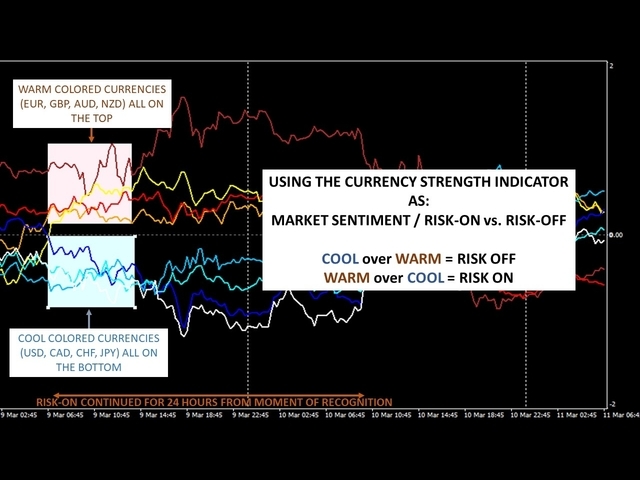
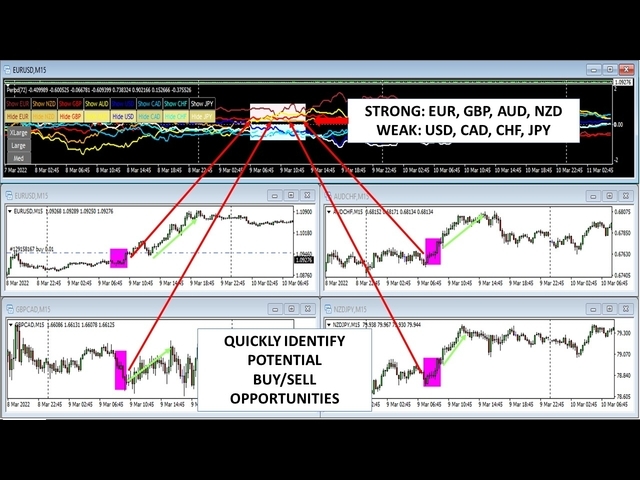
TIP: By default, the eight currencies have been color coded between four cool colors and four warm colors. This allows traders to easily identify market sentiment. When four cool-colored currencies (USD, CAD, CHF, JPY) are grouped together, and four warm colored currencies (EUR, GBP, AUD, NZD) are grouped together, it indicates a clear shift in market sentiment. For example: if the cool colors are grouped together above the warm colors, a sentiment trader may trade "RISK-OFF" by pairing the warm-colored currencies with the cool-colored currencies and SHORT the market. So, if USD, CAD, CHF, and JPY are strong, and EUR, GBP, AUD, and NZD are weak, a sentiment trader may go short EURUSD, GBPCAD, AUDCHF, and NZDJPY.
BONUS: The REAL_CSI is not just a currency strength indicator, it can also act as a sentiment indicator, RISK-ON/OFF indicator, Market exhaustion indicator, and a volatility indicator.
