Trainspotting
- 지표
- Andriy Sydoruk
- 버전: 1.0
- 활성화: 5
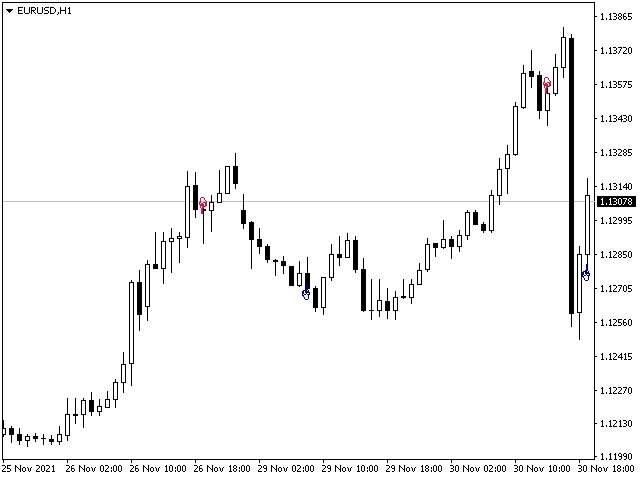
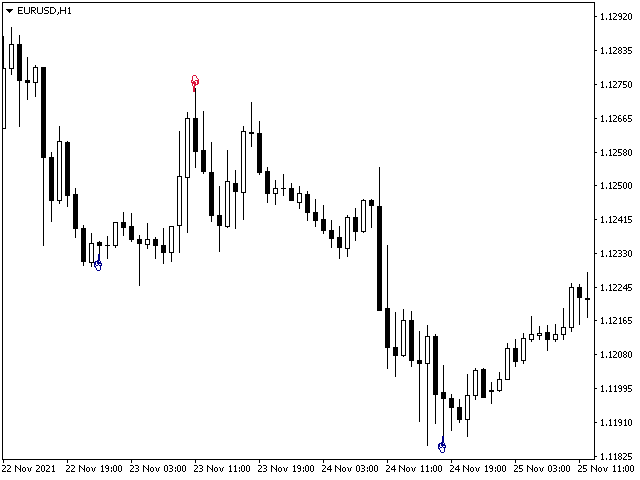
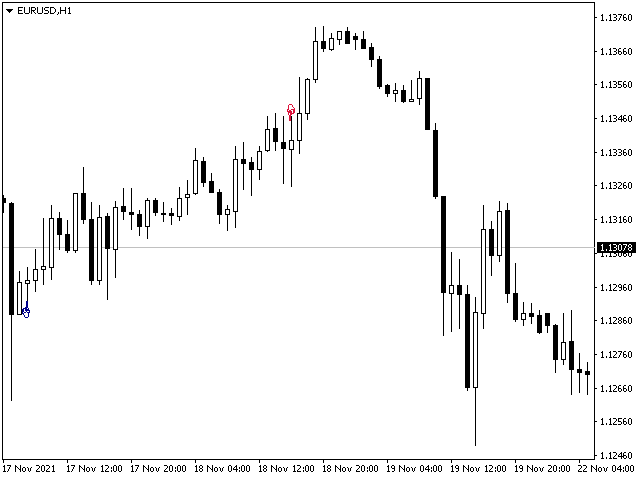
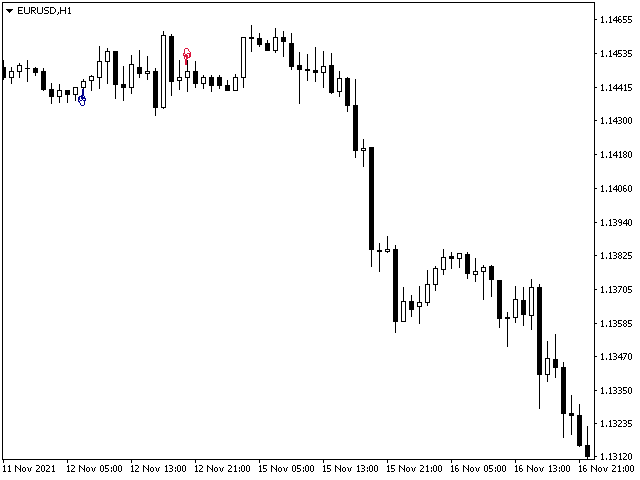
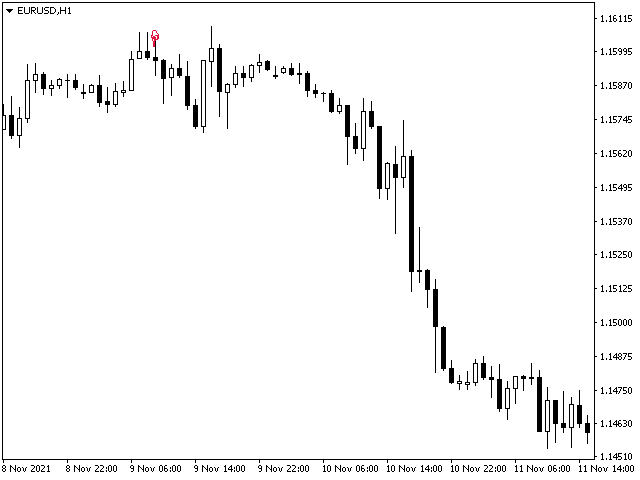
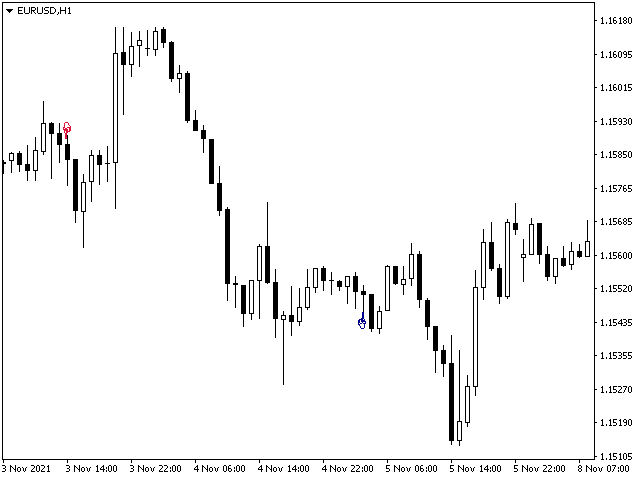
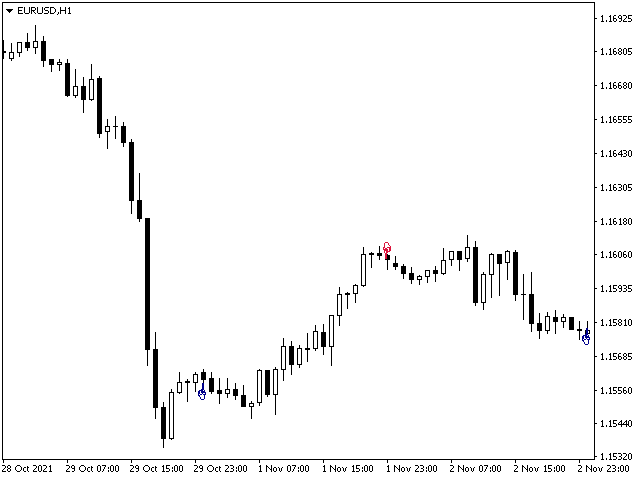
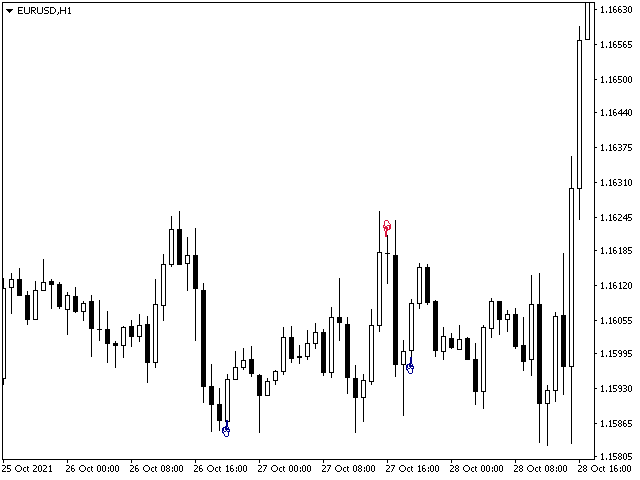
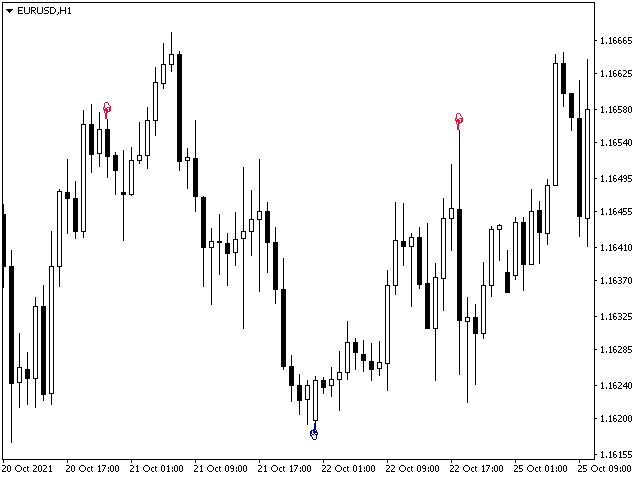
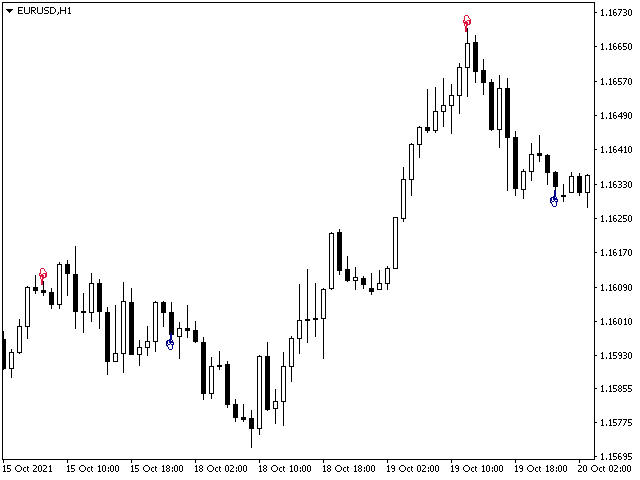
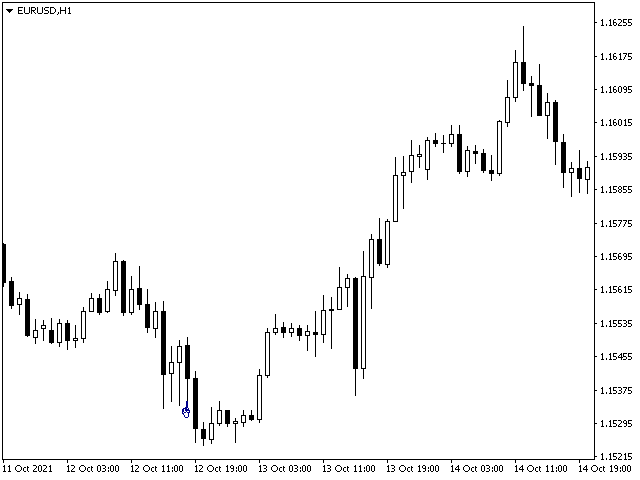
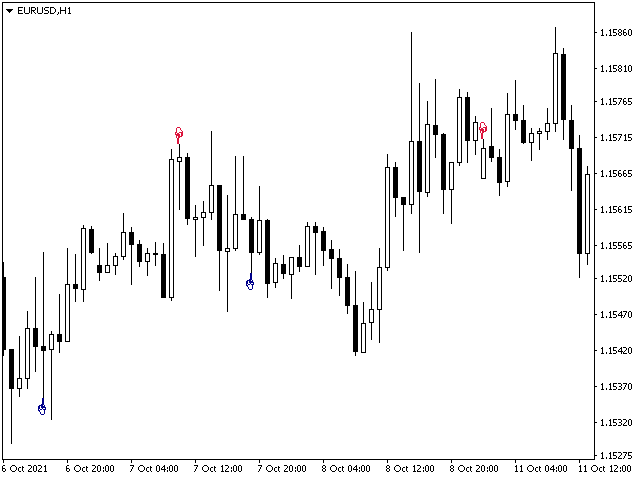
The Trainspotting technical analysis indicator shows market entry points, potential market reversal points. The intelligent algorithm of the indicator accurately determines the trend. Uses two options for settings. The indicator is built for simple and effective visual trend detection with an additional smoothing filter.
Are you tired of the constant ups and downs? Do not become a victim of unstable market movements, it's time to get rid of it somehow! Already now you can use Trainspotting solutions to balance price action analysis and get a clearer picture of price action. Currency pairs never rise or fall in a straight line. Their ups and downs are interspersed with rollbacks and reversals. Every rise and fall is reflected in your emotional state: hope is replaced by fear, and when it passes, hope appears again. The market uses your fear to prevent you from taking advantage of a strong position. At such moments you are most vulnerable.
Advantages
- The indicator is great for scalping.
- Great for finding trend reversals.
- Suitable for beginners and experienced traders.
- Works on any timeframes.
- Flexible notification system.
- Possibility of customization.
Instruction
- As soon as the red arrow appears, open a sell trade, close it when the blue arrow appears!
- As soon as the blue arrow appears, open a buy trade, close it when the red arrow appears!
Settings
- Interval - Interval.
- Correction - Correction.
This indicator works on all timeframes. A ready-made trading system that allows you to find the most probable trend reversal points.
