BPS Break of Structure
- 지표
- Barend Paul Stander
- 버전: 1.4
- 업데이트됨: 5 6월 2024
- 활성화: 5
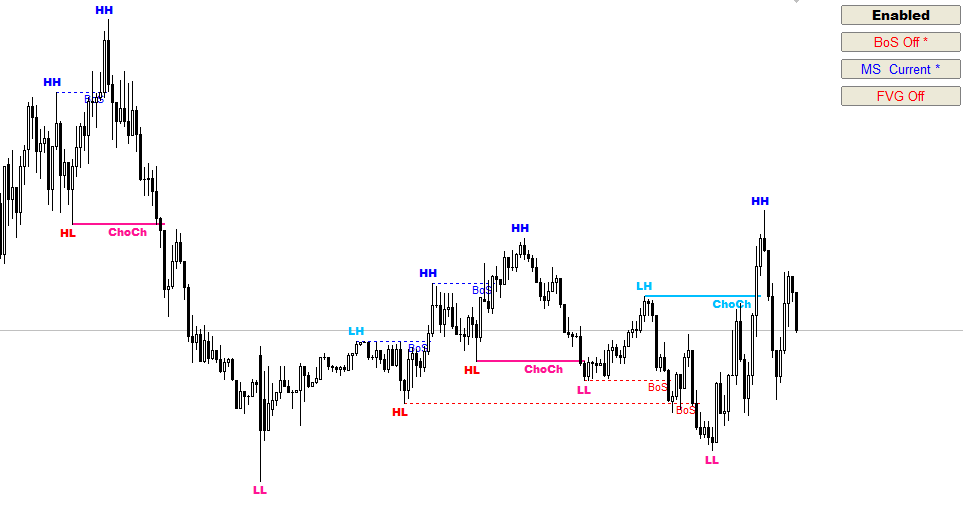
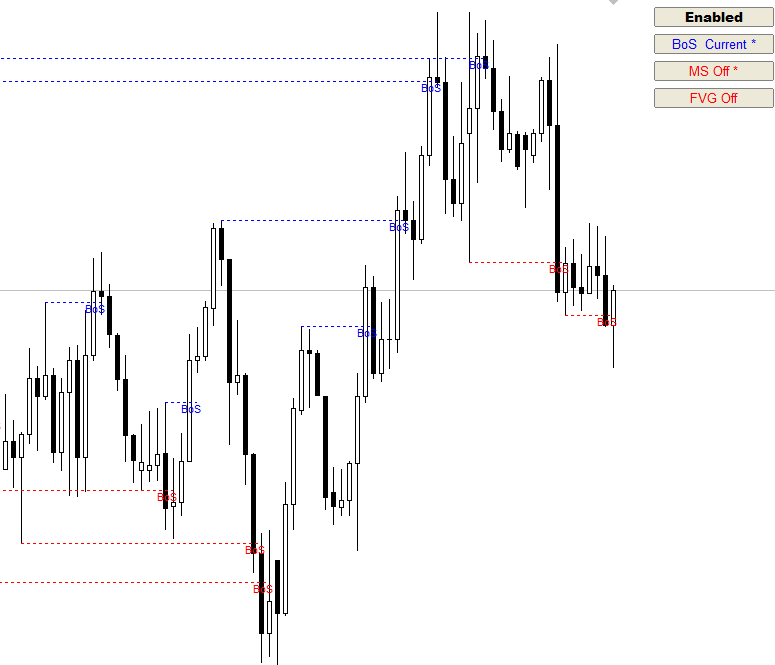
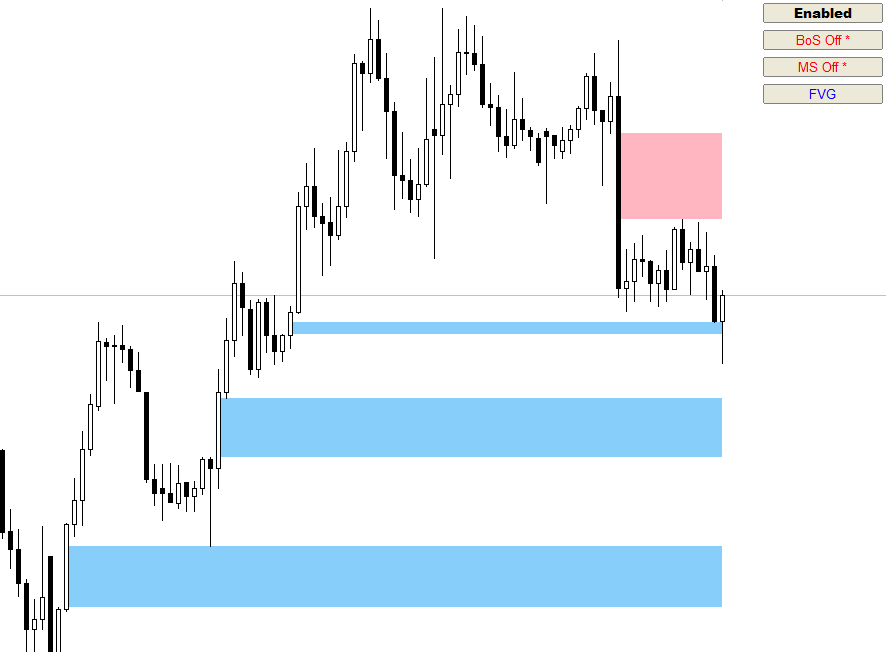
BPS BoS - Break of Structure
- BoS - Fractal mode , MTF
- BoS - Zigzag mode , MTF
- Show HH and LL
- Alerts - Popup , Push notification and eMail
- Option to create screenshot on alert
- Enable / Disable Indicator with a button on chart to select options
- Choose corner of button location
It is not a system but a indicator to help identify break of structure points
MT5 version here : https://www.mql5.com/en/market/product/84734?source=Site+Profile+Seller
Other Indicators : https://www.mql5.com/en/users/fx_1/seller
사용자가 평가에 대한 코멘트를 남기지 않았습니다