• 미리보기
  • 리뷰 (4)
  • 코멘트 (3)
  • 새 소식

Flosoft Supply Demand MT5

5

이 공급 및 수요 영역 표시기는 차트에 영역을 그리고 가격이 영역에 도달하거나 영역을 깨면 경고를 보냅니다. 구역 대신 일반 이중 상단/하단에 대해 경고하는 데 사용할 수도 있습니다. RSI, ADX, 볼륨 및 발산 필터를 사용하여 가장 강력한 설정만 필터링할 수 있습니다. 고유한 규칙 및 기술과 결합하여 이 표시기를 사용하면 자신만의 강력한 시스템을 생성(또는 강화)할 수 있습니다. 이 지표는 이미 공급 수요에 대해 잘 알고 있고 거래를 마감하거나 개설하기로 결정할 때 이를 어떻게 사용할 수 있는지에 대해 이미 잘 알고 있는 경험 많은 거래자를 위한 것입니다.

특징

  • 다음 분기가 지원됩니다.   MACD, OsMA, RSI, CCI, Stochastics 및 Awesome.
  • 구역에는 3가지 색상이 있습니다(입력으로 조정 가능). 테스트되지 않은 영역의 경우 어두운 색상, 테스트된 영역의 경우 중간 색상, 깨진 영역의 경우 밝은 색상.
  • 구역 외경의 가격과 구역 테스트 금액이 구역별로 표기되어 있습니다.
  • 표시기는 자동 거래를 위해 Expert Advisor가 사용할 수 있는 글로벌 변수에 신호를 쓸 수 있습니다.

입력 매개변수

여기 에서 입력 매개변수에 대한 설명과 설명을 찾으십시오.


리뷰 4
Poller 54
524
Poller 54 2023.12.03 02:26 
 

Very useful indicator. Easy to spot supply and demand zones in the main window. Using it for scalping. Well working, even in the 1M Timeframe. Highly recommended, for that price!

Johan Julien Aubry
855
Johan Julien Aubry 2023.02.12 11:39 
 

Powerfull indicator, very cheap and with a lot of possibilities to customise settings. Can be used for entry points or to confirm other entries. Well documented and EA compatible. Jan is really helpful and very reactive. I totally recommend this product!

cubetrader33
639
cubetrader33 2022.11.08 02:28 
 

Best demand and supply indicator, recommended 100 %. For what it does the price is too low.

추천 제품
Hot Zones MT5
Innovicient Limited
This indicator simplifies your entry zones by displaying the areas where you can plan your entry that potentially could give you high risk/reward ratios. Other than picking the most optimal entry points, the Hot Zone indicator can act as your typical support/resistance indicator for pullbacks for all timeframes. You can use this indicator as the only trading indicator or use it with another indicator for reentry purposes.  Besides, when using Hot Zones, the risk/reward ratio should be well abov
Volume Trade Levels
Mahmoud Sabry Mohamed Youssef
The idea behind this indicator is very simple , First it contains 2 mechanisms to place your trades: 1- Enter the Pips you want to duplicate to price levels. 2- Automatically let the indicator specify the largest Buy / Sell Volume Candle and place duplicated levels based on the candle itself. How it works: 1- Enter the Pips you want to duplicate to price levels:    1- once the indicator is loaded you will need first to Specify the number of pips in the indicator Configuration window ,you can
Supply and Demand Monster
Tsog Erdene Borjigon Enkhkhudulmur
Supply and demand zones are at the heart of   supply and demand trading . These zones are areas that show  liquidity at a specific price.  The supply zone is also called the distribution zone, while the demand zone is called the accumulation zone.   Our indicator automatically draw supply and demand zones in Metatrader 5. It give opportunity to understand trading zone and avoiding risk.
Order Blocks are supply or demand zones in which big traders can find the comfort of placing large buy and sell orders and completing a big, very big transaction. Order blocks are a unique trading strategy that helps traders find a direction in the market. Usually, it allows traders to find out what financial institutions are planning to do in a particular market and better indicate the next price movement.
Marca Dagua
Erison Francisco De Sales
3 (1)
Adiciona marca d'água com nome do ativo em negociação. Pode ser ajustado definindo tamanho da fonte e coloração do texto. Testado com vários ativos do mercado B3 e Forex  Adione ao gráfico e configure de acordo com a necessidade. Caso tenha problemas sinta-se a-vontade para nos avisar e providenciaremos a correção logo que possível. ______________________________
FREE
Smart Drawing Assist PRO MT5
Raxkon Bin Kunang
5 (2)
Smart Drawing Assist PRO MT5. Buttons will appears next to the selected object. The buttons are straightforward and amazingly easy to use. Features are as follow: Draw zigzag . Enabling you to draw patterns, draw zigzag, and draw shapes. All you have to do is click the button and start clicking point to point and it will draw automatically. Change object color . Rectangle/Trendline/HLine/Vline/Text/Price Arrow/Arrowed Line/ and your suggestion please. Flatten trendline . make a perfect flat line
Indicator LTS for MT5 (Level + Trends + Speed) The LTS indicator was specially created for quick analysis of consolidations on the chart, which greatly facilitates decision-making when trading. LTS marks resistance and gives information about the forces affecting it, as well as the current speed and average travel. The indicator is easily customizable and can analyze any timeframe.    LTS uses a unique trend analysis algorithm based on 4 parameters from global to local.
PAM Scalper PRO FX
Jesper Christensen
4.71 (17)
PAM SCALPER (Price action momentum scalper) analyses historical price data to identify supply and demand zones where liquidity is high and enters with momentum of the institutional money flow. The EA extrapolates areas to either buy or sell from historical price action and volume data.  If you want to backtest this EA or any other scalper EA, you must use high quality tick data. The historical data your broker provides through MT5 will give inacurate test results. You can follow my guide how to
Standard Deviation Pivot Point will enhance your trading and highlight great trade opportunities with the Support and Resistance levels that professionals use based on volatility of market. Standard Deviation Pivot trading is a simple effective method for entry and finding targets that are statistically on your side, highlighting market key levels has been used by professionals for decades and is effective on all symbols: Forex, Crypto, Stocks, Indices. Standard deviation is a measurement if vol
Quarterly Cycles
Barend Paul Stander
Quarterly Cycles Quarterly Cycles is based on the Quarterly Theory developed by Daye (  traderdaye on X ). This is an aid to the user to find Cycles and it is NOT automatic detected, user can select AMDX or XAMD  in each Cycle and it will be visually drawn on the chart.  Quarterly Cycles:   Yearly, Monthly, Weekly, Daily, 6 Hour (90 minutes) –  Yearly Cycle : The year is divided in four sections of three months each Q1 - January, February, March Q2 - April, May, June Q3 - July, August, Sept
Fully-adjustable multi-layer Fibonacci strategies to suit any risk-appetite and trading styles| Built by a grid trader >> for grid traders.  This is MT5 version, click  here  for  Blue Onyx Pi MT4  (settings and logics are same in both versions)     Real monitoring signal   -->  (Coming soon) Intro BlueOnyx Pi EA   ('Onyx') is a next-gen   multi-currency    multi-timeframe  EA base on   multi-layer / cross-timeframe Fibonacci   indicator. There are options for both grid & no-grid trading to
The default input values are already optimized for EURUSD at time frame M1, spread at 14 and hedged account mode with leverage 1:100 and initial deposit of US$ 10,000, if you don't have this balance, I suggest you to use a CENT account. Always use the strategy tester optimization to set the best values for your assets, time frame, spread and account mode. It is very important and strongly recommended for successful trading. Optimize the input values as your needs.The EA's Strategy The Strategy T
Ultimate Supply Demand MT5
Ramon Sobrevals Arce
5 (4)
After working during many months, with the help of Neural Networks, we have perfected the ultimate tool you are going to need for identifying key price levels (Supports and Resistances) and Supply and Demand zones. Perfectly suitable to trigger your trades, set up your future actions, decide your Take Profit and Stop Loss levels, and confirm the market direction. Price will always move between those levels, bouncing or breaking; from one zone to another, all the remaining movements are just mark
Horizontal Level
Oleksii Ferbei
Horizontal Level indicator - reflects, using a histogram, the horizontal volumes of transactions at a certain price without reference to time. At the same time, the histogram appears directly in the terminal window, and each column of the volume is easily correlated with the quote value of the currency pair. The volume of transactions is of great importance in exchange trading, usually an increase in the number of concluded contracts confirms the trend, and their reduction indicates an imminent
This multi symbol indicator has been designed to automatically identify when price reaches major psychological levels. Also known as round numbers, whole numbers or key levels. As a bonus it can also scan for pivot point level on one selected time frame. Combined with your own rules and techniques, this indicator will allow you to create (or enhance) your own powerful system. Features Can write the signals to a file which can be used by an Expert Advisor for auto trading. Can monitor all symbols
Introduction The "Smart Money Concept" transcends the realm of mere technical trading strategies to embody a comprehensive philosophy on the dynamics of market operations. It posits that key market participants engage in price manipulation, thereby complicating the trading landscape for smaller, retail traders. Under this doctrine, retail traders are advised to tailor their strategies in alignment with the maneuvers of "Smart Money" - essentially, the capital operated by market makers
MinMax Levels MinMax Levels  –  은 중요한 거래 기간(일, 주, 월)의 최대, 최소 및 시가 수준을 나타내는 지표입니다. 각 Forex 시장 참가자는 거래 시스템에서 레벨을 사용합니다. 이는 거래를 위한 주요 신호일 수도 있고 분석 도구 역할을 하는 추가 신호일 수도 있습니다.  이 지표에서는 대규모 시장 참여자의 주요 거래 기간인 일, 주, 월을 중요한 기간으로 선택했습니다. 아시다시피 가격은 수준에서 수준으로 이동하며 중요한 수준과 관련된 가격 위치에 대한 지식은 거래 결정을 내리는 데 이점을 제공합니다.  편의를 위해 두 레벨 자체를 활성화 및 비활성화하고 버튼을 축소하여 가격 차트 작업 창에서 공간을 확보할 수 있는 버튼이 추가되었습니다.  각 Forex 시장 참가자는 거래 시스템에서 레벨을 사용합니다. 이는 거래를 위한 주요 신호일 수도 있고 분석 도구 역할을 하는 추가 신호일 수도 있습니다.  이 지표에서는 대규모 시장 참여자의 주요 거래
XCalper CandleTimer
Aecio de Feo Flora Neto
4.45 (20)
This auxiliary indicator displays time left before closing on the current timeframe with continuous update . It also shows the last trade price and variation from a previous day close in percentage and points. This indicator is pretty handy for daytraders and scalpers who want to precisely monitor closing and opening of candles. Indicator parameters Show in shifted end - Default: False. Display time and values on screen. If True, Displays only time to close aside last candle. Distance from the
FREE
The Inversion Fair Value Gaps (IFVG) indicator is based on the inversion FVG concept by ICT and provides support and resistance zones based on mitigated Fair Value Gaps (FVGs). Image 1   USAGE Once mitigation of an FVG occurs, we detect the zone as an "Inverted FVG". This would now be looked upon for potential support or resistance. Mitigation occurs when the price closes above or below the FVG area in the opposite direction of its bias. (Image 2) Inverted Bullish FVGs Turn into P
A probability of bankruptcy
Kiyoshi Mizu Miyabi Nori
This is a tool to estimate your probability of bankruptcy. features. estimate a probability of bankruptcy (Nauzer J. Balsara) from your trade history usually, it is small print and never interfere with trades alert in large prints and color when it exceed the alert level you can set parameters(i.e. winning ratio) fixed and simulate freely *1: this value is for reference only and is not guaranteed to occur.
FREE
--- StudentK Ict Smc Structure --- 1. Inner Circle Trading 2. Smart Money Concept 3. Structure --- What are included in tool --- 1. Market Session Box 2. Kill Zone 3. High/Low 4. Imbalance 5. FU Candle 6. Thicker Wick + Doji Candlestick 7. StudentK's Structure Line 8. Pivot Point --- Context --- StudentK is not indicated as a master or K Sir for knowledgeable person who claims for winning all the time. (But lots of traders should know the fact that it is rarely truth, especially
Fibonacci theft is an ultrascalping system that uses Fibonacci levels to launch a scalping system that allows theft   a few pips from the market. This system allows the use of fibonacci levels, predetermined levels or a level chosen by the user. It also presents the option of using or not volume and impulse filters. Being a very aggressive scalping system, it should only be used in pairs with a low spread and low commissions. This system is suitable for small accounts and can be used with onl
Binary Trader EA
Bright Lance Soli
Binary Trader EA   This EA is designed to trade synthetic indices Boom 1000 index & Crash 1000 index. Boom1000 index & Crash1000 index from volatility 75 index Please don't use the default settings, ask for proper settings and I will send you. This EA follows the trend. Can set risk as a percentage. Only tested on binary deriv broker indices.  Crash 1000 index spikes down, so to avoid that, we trade on a bigger timeframes, 1hr timeframe is perfect. Contact me if you have any questions. Recomme
The Martinware Market Sides' Strength indicator shows the candlestick chart in a different manner allowing for a clearer view of which side, bullish or bearish is dominating the asset in the current period. As a bonus, it can also show an internal area that can be used to visualize two levels of Fibonacci retracements inside the bars. The default configuration shows the MSS bars with 4 main colors, two representing the bullish force, and two representing the bearish one. The primary colors a
Somewhere over the rainbow It is a system that tries to operate the market from the exhaustion of the trend with a correction algorithm that tries to cut losses at the cost of increasing the margin This system makes all the adjustments automatically, analyzing the pair and the market to decide which is the most efficient step to reach your destination. Somewhere over the rainbow is a multiple trade and multi lot system(The maximum batch can be up to 5 times the initial batch distributed in mul
Ratio
Radim Kucera
3.67 (3)
This indicator shows ratios between extremes on the chart. You can specify your own ratios (e.g. Fibonacci). Parameters Most important Density - how much in details to search ratios in extremes. Bigger number means less details, smaller number means more details. Base unit is 1 bar on the chart. History - how far to go in history while searching. When you set -1, the indicator processes all bars from history. Base unit is 1 bar on the chart. Range - how far search ratios from given extreme. Ba
FREE
Trend ML
Andriy Sydoruk
Trend ML entry points should be used as potential market reversal points. The indicator works using the cyclic-wave dependence function. Thus, all entry points will be optimal points where the movement changes. The simplest way to use the indicator is to open a trade in the direction of an existing trend. The best result is obtained by combining the indicator with fundamental news, it can act as a news filter, that is, it can show how the market reacts to this or that news. A simple and con
FibExtender
Syed Oarasul Islam
This Indicator draws Fibonacci Extension levels in two different ways. You can select whether to draw Fibonacci Extension levels based on your favourite ZigZag settings or you can let the indicator to draw Fibonacci Extension  level based on given number of Bars or Candles.  You can also set Mobile and Email notification for your favourite Extension  levels individually. With this indicator you will not have to feel lonely as the it can generate Voice alerts, which will keep you focused on your
Legend Moving
Ignacio Agustin Mene Franco
Pack Dragon, Indicator 2/3 Legend Moving It has the barrier pass strategy as well seen in the photo, where there is a dot on the yellow line, when there is a downtrend, there are red dots when it falls giving perfect entries in short, the same when the market is bullish, it marks another navy blue line, where it gives perfect entries over the green dots for long , It is available for all seasons and for markets of Forex and synthetic indices !
이 제품의 구매자들이 또한 구매함
Atomic Analyst MT5
Issam Kassas
5 (14)
우선적으로 언급할 점은이 거래 지표가 다시 그리지 않고 지연되지 않으며 이를 통해 수동 및 로봇 거래 모두에 이상적이라는 점입니다. 사용자 매뉴얼: 설정, 입력 및 전략. Atomic Analyst는 가격의 강도와 모멘텀을 활용하여 시장에서 더 나은 이점을 찾는 PA Price Action Indicator입니다. 고급 필터를 장착하여 잡음과 거짓 신호를 제거하고 거래 잠재력을 높이는 데 도움이 됩니다. 복잡한 지표의 다중 레이어를 사용하여 Atomic Analyst는 차트를 스캔하고 복잡한 수학적 계산을 간단한 신호와 색상으로 변환하여 초보 트레이더가 이해하고 일관된 거래 결정을 내릴 수 있도록합니다. "Atomic Analyst"는 새로운 및 경험이 풍부한 트레이더를위한 종합적인 거래 솔루션입니다. 프리미엄 지표와 최고 수준의 기능을 하나의 거래 전략에 결합하여 모든 종류의 트레이더에 대한 다재다능한 선택지가되었습니다. 인트라데이 거래 및 스캘핑 전략 : 빠르고 정확한
우선 이 거래 시스템이 리페인팅, 리드로잉 및 레이그 인디케이터가 아니라는 점을 강조하는 것이 중요합니다. 이는 수동 및 로봇 거래 모두에 이상적인 것으로 만듭니다. 온라인 강좌, 설명서 및 프리셋 다운로드. "스마트 트렌드 트레이딩 시스템 MT5"은 새로운 및 경험이 풍부한 트레이더를 위해 맞춤형으로 제작된 종합적인 거래 솔루션입니다. 10개 이상의 프리미엄 인디케이터를 결합하고 7개 이상의 견고한 거래 전략을 특징으로 하여 다양한 시장 조건에 대한 다목적 선택이 가능합니다. 트렌드 추종 전략: 효과적인 트렌드 추이를 타기 위한 정확한 진입 및 손절 관리를 제공합니다. 반전 전략: 잠재적인 트렌드 반전을 식별하여 트레이더가 범위 시장을 활용할 수 있게 합니다. 스캘핑 전략: 빠르고 정확한 데이 트레이딩 및 단기 거래를 위해 설계되었습니다. 안정성: 모든 인디케이터가 리페인팅, 리드로잉 및 레이그가 아니므로 신뢰할 수 있는 신호를 보장합니다. 맞춤화: 개별 거래 선호도를 고려한 맞춤
Quantum Trend Sniper
Bogdan Ion Puscasu
4.91 (43)
소개       Quantum Trend Sniper Indicator는   추세 반전을 식별하고 거래하는 방식을 변화시키는 획기적인 MQL5 지표입니다! 13년 이상의 거래 경험을 가진 숙련된 트레이더 팀이 개발한       Quantum Trend Sniper 표시기       매우 높은 정확도로 추세 반전을 식별하는 혁신적인 방법으로 거래 여정을 새로운 차원으로 끌어올리도록 설계되었습니다. ***Quantum Trend Sniper Indicator를 구입하면 Quantum Breakout Indicator를 무료로 받을 수 있습니다!*** Quantum Trend Sniper Indicator는 추세 반전을 식별하고 세 가지 이익실현 수준을 제안할 때 경고, 신호 화살표를 제공합니다. 초보자 거래자와 전문 거래자 모두에게 적합합니다. Quantum EA 채널:       여기를 클릭하세요 MT4 버전:       여기를 클릭하세요
FX Power MT5 NG
Daniel Stein
5 (5)
모닝 브리핑 여기 mql5 와 텔레그램에서 FX Power MT5 NG 는 오랫동안 인기 있는 통화 강도 측정기인 FX Power의 차세대 버전입니다. 이 차세대 강도 측정기는 무엇을 제공합니까? 기존 FX Power에서 좋아했던 모든 것 PLUS GOLD/XAU 강도 분석 더욱 정밀한 계산 결과 개별 구성 가능한 분석 기간 더 나은 성능을 위한 사용자 정의 가능한 계산 한도 특별 멀티더 많은 것을보고 싶은 사람들을위한 특별한 다중 인스턴스 설정 모든 차트에서 좋아하는 색상을위한 끝없는 그래픽 설정 수많은 알림 옵션, 중요한 것을 다시는 놓치지 않도록 Windows 11 및 macOS 스타일의 둥근 모서리가 있는 새로운 디자인 마법처럼 움직이는 인디케이터 패널 FX 파워 키 특징 모든 주요 통화의 완전한 강세 이력 모든 시간대에 걸친 통화 강세 이력 모든 브로커 및 차트에서 고유 계산 결과 100% 신뢰할 수있는 실시간100 % 신뢰할 수있는 실시간 계산-> 다시 칠하지 않음
Gold Stuff mt5
Vasiliy Strukov
4.89 (178)
Gold Stuff mt5는 금을 위해 특별히 설계된 추세 지표이며 모든 금융 상품에서도 사용할 수 있습니다. 표시기가 다시 그려지지 않고 지연되지 않습니다. 권장 기간 H1. 설정 및 개인 보너스를 받으려면 구매 후 즉시 저에게 연락하십시오!     강력한 지원 및 트렌드 스캐너 표시기의 무료 사본을 받으실 수 있습니다. 메시지를 보내주세요. 나!   설정 화살표 그리기 - 켜기 끄기. 차트에 화살표 그리기. 경고 - 가청 경고를 끕니다. 이메일 알림 - 켜기 끄기. 이메일 알림. Puch-notification - 켜기 끄기. 푸시 알림. 다음으로 색 영역을 조정합니다. Gold Stuff mt5는 금을 위해 특별히 설계된 추세 지표이며 모든 금융 상품에서도 사용할 수 있습니다. 표시기가 다시 그려지지 않고 지연되지 않습니다. 권장 기간 H1. 설정 및 개인 보너스를 받으려면 구매 후 즉시 저에게 연락하십시오!   설정 화살표 그리기 - 켜기 끄기. 차트에
TPSpro RFI Levels MT5
Roman Podpora
5 (8)
Reversal First Impulse levels (RFI)      INSTRUCTIONS        RUS       -       ENG              R ecommended to use with an indicator   -   TREND PRO -  Version MT4                 A key element in trading is zones or levels from which decisions to buy or sell a trading instrument are made. Despite attempts by major players to conceal their presence in the market, they inevitably leave traces. Our task was to learn how to identify these traces and interpret them correctly. Main functions:: Di
Trend Screener Pro MT5
STE S.S.COMPANY
4.88 (64)
트렌드 표시기, 트렌드 트레이딩 및 필터링을 위한 획기적인 고유 솔루션, 하나의 도구 안에 내장된 모든 중요한 트렌드 기능! Forex, 상품, 암호 화폐, 지수 및 주식과 같은 모든 기호/도구에 사용할 수 있는 100% 다시 칠하지 않는 다중 시간 프레임 및 다중 통화 표시기입니다. Trend Screener는 차트에 점이 있는 화살표 추세 신호를 제공하는 효율적인 지표 추세 추종 지표입니다. 추세 분석기 표시기에서 사용할 수 있는 기능: 1. 트렌드 스캐너. 2. 최대 이익 분석이 있는 추세선. 3. 추세 통화 강도 측정기. 4. 경고가 있는 추세 반전 점. 5. 경고가 있는 강력한 추세 점. 6. 추세 화살표 Trend Screener Indicator가 있는 일일 분석 예, 일일 신호 성능...등은 여기에서 찾을 수 있습니다. 여기를 클릭하십시오. LIMITED TIME OFFER : Trend Screener Indicator는 50$ 및 평생 동안만 사용할 수 있습니다
우선적으로, 이 거래 도구는 전문적인 거래에 이상적인 비-다시 그리기 및 지연되지 않는 지표입니다.  온라인 강좌, 사용자 매뉴얼 및 데모. 스마트 가격 액션 컨셉트 인디케이터는 신규 및 경험 많은 트레이더 모두에게 매우 강력한 도구입니다. Inner Circle Trader Analysis 및 Smart Money Concepts Trading Strategies와 같은 고급 거래 아이디어를 결합하여 20가지 이상의 유용한 지표를 하나로 결합합니다. 이 인디케이터는 스마트 머니 컨셉트에 중점을 두어 대형 기관의 거래 방식을 제공하고 이동을 예측하는 데 도움을 줍니다.  특히 유동성 분석에 뛰어나 기관이 어떻게 거래하는지 이해하는 데 도움을 줍니다. 시장 트렌드를 예측하고 가격 변동을 신중하게 분석하는 데 탁월합니다. 귀하의 거래를 기관 전략에 맞추어 시장의 동향에 대해 더 정확한 예측을 할 수 있습니다. 이 인디케이터는 시장 구조를 분석하고 중요한 주문 블록을 식별하
FX Volume MT5
Daniel Stein
4.94 (17)
모닝 브리핑을 통해 세부 정보와 스크린샷으로 매일 시장 업데이트를 받으세요 여기 mql5 및 텔레그램에서 FX 거래량은 브로커의 관점에서 시장 심리에 대한 실제 통찰력을 제공하는 최초이자 유일한 거래량 지표입니다. 브로커와 같은 기관 시장 참여자가 외환 시장에서 어떤 포지션을 취하고 있는지에 대한 훌륭한 통찰력을 COT 보고서보다 훨씬 빠르게 제공합니다. 차트에서 이 정보를 직접 확인하는 것은 트레이딩의 진정한 판도를 바꾸고 획기적인 솔루션입니다. 다음과 같은 고유한 시장 데이터 인사이트의 이점 비율 는 통화의 매수/매도 포지션 비율을 백분율로 표시 비율 변화 는 선택한 기간 내 매수 비율과 비율 변화를 표시 총 거래량 는 해당 통화의 총 거래량(롱 및 숏)을 로트 단위로 보여줍니다 Volumes Long 는 해당 통화의 모든 롱 포지션의 거래량을 보여줍니다 Volumes Short 는 해당 통화의 모든 숏 포지션의 거래량을 보여줍니다 Net Long 는 순 롱 포지션의 거래량
TPSproTREND PrO MT5
Roman Podpora
4.88 (8)
TPSpro TRENDPRO  - is a trend indicator that automatically analyzes the market and provides information about the trend and each of its changes, as well as giving signals for entering trades without redrawing! The indicator uses each candle, analyzing them separately. referring to different impulses - up or down impulse. Exact entry points into transactions for currencies, crypto, metals, stocks, indices!  -  Version MT4               DETAILED DESCRIPTION               R ecommended to use with
Entry Points Pro for MT5
Yury Orlov
4.55 (159)
다시 색을 칠하지 않고 거래에 진입할 수 있는 정확한 신호를 제공하는 MT5용 지표입니다. 외환, 암호화폐, 금속, 주식, 지수 등 모든 금융 자산에 적용할 수 있습니다. 매우 정확한 추정값을 제공하고 매수와 매도의 가장 좋은 시점을 알려줍니다. 하나의 시그널로 수익을 내는 지표의 예와 함께 비디오 (6:22)시청하십시오! 대부분의 거래자는 Entry Points Pro 지표의 도움으로 첫 거래 주 동안 트레이딩 결과를 개선합니다. 저희의   Telegram Group 을 구독하세요! Entry Points Pro 지표의 좋은점. 재도색이 없는 진입 신호 신호가 나타나고 확인되면(시그널 캔들이 완성된 경우) 신호는 더 이상 사라지지 않습니다. 여타 보조지표의 경우 신호를 표시한 다음 제거되기 때문에 큰 재정적 손실로 이어집니다. 오류 없는 거래 게시 알고리즘을 통해 트레이드(진입 또는 청산)를 할 이상적인 순간을 찾을 수 있으며, 이를 통해 이를 사용하는 모든 거래자의
FxaccurateLS
Shiv Raj Kumawat
WHY IS OUR FXACCCURATE LS MT5 THE PROFITABLE ? PROTECT YOUR CAPITAL WITH RISK MANAGEMENT Gives entry, stop and target levels from time to time. It finds Trading opportunities by analyzing what the price is doing during established trends. POWERFUL INDICATOR FOR A RELIABLE STRATEGIES We have made these indicators with a lot of years of hard work. It is made at a very advanced level. Established trends provide dozens of trading opportunities, but most trend indicators completely ignore them!
AW Trend Predictor MT5
AW Trading Software Limited
4.78 (58)
하나의 시스템에서 추세와 고장 수준의 조합입니다. 고급 지표 알고리즘은 시장 노이즈를 필터링하고 추세, 진입점 및 가능한 출구 수준을 결정합니다. 표시기 신호는 통계 모듈에 기록되어 가장 적합한 도구를 선택하여 신호 기록의 효율성을 보여줍니다. 이 표시기는 이익 실현 및 손절매 표시를 계산합니다. 매뉴얼 및 지침 ->   HERE   / MT4 버전 ->   HERE 지표로 거래하는 방법: Trend Predictor로 거래하는 것은 3단계로 간단합니다. 1단계 - 포지션 열기 70% 이상의 성공률로 매수 신호를 받았습니다. 2단계 - StopLoss 결정 반대 신호로 트렁크 선택 3단계 - 이익 실현 전략 정의 전략 1: TP1 도달 시 전체 포지션 청산 전략 2: TP1 도달 시 포지션의 50% 청산 및 TP2 도달 시 나머지 50% 청산 전략 3: 추세 반전 시 전체 포지션 청산 이익: 결과를 다시 그리지 않음, 신호는 엄격하게 양초가 닫힐 때 어드바이저에서 사용할 수 있습니
ICT, SMC, SMART MONEY CONCEPTS, SMART MONEY, Smart Money Concept, Support and Resistance, Trend Analysis, Price Action, Market Structure, Order Blocks, BOS/CHoCH,   Breaker Blocks ,  Momentum Shift,   Supply&Demand Zone/Order Blocks , Strong Imbalance,   HH/LL/HL/LH,    Fair Value Gap, FVG,  Premium  &   Discount   Zones, Fibonacci Retracement, OTE, Buy Side Liquidity, Sell Side Liquidity, BSL/SSL Taken, Equal Highs & Lows, MTF Dashboard, Multiple Time Frame, BigBar, HTF OB, HTF Market Structure
Bill Williams Advanced
Siarhei Vashchylka
5 (5)
Bill Williams Advanced is designed for automatic chart analysis using Bill Williams' "Profitunity" system. The indicator analyzes four timeframes at once. Manual (Be sure to read before purchasing) Advantages 1. Automatically analyzes the chart using the "Profitunity" system of Bill Williams. The found signals are placed in a table in the corner of the screen. 2. Equipped with a trend filter based on the Alligator indicator. Most of the system signals are recommended to be used only accordi
Volume by Price MT5
Brian Collard
5 (4)
The Volume by Price Indicator for MetaTrader 5 features Volume Profile and Market Profile TPO (Time Price Opportunity). Volume and TPO histogram bar and line charts. Volume Footprint charts. TPO letter and block marker collapsed and split structure charts. Session filtering and grouping. Static, dynamic and flexible range segmentation and compositing methods with relative and absolute visualizations. Graphical layering, positioning and styling options to suit the user's analytic and aesthetic n
Legacy of Gann for MT5
Pavel Zamoshnikov
5 (6)
The indicator very accurately determines the levels of the possible end of the trend and profit fixing. The method of determining levels is based on the ideas of W.D.Gann, using an algorithm developed by his follower Kirill Borovsky. Extremely high reliability of reaching levels (according to K. Borovsky  - 80-90%) Indispensable for any trading strategy – every trader needs to determine the exit point from the market! Precisely determines targets on any timeframes and any instruments (forex, met
"Piranha" - an autonomous trading system that determines overbought and oversold levels on the chart. Red and blue zones represent overbought and oversold levels respectively. Entry points are marked with arrows: a downward arrow in the red zone for "sell" and an upward arrow in the blue zone for "buy". The Take profit level is indicated by the green moving average. Key features: Adjusting the Take profit level as the green moving average changes position. Averaging ability when a new market e
Quantum Heiken Ashi PRO MT5
Bogdan Ion Puscasu
4.5 (8)
시장 동향에 대한 명확한 통찰력을 제공하도록 설계된 Heiken Ashi 양초는 노이즈를 필터링하고 잘못된 신호를 제거하는 기능으로 유명합니다. 혼란스러운 가격 변동에 작별을 고하고 더 매끄럽고 신뢰할 수 있는 차트 표현을 만나보세요. Quantum Heiken Ashi PRO를 정말 독특하게 만드는 것은 전통적인 촛대 데이터를 읽기 쉬운 색상 막대로 변환하는 혁신적인 공식입니다. 빨간색과 녹색 막대는 각각 약세와 강세 추세를 우아하게 강조하여 잠재적 진입점과 퇴장점을 매우 정확하게 파악할 수 있습니다. Quantum EA 채널:       여기를 클릭하세요 MT4 버전:       여기를 클릭하세요 이 놀라운 지표는 다음과 같은 몇 가지 주요 이점을 제공합니다. 선명도 향상: Heiken Ashi 바는 가격 변동을 완화하여 시장 추세를 보다 명확하게 나타내므로 유리한 거래 기회를 쉽게 식별할 수 있습니다. 소음 감소: 종종 잘못된 신호로 이어지는 불규칙한 가격 변동
Advanced Supply Demand MT5
Bernhard Schweigert
4.53 (15)
현재 33% 할인! 초보자나 전문 트레이더를 위한 최고의 솔루션! 이 보조지표는 우리가 다수의 독창적 기능과 새로운 공식을 통합한 독특하고 고품질이며 저렴한 거래 도구입니다. 이 업데이트를 통해 이중 시간대를 표시할 수 있습니다. 더 높은 TF를 표시할 수 있을 뿐만 아니라 차트 TF와 더 높은 TF 모두를 표시할 수 있습니다: 중첩 영역 표시. 모든 Supply Demand 트레이더들이 좋아할 것입니다. :) 중요한 정보 공개 Advanced Supply Demand의 잠재력을 극대화하려면 다음을 방문하십시오. https://www.mql5.com/ko/blogs/post/720245   진입 또는 목표의 명확한 트리거 포인트를 정확히 찾아냄으로 해서 거래가 어떻게 개선될지 상상해 보십시오. 새로운 알고리즘을 기반으로 매수자와 매도자 간의 잠재적인 불균형을 훨씬 더 쉽게 분간할 수 있습니다. 왜냐하면 가장 강한 공급영역과 가장 강한 수요 영역과 과거에 어떻게 진행 되었는지를(이
Gartley Hunter Multi
Siarhei Vashchylka
5 (7)
Gartley Hunter Multi - An indicator for searching for harmonic patterns simultaneously on dozens of trading instruments and on all possible timeframes. Manual (Be sure to read before purchasing) | Version for MT4 Advantages 1. Patterns: Gartley, Butterfly, Shark, Crab. Bat, Alternate Bat, Deep Crab, Cypher 2. Simultaneous search for patterns on dozens of trading instruments and on all possible timeframes 3. Search for patterns of all possible sizes. From the smallest to the largest 4. A
TPA True Price Action indicator reveals the true price action of the market makers through 100% non-repainting signals strictly at the close of a candle! TPA shows entries and re-entries, every time the bulls are definitely stronger than the bears and vice versa. Not to confuse with red/green candles. The shift of power gets confirmed at the earliest stage and is ONE exit strategy of several. There are available now two free parts of the TPA User Guide for our customers. The first "The Basics"
Advanced Currency Strength28 MT5
Bernhard Schweigert
5 (1)
초보자 또는 전문가 트레이더를 위한 최고의 솔루션! 이 지표는 우리가 독점 기능과 새로운 공식을 통합했기 때문에 독특하고 고품질이며 저렴한 거래 도구입니다. 단 하나의 차트로 28 Forex 쌍의 통화 강도를 읽을 수 있습니다! 새로운 추세 또는 스캘핑 기회의 정확한 트리거 포인트를 정확히 찾아낼 수 있기 때문에 거래가 어떻게 개선될지 상상해 보십시오. 사용 설명서: 여기를 클릭  https://www.mql5.com/en/blogs/post/697384 그것이 첫 번째, 원본입니다! 쓸모없는 지망생 클론을 사지 마십시오. 더 스페셜  강력한 통화 모멘텀을 보여주는 하위 창의 화살표 GAP가 거래를 안내합니다! 기본 또는 호가 통화가 과매도/과매도 영역(외부 시장 피보나치 수준)에 있을 때 개별 차트의 기본 창에 경고 표시가 나타납니다. 통화 강도가 외부 범위에서 떨어질 때 풀백/반전 경고. 교차 패턴의 특별 경고 추세를 빠르게 볼 수 있는 다중 시간 프레임 선택
이 대시보드는 선택한 심볼에 대해 사용 가능한 최신 고조파 패턴을 표시하므로 시간을 절약하고 더 효율적으로 사용할 수 있습니다 /   MT4 버전 . 무료 인디케이터:   Basic Harmonic Pattern 인디케이터 열 Symbol :   선택한 심볼이 나타납니다 Trend :   강세 또는 약세 Pattern :   패턴 유형(가틀리, 나비, 박쥐, 게, 상어, 사이퍼 또는 ABCD) Entry :   진입 가격 SL:   스톱로스 가격 TP1:   1차 테이크프로핏 가격 TP2:   2차 테이크프로핏 가격 TP3:   3차 테이크프로핏 가격 Current price:   현재 가격 Age (in bars):   마지막으로 그려진 패턴의 나이 주요 입력 Symbols :   "28개 주요 통화쌍" 또는 "선택한 심볼" 중에서 선택합니다. Selected Symbols :   쉼표로 구분하여 모니터링하려는 원하는 심볼("EURUSD,GBPUSD,XAUUSD")
MTF Supply Demand Zones MT5
Georgios Kalomoiropoulos
자동화된 수요 및 공급 구역의 차세대. 모든 차트에서 작동하는 새롭고 혁신적인 알고리즘. 모든 구역은 시장의 가격 움직임에 따라 동적으로 생성됩니다. 두 가지 유형의 경고 --> 1)가격이 영역에 도달할 때 2)새로운 영역이 형성될 때 당신은 더 이상 쓸모없는 지표를 얻을 수 없습니다. 입증된 결과로 완벽한 거래 전략을 얻을 수 있습니다.     새로운 기능:     가격이 공급/수요 영역에 도달하면 경고     새로운 공급/수요 구역이 생성되면 알림     푸시 알림 알림     핍의 영역 너비 레이블     기동특무부대에 한 번 더 시간이 주어집니다. 따라서 현재보다 위의 2개의 시간 프레임 대신 현재보다 높은 3개의 시간 프레임을 볼 수 있습니다.     Alerts/Zones/MTF 기능을 활성화/비활성화하는 버튼 당신이 얻는 이점:     거래에서 감정을 제거하십시오.     거래 항목을 객
AW Prime Oscillator MT5
AW Trading Software Limited
두 개의 오실레이터의 조합. 첫 번째 항목은 진입점을 표시하고 두 번째 항목은 현재 추세를 표시합니다. 표시기는 두 가지 모드의 화살표로 오실레이터 신호를 표시할 수 있습니다. 모든 빠른 오실레이터 신호 또는 현재 추세 방향의 신호만 표시할 수 있습니다. 다중 시간대 패널과 세 가지 유형의 신호 알림이 있습니다. 이익: 일일 및 스캘핑 거래에 적합 추세 필터링 간단하고 민감한 설정 다중 시간대 패널 Advisor에 통합하는 데 적합합니다. 모든 기호 및 기간에서 작동합니다. 세 가지 유형의 알림 MT4 버전 ->   여기   / 문제해결 ->   여기 지표 전략 표시기는 두 개의 서로 다른 오실레이터로 구성됩니다. 느린 추세선(두꺼움) - 지표의 고수준이 위에서 아래로 교차하면 하락세 지표이고, 낮은 수평 수준(지표의 낮은 수준)이 아래에서 위로 교차하면 하락 추세 지표입니다. 상승 경향. 또한, 하단 영역에서 느린 선을 발견하면 현재 추세가 하락세임을 나타내고, 반대로 상단 영역
Introducing the South African Sniper indicator created by a small group of traders with a few years trading trading the financial market profitably . This is a plug and play indicator that provides you with  BUY and SELL (SNIPER ENTRY) signals with TARGET and trail stops. The indicator Works with all MT5 trading instruments. The indicator uses previous  chart data as receipt to speculate on future market moves.  "The South African Sniper indicator community are very happy with the indicator an
Owl Smart Levels MT5
Sergey Ermolov
4.38 (37)
MT4 버전  |  FAQ Owl Smart Levels Indicator 는 Bill Williams 의 고급 프랙탈, 시장의 올바른 파동 구조를 구축하는 Valable ZigZag, 정확한 진입 수준을 표시하는 피보나치 수준과 같은 인기 있는 시장 분석 도구를 포함하는 하나의 지표 내에서 완전한 거래 시스템입니다. 시장과 이익을 취하는 장소로. 전략에 대한 자세한 설명 표시기 작업에 대한 지침 고문-거래 올빼미 도우미의 조수 개인 사용자 채팅 ->구입 후 나에게 쓰기,나는 개인 채팅에 당신을 추가하고 거기에 모든 보너스를 다운로드 할 수 있습니다 힘은 단순함에 있습니다! Owl Smart Levels 거래 시스템은 사용하기 매우 쉽기 때문에 전문가와 이제 막 시장을 연구하고 스스로 거래 전략을 선택하기 시작한 사람들 모두에게 적합합니다. 전략 및 지표에는 눈에 보이지 않는 비밀 공식 및 계산 방법이 없으며 모든 전략 지표는 공개되어 있습니다. Owl Smart Levels를
초보자 또는 전문가 트레이더를 위한 최고의 솔루션! 이 지표는 우리가 독점 기능과 비밀 공식을 통합했기 때문에 독특하고 고품질이며 저렴한 거래 도구입니다. 단 하나의 차트로 28개 통화 쌍 모두에 대한 경고를 제공합니다. 새로운 추세 또는 스캘핑 기회의 정확한 트리거 포인트를 정확히 찾아낼 수 있기 때문에 거래가 어떻게 개선될지 상상해 보십시오! 새로운 기본 알고리즘을 기반으로 구축되어 잠재적인 거래를 훨씬 더 쉽게 식별하고 확인할 수 있습니다. 이는 통화의 강세 또는 약세가 가속되는지 여부를 그래픽으로 표시하고 가속 속도를 측정하기 때문입니다. 자동차의 속도계처럼 생각하면 됩니다. 가속화할 때 Forex 시장에서 동일한 일이 분명히 더 빠르게 발생합니다. 즉, 반대 방향으로 가속화되는 통화를 페어링하면 잠재적으로 수익성 있는 거래를 식별한 것입니다. 통화 모멘텀의 수직선과 화살표가 거래를 안내합니다! 역동적인 Market Fibonacci 23 레벨은 경고 트리거로 사
AW Breakout Catcher MT5
AW Trading Software Limited
5 (9)
가격 수준 분석, 고급 통계, TakeProfit 계산 및 3가지 유형의 알림. 이익: 결과를 다시 그리지 마십시오 촛불이 닫힐 때 엄격하게 신호를 보냅니다. 거짓 고장 필터링 알고리즘 어떤 트렌드 전략과도 잘 어울립니다. 모든 도구 및 시계열에서 작동 매뉴얼 및 지침 ->   HERE   / 문제 해결 ->   HERE   / MT4 버전 ->   HERE 지표로 거래하는 방법 AW Breakout Catcher와 거래하는 간단한 3단계: 1단계 - 포지션 열기 70% 이상의 성공률로 매수 신호를 받았습니다. 2단계 - StopLoss 결정 반대 신호로 트렁크 선택 3단계 - 이익 실현 전략 정의 전략 1: TP1 도달 시 전체 포지션 청산 전략 2: TP1 도달 시 포지션의 50% 청산 및 TP2 도달 시 나머지 50% 청산 전략 3: 반대 신호에서 전체 포지션 청산 통계 모듈 더 나은 쌍 선택을 위해 내장된 통계 계산을 사용하십시오. 거래 계산 - 통계가 제공되는 총 신호 수
제작자의 제품 더 보기
Divergence dashboard
Jan Flodin
5 (10)
I recommend you to read the   product's blog  (manual) from start to end so that it is clear from the beginning what the indicactor offers. This multi time frame and multi symbol divergence dashboard indicator sends an alert when one or two different divergences have been identified. It can be used with all time frames from M1 to MN. It is possible to enable moving average or RSI trend filter to filter out only the strongest setups. Combined with your own rules and techniques, this indicator wi
The indicator identifies when a divergence occurs between price and an indicator or oscillator. It identifies both regular and hidden divergences. Combined with your own rules and techniques, this indicator will allow you to create (or enhance) your own powerful system. Features Can detect divergences for the following oscillators/indicators:   MACD, OsMA, Stochastics, RSI, CCI, RVI, Awesome, ADX, ATR, OBV, Composite index, MFI and Momentum. Only one oscillator/indicator can be selected. Draws
FREE
I recommend you to read the   product's blog  (manual) from start to end so that   it is clear from the beginning what the indicator offers. This multi oscillator, multi time frame and multi symbol indicator identifies when a divergence occurs between price and an oscillator/indicator. It identifies both regular/classical (trend reversal) and hidden (trend continuation) divergences. It has moving average, RSI/Bollinger, ADX, pin bar and engulfing filter options which makes it possible to filter
This multi time frame and multi symbol indicator identifies high-probability breakout patterns. It does this by identifying strong, symmetrical pennants and triangles. This pattern DOES NOT appear very often on higher time frames. But when it does, it is a very high-probability setup. The indicator also includes an Inside bars scanner. It can for example be used to detect a special type of Inside bars formation which is formed by a Master candle (MC) followed by 4 inside candles (please see the
이 다중 시간 프레임 및 다중 기호 표시기는 이중 상단/하단, 머리 및 어깨, 페넌트/삼각형 및 플래그 패턴을 식별합니다. 또한 네크라인/삼각형/깃대 이탈이 발생한 경우에만 경고를 설정하는 것도 가능합니다(넥라인 이탈 = 상단/하단 및 헤드&숄더에 대한 확인된 신호).       지표는 단일 차트 모드에서도 사용할 수 있습니다. 이 옵션에 대한 자세한 내용은 제품의       블로그   . 고유한 규칙 및 기술과 결합하여 이 표시기를 사용하면 자신만의 강력한 시스템을 생성(또는 강화)할 수 있습니다. 특징 Market Watch 창에 표시되는 모든 기호를 동시에 모니터링할 수 있습니다. 하나의 차트에만 지표를 적용하고 전체 시장을 즉시 모니터링하십시오. M1에서 MN까지 모든 시간 프레임을 모니터링할 수 있으며 패턴이 식별되거나 중단될 때 실시간 경고를 보냅니다. 모든 Metatrader 기본 경고 유형이 지원됩니다. RSI를 추세 필터로 사용하여 잠재적 반전을 적절히 식별할 수
I recommend you to read the  product's blog  (manual) from start to end so that it is clear from the beginning what the indicator offers. This multi time frame and multi symbol supply and demand zone dashboard indicator sends alerts when the price has reached a supply/demand zone. It is also possible to use it to be alerted about regular double tops/bottoms instead of zones. It can be used with all time frames from M1 to MN. Maximum 9 time frames can be shown in the dashboard at the same time. 
Features This is an indicator that recognizes a special type of Inside Bar formation which is formed by a Master candle followed by 4 smaller candles (please see the strategy explanation below). Plots buy/sell stop lines on the chart as well as well as take profit and stop loss levels. The TP/SL levels are based on the Average True Range (ATR) indicator. Object colors are changeable. Sends you a real-time alert when a Master candle formation is identified - sound / pop-up / email / push notifica
This indicator recognizes a special type of Inside Bar formation which is formed by a big Master candle followed by 4 smaller candles (please see the strategy explanation below). Features Plots buy/sell stop lines on the chart as well as well as take profit and stop loss levels. The TP/SL levels are based on the Average True Range (ATR) indicator. Object colors are changeable. Sends you a real-time alert when a Master candle formation is identified - sound / popup / email / push notification. On
Please if possible consider the  paid version  which I will continue to develop (there will be no future updates for this free version). This Expert Advisor identifies when a divergence occurs between price and an oscillator/indicator. It identifies both regular/classical (trend reversal) and hidden (trend continuation) divergences. It has RSI, bollinger, stochastics, moving average and ADX filter options which makes it possible to filter out only the strongest setups. The default settings ar
FREE
I recommend you to read the   product's blog  (manual) from start to end so that it is clear from the beginning what the indicactor offers. This multi time frame and multi symbol divergence dashboard indicator sends an alert when one or two different divergences have been identified. It can be used with all time frames from M1 to MN. Maximum 9 time frames can be shown in the dashboard at the same time. It is possible to enable moving average, RSI or Bollinger bands trend filter to filter out on
The indicator identifies when a divergence occurs between price and an indicator or oscillator. It identifies bullish and bearish hidden or regular (classical) divergences. Combined with your own rules and techniques, this indicator will allow you to create (or enhance) your own powerful system. Features Can detect divergences for the following indicators/oscillators: MACD, OsMA (Moving average of Oscillator), Stochastics, RSI, CCI, RVI, Awesome (AO), ADX, ATR, OBV, MFI, Momentum and   Composi
FREE
This indicator can send alerts when a Heiken Ashi Smoothed color change occurs. Combined with your own rules and techniques, this indicator will allow you to create (or enhance) your own powerful system. Features Can send all types of alerts. Option to delay the alert one or more bars in order to confirm the color (trend) change. Input parameters Candle shift for alert: Default is 1. Setting it to 0 will alert you on color change on the current candle. This should be regarded as a pending (uncon
FREE
This indicator can send alerts when a Heiken Ashi Smoothed color change occurs. Combined with your own rules and techniques, this indicator will allow you to create (or enhance) your own powerful system. Features Can send all types of alerts. Option to delay the alert one bar in order to confirm the color (trend) change. Input parameters Wait for candle close: 'true' or 'false'. Setting it to 'true' will delay the alert to the opening of the bar following the bar where the color change occurred.
FREE
이 다중 시간 프레임 및 다중 기호 표시기는 다음 5개의 십자가를 식별할 수 있습니다. 빠른 이동 평균이 느린 이동 평균 라인을 교차할 때. 가격이 단일 이동 평균에 도달했을 때(위/아래로 마감 또는 방금 반등). 삼중 이동 평균 형성이 나타날 때(연속 정렬의 모든 3 MA:s) MACD 메인 라인이 신호 라인을 교차할 때. 신호선이 MACD 영(0)선을 교차할 때. 고유한 규칙 및 기술과 결합하여 이 표시기를 사용하면 강력한 시스템을 생성(또는 강화)할 수 있습니다. 특징 Market Watch 창에 표시되는 선택된 기호를 동시에 모니터링할 수 있습니다. 하나의 차트에만 지표를 적용하고 전체 시장을 즉시 모니터링하십시오. M1에서 MN까지 모든 시간 프레임을 모니터링할 수 있으며 크로스오버가 식별되면 실시간 경고를 보냅니다. 모든 경고 유형이 지원됩니다. RSI를 추가 추세 필터로 사용할 수 있습니다. 표시기는 대화형 패널을 포함합니다. 항목을 클릭하면 해당 기호와 기간이 포함된
가능하면 구매를 고려하십시오       계속해서 개발할   MT5 버전   입니다(이 MT4 버전에 대한 향후 업데이트는 없을 예정입니다). 나는 또한 당신이 읽을 것을 권장합니다       제품의 블로그   (매뉴얼)를 처음부터 끝까지 검토하여 EA가 제공하는 것을 처음부터 명확하게 합니다. 이 EA(Expert Advisor)의 주요 전략은 3개의 이동 평균(MA)이 연속적으로 정렬되고 서로 일정한 거리에 있을 때 거래를 하는 것입니다(예를 들어 일부 기관 거래자가 사용하는 잘 알려지지 않은 전략에 사용할 수 있음) , D1 시간 프레임의 MA 10, 20 및 30 포함). EA는 H1 및 더 큰 시간 프레임에서 가장 잘 작동합니다. 삼중 MA 전략(어떤 MA가 사용되든 상관없음)은 장기 전략으로 간주되어야 합니다. 나쁜 달이 연속으로 있을 수 있습니다. 따라서 이 EA는 단기간에 빈번한 거래와 지속적인 이익을 찾는 거래자를 위한 것이 아닙니다. 기본 설정은 EURUSD H1에
I recommend you to read the   product's blog  (manual) from start to end so that it is clear from the beginning what the indicactor offers. This multi time frame and multi symbol supply and demand zone dashboard indicator sends alerts when the price has reached a supply/demand zone. It is also possible to use it to be alerted about regular double tops/bottoms instead of zones. It can be used with all time frames from M1 to MN. It is possible to use RSI, divergence (MACD, OsMA, RSI or Awesome) a
나는 당신이 읽을 것을 권합니다       제품의 블로그   (설명서)를 처음부터 끝까지       EA가 제공하는 것은 처음부터 분명합니다. 이 EA(Expert Advisor)의 주요 전략은 3개의 이동 평균(MA)이 연속적으로 정렬되고 서로 일정한 거리에 있을 때 거래를 하는 것입니다(예를 들어 일부 기관 거래자가 사용하는 잘 알려지지 않은 전략에 사용할 수 있음) , D1 시간 프레임의 MA 10, 20 및 30 포함). EA는 H1 및 더 큰 시간 프레임에서 가장 잘 작동합니다. 삼중 MA 전략(어떤 MA가 사용되든 상관없음)은 장기 전략으로 간주되어야 합니다. 나쁜 달이 연속으로 있을 수 있습니다. 따라서 이 EA는 단기간에 빈번한 거래와 지속적인 이익을 찾는 거래자를 위한 것이 아닙니다. 기본 설정은 EURUSD H1에 최적화되어 있습니다(2015.01.01 - 2022.12.29, 224 거래, 이는 주당 평균 0,52 거래를 의미함).   여기에서   신호 모니터링
I recommend you to read the   product's blog  (manual) from start to end so that it is clear from the beginning what the indicactor offers. This multi time frame and multi symbol indicator identifies double or triple top/bottom formations or a following neckline breakout (confirmed top/bottom). It offers filters for RSI overbought/oversold, candle patterns (pin bar, engulfing, tweezer, morning/evening star, three line strike) and divergences (MACD, OsMA, Awesome (AO), RSI, CCI, Stochastic) whic
This multi indicator/oscillator (hereafter indicator), multi time frame and multi symbol indicator identifies when a divergence occurs between price and one, two or three indicators. It identifies both regular/classical (trend reversal) and hidden (trend continuation) divergences. It has RSI and MA trend filter options which makes it possible to filter out only the strongest setups. Combined with your own rules and techniques, this indicator will allow you to create (or enhance) your own powerfu
이 다중 시간 프레임 및 다중 기호 표시기는 핀 막대, 아침/저녁 별, 인글핑, 핀셋, 쓰리 라인 스트라이크, 내부 막대 및 페넌트 및 삼각형을 스캔합니다.   지표는 단일 차트 모드에서도 사용할 수 있습니다. 이 옵션에 대한 자세한 내용은 제품의       블로그   .       고유한 규칙 및 기술과 결합하여 이 표시기를 사용하면 자신만의 강력한 시스템을 생성(또는 강화)할 수 있습니다. 특징 Market Watch 창에 표시되는 모든 기호를 동시에 모니터링할 수 있습니다. 하나의 차트에만 지표를 적용하고 전체 시장을 즉시 모니터링하십시오. M1에서 MN까지 모든 시간대를 모니터링하고 패턴이 식별되면 실시간 경고(팝업, 푸시 또는 메일)를 보냅니다. RSI 및 볼린저 밴드를 핀 바, 아침/저녁 별   , 인글프잉 및 핀셋 형성   에 대한 필터로 사용하여 잠재적 반전을 적절하게 식별할 수 있습니다. 이동 평균을 주요 추세 필터로 사용하고 ADX를 변동성 필터로 사용할 수 있습
Trend dashboard MT5
Jan Flodin
5 (2)
I recommend you to read the   product's blog  (manual) from start to end so that it is clear from the beginning what the indicactor offers. This multi time frame and multi symbol trend indicator sends an alert when a strong trend or trend reversal has been identified. It can do so by selecting to build up the dashboard using Moving average (single or double (both MA:s aligned and price above/below both)), RSI, Bollinger bands, ADX, Composite index (Constance M. Brown), Awesome (Bill Williams), 
Chart patterns scanner
Jan Flodin
4.67 (6)
I  recommend you to read the   product's blog  (manual) from start to end so that it is clear from the beginning what the indicator offers. This multi time frame and multi symbol indicator identifies double top/bottom, head & shoulders, pennant/triangle and flag patterns. It is also possible to setup alerts only when a neckline/triangle/flagpole breakout has occured (neckline breakout = confirmed signal for top/bottoms and head & shoulders).  The indicator can also be used in single chart mode.
지표는 가격과 오실레이터/지표 사이에 다이버전스가 발생하는 시점을 식별합니다. 그것은 규칙적인 발산과 숨겨진 발산을 모두 식별합니다. 가장 강력한 설정만 필터링할 수 있는 RSI 필터 옵션이 있습니다. 지표는 또한 Engulfing 대형, Donchian 채널 돌파 또는 가격이 이동 평균을 넘을 때까지 기다릴 수 있는 옵션을 제공합니다   (스크린샷 #3 참조)       거래 기회를 알리기 전에 다이버전스를 확인합니다. 고유한 규칙 및 기술과 결합하여 이 표시기를 사용하면 자신만의 강력한 시스템을 생성(또는 강화)할 수 있습니다. 특징 의 끝에서       제품의 블로그       지표에서 거래 신호를 검색하기 위해 iCustom() 함수를 사용하는 예제 EA(전문가 고문)의 소스 코드를 다운로드할 수 있습니다. EA가 완벽하게 작동하더라도 주요 목적은 코드를 사용하여 자신이 개발한 EA에 붙여넣는 것입니다.   내 제한된 시간을 감안할 때       하지만 프로그래밍 지원은
강세 및 약세 3선 스트라이크 형성을 찾는 것 외에도 이 다중 기호 및 다중 시간 프레임 표시기는 다음 촛대 패턴을 스캔할 수도 있습니다(패턴 설명은 스크린샷 참조). 백병 3명(역전>연속 패턴) 검은 까마귀 3마리(역전>연속 패턴) 지표 설정의 엄격한 옵션이 활성화된 경우 대형은 더 높은 시간 프레임에 자주 나타나지 않습니다. 그러나 그렇게 할 때 그것은 매우 높은 가능성의 설정입니다. Thomas Bulkowski(국제적으로 알려진 촛대 패턴의 저자이자 선도적인 전문가)에 따르면 Three line strike는 모든 촛대 패턴의 전체 성능 순위가 가장 높습니다. 고유한 규칙 및 기술과 결합하여 이 표시기를 사용하면 강력한 시스템을 생성(또는 강화)할 수 있습니다. 특징 Market Watch 창에 표시되는 모든 기호를 동시에 모니터링할 수 있습니다. 하나의 차트에만 지표를 적용하고 전체 시장을 즉시 모니터링하십시오. M1에서 MN까지 모든 시간 프레임을 모니터링할 수 있으며 패
Averaging down EA
Jan Flodin
5 (1)
This cost averaging Expert advisor (EA) places additional trades in the same direction as the original (manually opened) order when the price goes against you. It can be used as a grid system or as pure martingale system (exponential increasing of lot size) or smoothed martingale (for instance linear increasing of the lot size). Due to the risk involved, this EA is more suitable for intermediate to advanced traders who are well aware of how to handle risk management and trading an already profit
This multi time frame and multi symbol indicator alerts about Heiken Ashi Smoothed color changes. As a bonus it can also scan for Hull Moving Average trend (color) changes. Combined with your own rules and techniques, this indicator will allow you to create (or enhance) your own powerful trading system. Features Can monitor all symbols visible in your Market Watch window at the same time. Apply the indicator to just one chart and instantly monitor the entire market. Can monitor every time frame
I recommend you to read the   product's blog  (manual) from start to end so that it is clear from the beginning what the indicactor offers. This multi time frame and multi symbol indicator scans for pin bars. Combined with your own rules and techniques, this indicator will allow you to create (or enhance) your own powerful system. Features Can monitor all symbols visible in your Market Watch window at the same time. Apply the indicator to just one chart and instantly monitor the entire market.
This multi time frame and multi symbol indicator scans for pin bars. Combined with your own rules and techniques, this indicator will allow you to create (or enhance) your own powerful system. Features Can monitor all symbols visible in your Market Watch window at the same time. Apply the indicator to just one chart and instantly monitor the entire market. Can monitors every time frame, from M1 to MN, and sends you a real-time alert when a pin bar is identified. All Metatrader native alert types
I  recommend you to read the   product's blog  (manual) from start to end so that it is clear from the beginning what the indicator offers. This multi time frame and multi symbol indicator scans for engulfing and tweezer formations. The indicator can also be used in single chart mode. Combined with your own rules and techniques, this indicator will allow you to create (or enhance) your own powerful system. Features Can monitor all symbols visible in your Market Watch window at the same time. Ap
This multi time frame and multi symbol indicator scans for Pin bars, Morning/Evening stars, Engulfings, Tweezers, Three line strikes, Inside bars and Pennants and Triangles. The indicator can also be used in single chart mode. Please read more about this option in the product's blog . Combined with your own rules and techniques, this indicator will allow you to create (or enhance) your own powerful system. Features Can monitor all symbols visible in your Market Watch window at the same time. Ap
필터:
ZERO9898
1841
ZERO9898 2024.01.25 12:24 
 

사용자가 평가에 대한 코멘트를 남기지 않았습니다

Poller 54
524
Poller 54 2023.12.03 02:26 
 

Very useful indicator. Easy to spot supply and demand zones in the main window. Using it for scalping. Well working, even in the 1M Timeframe. Highly recommended, for that price!

Johan Julien Aubry
855
Johan Julien Aubry 2023.02.12 11:39 
 

Powerfull indicator, very cheap and with a lot of possibilities to customise settings. Can be used for entry points or to confirm other entries. Well documented and EA compatible. Jan is really helpful and very reactive. I totally recommend this product!

cubetrader33
639
cubetrader33 2022.11.08 02:28 
 

Best demand and supply indicator, recommended 100 %. For what it does the price is too low.

리뷰 답변
버전 1.7 2024.01.22
*** IMPORTANT - Please always make a backup of the existing indicator (the .ex5 file) before you make the update ***

This is not a mandatory update. Please only update if you are experiencing problems with the indicator after the new Metatrader build 4150
버전 1.6 2023.04.21
*** IMPORTANT - Please always make a backup of the existing indicator (the .ex5 file) before you make the update ***

Change log:
- various bug fixes in the divergence detection mechanism
- added Three line strike to the list of candle patterns
- fixed an issue with the morning/evening star candle patter scanning
- added Bollinger bands filter as an alternative to RSI
- added a new type of alert when price is close to (approaching) a zone. ATR or points can be used as offset value
버전 1.5 2023.04.06
*** IMPORTANT - please always make a backup of the existing indicator (the .ex5 file) before you make an update ***

Change log:
- fixed an issue with the drawing of trend lines when supply/demand was disabled (regular top/bottoms only)
버전 1.4 2023.02.11
*** IMPORTANT - please always make a backup of the existing indicator (the .ex5 file) before you make an update ***

Change log:
- bug fixe
버전 1.3 2023.02.07
*** IMPORTANT - please always make a backup of the existing indicator (the .ex5 file) before you make an update ***

Change log:
- various bug fixes
버전 1.2 2023.02.06
*** IMPORTANT - please always make a backup of the existing indicator (the .ex5 file) before you make an update ***

Change log:
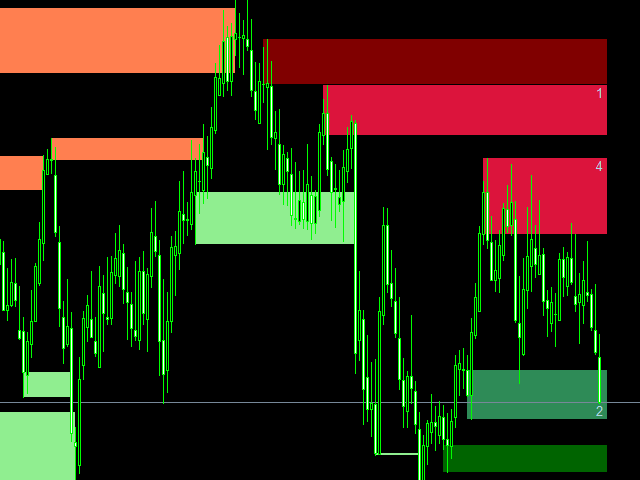
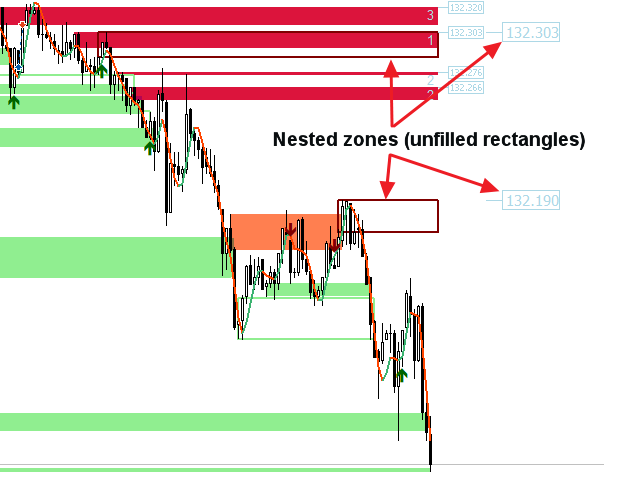
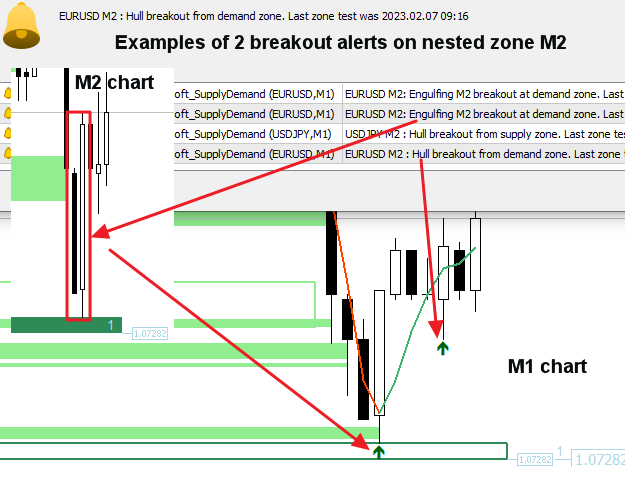
- added support for one nested zone (zone on other time frame than the current)
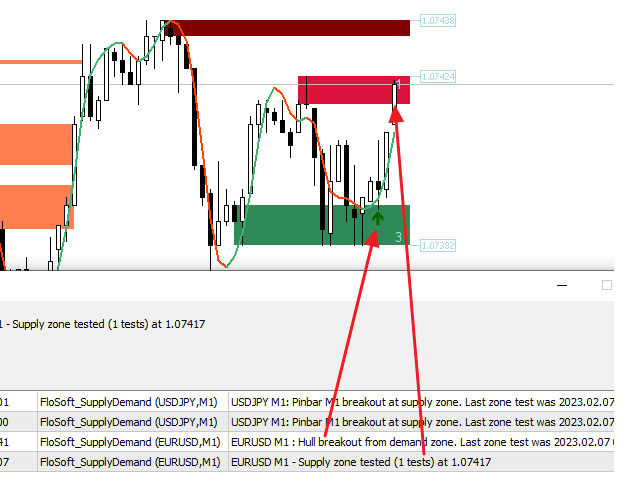
- added reverse breakout logic from zone based on Hull moving average color change and/or 4 different candle patterns. An alert will be sent and an arrow drawn on the chart
- removed the non functional option to use the RSI filter on the second extremum (at zone test)
- price raised from $30 to $49
버전 1.1 2022.02.23
- bug fix