Andhadhun
- 지표
- Vitalii Zakharuk
- 버전: 1.0
- 활성화: 5
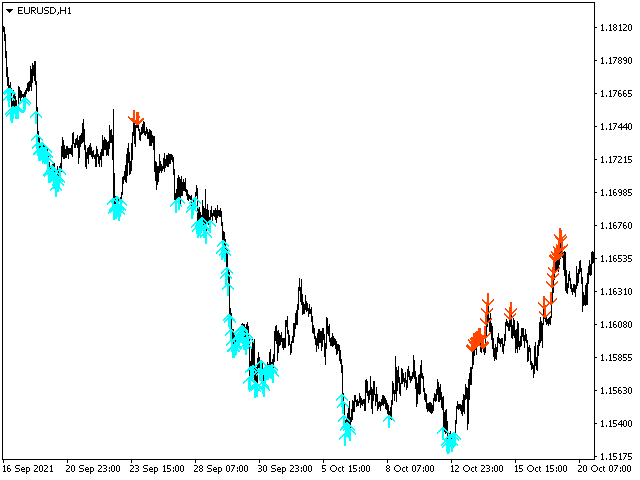
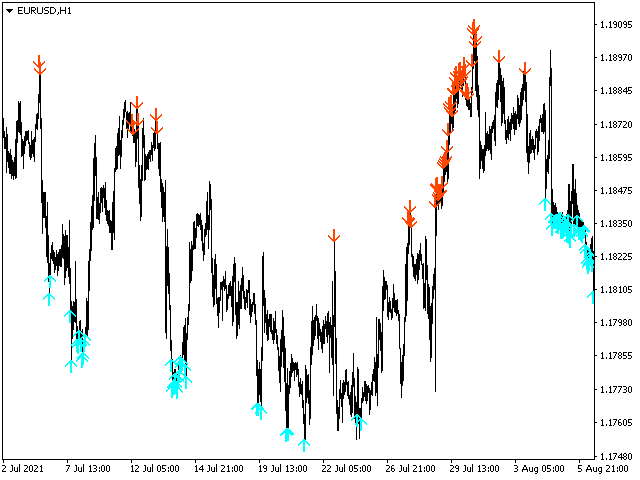
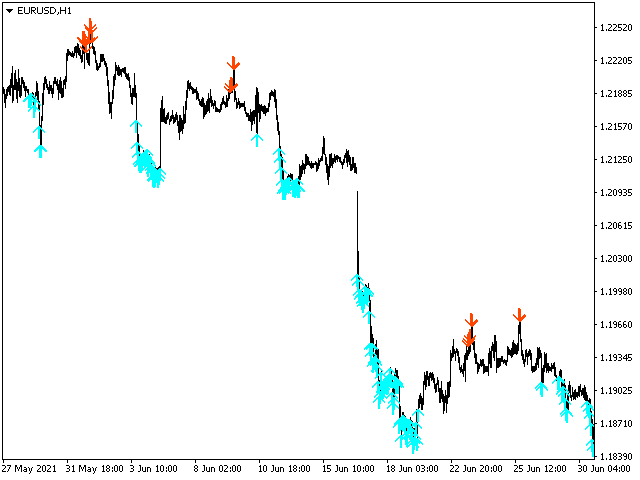
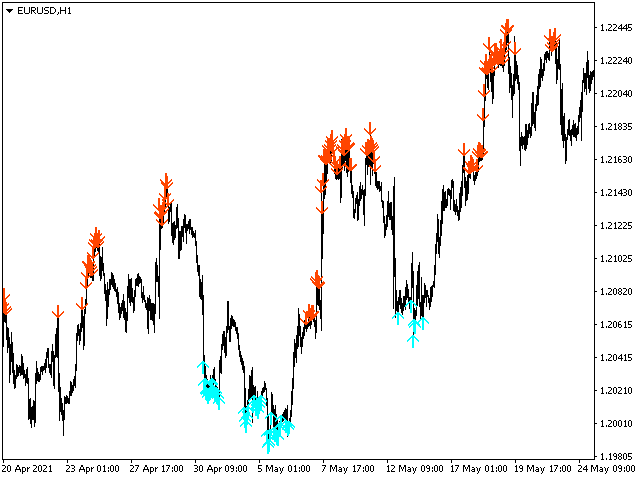
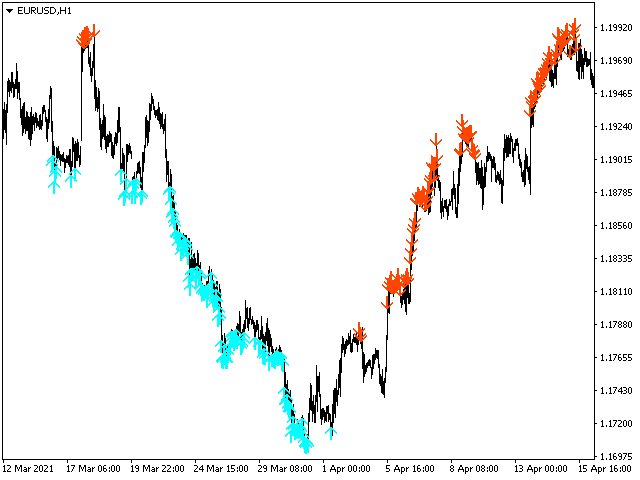
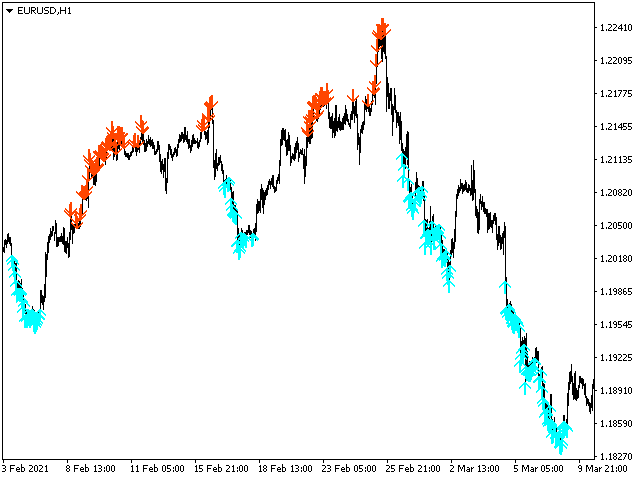
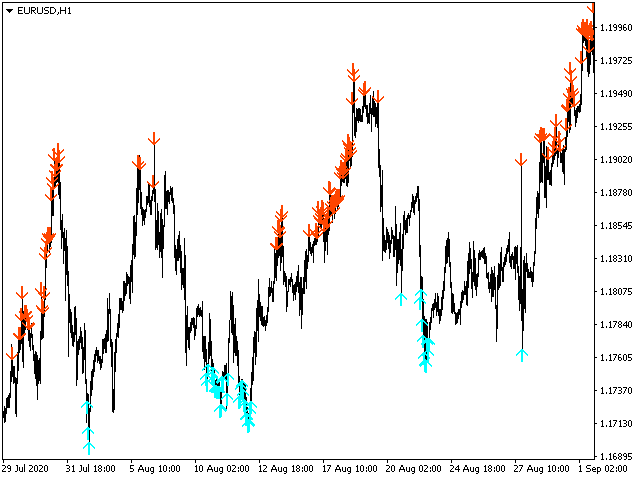
The Andhadhun trend step indicator will give you stability if you follow his signals. And you will be able to distinguish between work and the emotional component. It basically uses the process of identifying the rate of change in price growth and allows you to find entry and exit points from the market. Just look at the screenshots and you will determine the principles of working with the indicator yourself.
The indicator analyzes the state of the market, the phase of its movement and largely determines the success of a trader in his difficult work. Displays on the chart the expected price reversal points in the direction of the existing trend after the correction. It is based on the use of built-in algorithm data. As soon as the value of the algorithm falls into the overbought or oversold zone, and the current trend is confirmed, the Andhadhun indicator draws an arrow on the chart in the direction of the expected further price movement.
Indicator parameters:
- yCount - Number of bars of the main calculation.
- xPeriod - Period for correction. Pay attention to this option.
To get the correct entry points, it is recommended:
- Select the indicator parameters for each traded currency pair and the corresponding timeframe;
- First, receive a signal on a higher timeframe (say, on an hourly one), then wait for a similar signal on a younger one (say, fifteen minutes).

