Supply Demand Dashboard MT5
- 지표
- Jan Flodin
- 버전: 1.8
- 업데이트됨: 18 11월 2023
- 활성화: 10
I recommend you to read the product's blog (manual) from start to end so that it is clear from the beginning what the indicator offers.
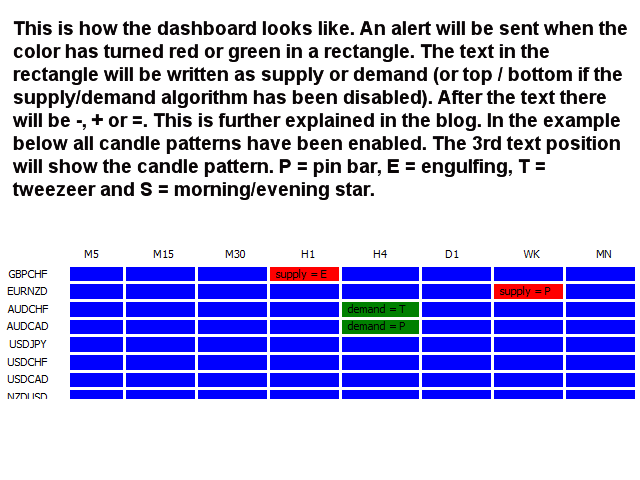
This multi time frame and multi symbol supply and demand zone dashboard indicator sends alerts when the price has reached a supply/demand zone. It is also possible to use it to be alerted about regular double tops/bottoms instead of zones. It can be used with all time frames from M1 to MN. Maximum 9 time frames can be shown in the dashboard at the same time. It is possible to use the following reverse breakout strategies in order to filter out only the strongest setups:
- RSI
- Divergence (MACD, OsMA, Stochastics, RSI, CCI or Awesome)
- Candle patterns (pin bar, engulfing, tweezer, morning/evening star and three line strike)
- Hull moving average (color change at supply/demand).
Combined with your own rules and techniques, this indicator will allow you to create (or enhance) your own powerful system.
At the end of the product's blog you will be able to download the source code of an example Expert Advisor (EA) which is using the iCustom() function to get the trade signals from the indicator. Even though the EA is fully functional, the main purpose is to use the code and paste it into your own developed EA or add your own additional entry/exit logic into this EA. Given my limited time I will not be able to provide with any programming support. My apologies.
Features
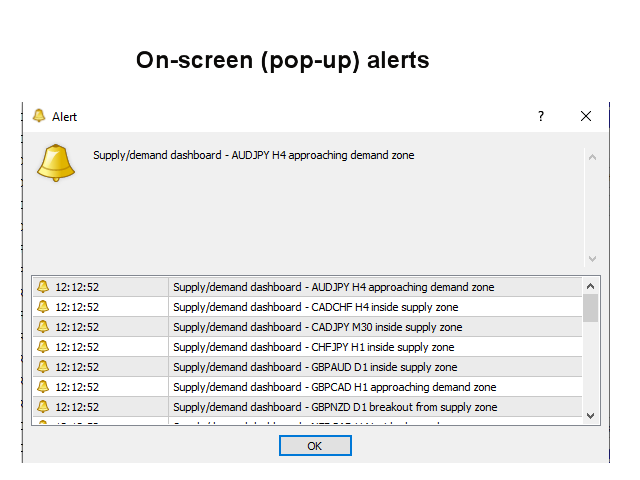
- It is enough to place the indicator on one chart and you will receive an alert from any new signal appearing in the dashboard. All Metatrader native alert types are supported.
- Continuously performs a rank sorting within the dashboard. It is possible to disable this sorting though to make it easier finding a specific symbol. The symbols will then be visible in the same order as they have been entered in the Symbols parameter or in the order they are visible in the Market Watch window.
- By clicking inside a rectangle a new chart will be opened with the symbol and time frame in question. The zone (or top/bottom line) will be drawn on this chart.
- The indicator can write the signals to global variables which can be used by an Expert Advisor for auto trading.
Input parameters
Please find the description and explanation of the input parameters here.
Important
The indicator must be put on a M5 chart, a clean (empty) chart without any other indicators or Expert Advisors on it which could interfere with the dashboard. Please also note that this indicator is not supported in the strategy tester. For this purpose you can use the Expert Advisor mentioned above, or download a demo of the single chart version of this indicator.
very good product and very good customer service