Gartley Hunter MT4
- 지표
- Siarhei Vashchylka
- 버전: 1.8
- 업데이트됨: 21 4월 2024
- 활성화: 10
Manual (Be sure to read before purchasing) | Version for MT5
Advantages
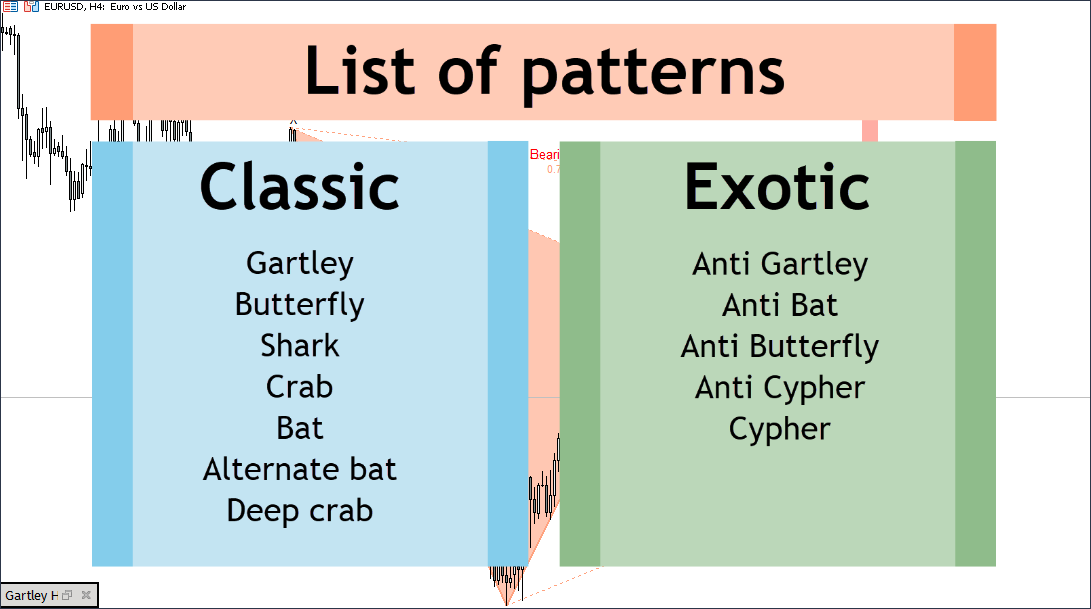
1. 12 harmonic patterns: 7 classical and 5 exotic. New patterns will be added as the indicator develops.
2. Constant automatic search for harmonic patterns. The indicator is capable of finding from the smallest to the largest patterns.
3. Automatic search for pattern projections. A projection is a potential pattern that may form in the future.
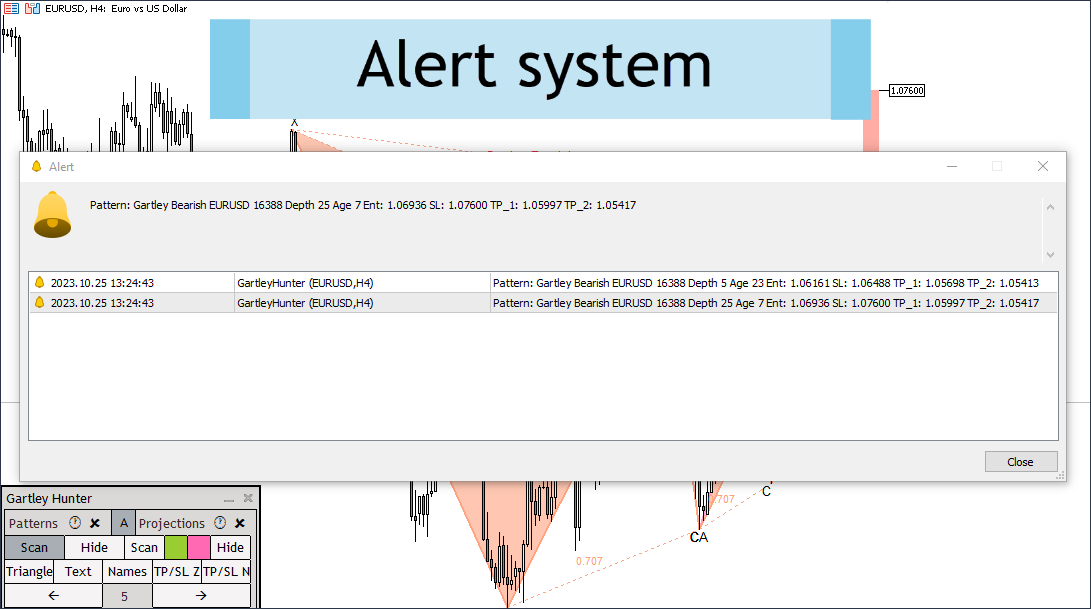
4. Stop Loss and Take Profit levels. To the right of each pattern are targets for entering and exiting a trade.
5. Detailed pattern customization system. You can add and remove various pattern elements in a few clicks.
Author: Siarhei Vashchylka. For any questions, write to me in private messages. I also recommend subscribing to my updates. To do this, follow the link to my profile and click "Add to friends".


Отличная программа, спасибо разработчикам.