• 미리보기
  • 리뷰 (8)
  • 코멘트
  • 새 소식

Lows And Highs

5

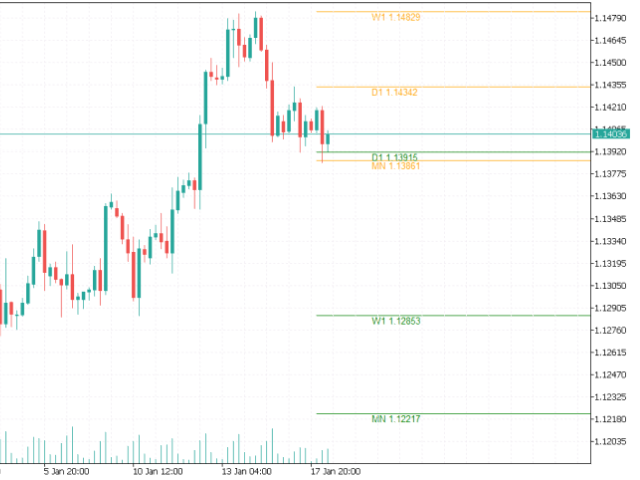
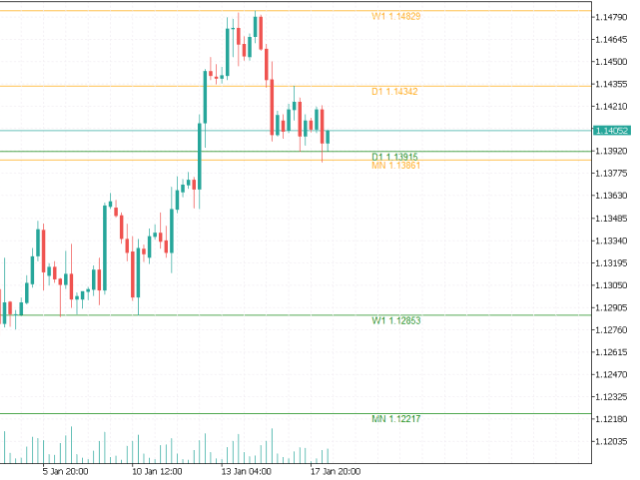
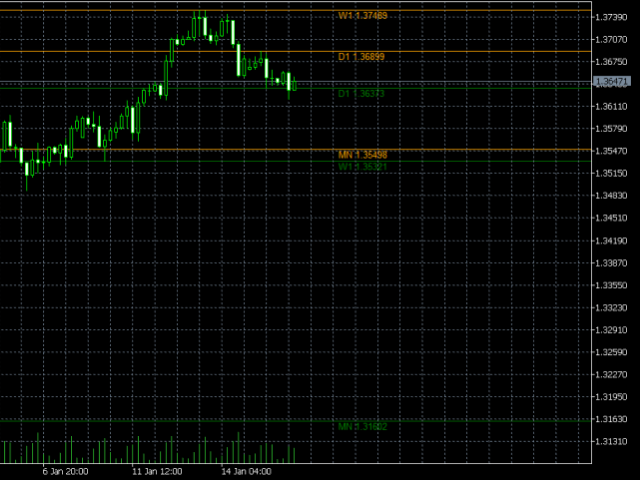
This indicator draws the highest and the lowest prices of the previous periods on the chart. And If you want, Indicator can alert you when the current price arrives these levels.

For example: If you are watching the H1 timeframe, Indicator shows you the  lowest and the highest prices of H4, D1, W1 and M1 periods. So you don't need to open the other periods of chart windows.

Alert Options: Send Mobil Message, Send E-mail, Show Message, Sound Alert

Time Periods: M1, M5, M15, M30, H1, H2, H3, H4, H6, H8, H12, D1, W1, MN
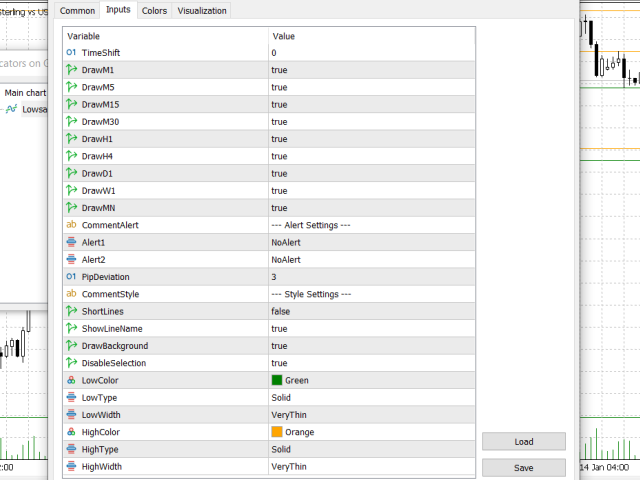
Inputs: 

  • TimeShift: You can set start hour for calculating. And that way you can see levels independently from broker server's time-zone.
  • PipDeviation: You can set price sensibility for alert (Default: 3)
  • Lines: You can chose short line or horizontal line for showing prices
  • Style: You can change line's style (Color, Width, Type)


리뷰 8
simon.metivier
71
simon.metivier 2024.04.02 13:37 
 

Hello Ali, Thanks for the indicator, it works great. I only can't seem to use the time shift, I am trying to start my H4 candle at custom time, but it doesn't seem to work when adding input 1 to 12 for time shift in Hour. Am-I correct?

valdecism
128
valdecism 2022.12.06 21:13 
 

Amazing indicator! Could the line names be only M1, H1, D1 an so on? And could the line values be highlighted in the price area? In my screen when 2 TF'S have the same value, I can't read it. Thanks in advance. Regards!

Detleff Böhmer
2652
Detleff Böhmer 2022.03.11 16:36 
 

Der Indikator arbeitet sehr genau, gute Arbeit.

추천 제품
Candle Timer Simple
Jithin Sajan Sajan
SETTINGS Make sure to select Chart shift option in the chart.   (Right click in the chart ---> Properties (dialog box) ----> Select Chart Shift) Kindly rate and comment about the product for upgradation & Support When using candlestick timers, keep in mind that the timing of candlestick patterns can play a crucial role in your trading strategy. For instance, different timeframes (such as 1-minute, 5-minute, hourly, ) can provide varying insights into price movements and trends. Make sure t
FREE
La **Media Móvil de Tercera Generación (TGMMA)** es una versión avanzada del indicador estándar de **Media Móvil (MA)**. Fue descrita por primera vez por Manfred G. Dürschner en su artículo "Gleitende Durchschnitte 3.0" (en alemán). Aquí están las características clave de la TGMMA: 1. **Reducción del Retraso**:    - A diferencia de las MAs tradicionales, la TGMMA reduce significativamente el retraso. Se adapta más rápidamente a los cambios de precios, lo que la hace ideal para traders que bus
FREE
Pivot Reversal Free
Fyodor Korotkov
5 (3)
Hi there! Since I am starting commercial and non-commercial product publishing I would highly appreciate: If you like this product, please rate it. That will help to promote not only this product, but indirectly another ones. So, such promotion will help to make some money from commercial products. Thus, I will have opportunity to fund my another directions of trading researches like bot development using mql4 and mql5 programming languages as well as python written products like crypto bots. If
FREE
Steady Bands3
Roberto Tavares
Equidistant bands indicator with calculated moving average, allows you to configure the band size and can be used freely as an entry / exit indicator. Buffer 0 = price, buffer 1 = upper band, buffer 2 = lower band. you can also configure the periods of moving averages used in the calculations and also the shift to previous bars in addition to the price that can CLOSE (default) or OPEN. Excellent for fast daily moving pairs and frequent returns.
FREE
No Wick On Close
Flavio Javier Jarabeck
5 (1)
We at Minions Labs love to study, challenge and discover new facts about Price Behavior in current markets. We would NOT call it Price Action because today this is a word totally overused and means, thanks to the False Prophets out there, absolutely NOTHING. The study hypothesis we propose is this: Some Assets, in certain Timeframes, present a behavior of Price continuity when the candlesticks close without a Wick on them... So the purpose of this indicator is to "color" those candlesticks wh
FREE
QuantumAlert Stoch Navigator is a free indicator available for MT4/MT5 platforms, its work is to provide "alerts" when the market is inside "overbought and oversold" regions in the form of "buy or sell" signals. This indicator comes with many customization options mentioned in the parameter section below, user can customise these parameters as needful. Join our   MQL5 group , where we share important news and updates. You are also welcome to join our private channel as well, contact me for the p
FREE
Strong movement levels
Nikolay Mitrofanov
5 (2)
Looks for strong price movements and draws levels upon their completion. You determine the strength of the movement yourself by specifying in the settings the number of points and the number of candles of the same color in a row in one direction. There are 2 types of building in the settings: extrenum - high / low close - close price You can also adjust the number of displayed levels and the number of candles for calculations. By default, the settings indicate 5 levels for 360 candles.
FREE
Super Trend eu
Emin Ulucanli
4.75 (4)
SUPERTREND; It is a trend following indicator based on the SuperTrend ATR created by Olivier Seban. It can be used to detect changes in trend direction and locate stops. When the price falls below the indicator curve, it turns red and indicates a downtrend. Conversely, when the price moves above the curve, the indicator turns green, indicating an uptrend. Like other indicators, it works well on SuperTrend when used in conjunction with other indicators such as MACD, parabolik SAR, Bollinger Band
FREE
Reversal Composite Candles
MetaQuotes Ltd.
3.5 (24)
The idea of the system is to indentify the reversal patterns using the calculation of the composite candle. The reversal patterns is similar to the "Hammer" and "Hanging Man" patterns in Japanese candlestick analysis. But it uses the composite candle instead the single candle and doesn't need the small body of the composite candle to confirm the reversal. Input parameters: Range - maximal number of bars, used in the calculation of the composite candle. Minimum - minimal size of the composite can
FREE
Rejection Zones
Paulo Henrique Faquineli Garcia
Este poderoso indicador analisa o gráfico e mostra zonas de Rejeição de Preços! Isto é, locais onde o preço foi, mas não foi aceito pelo mercado! A visualização desta zona de Rejeição, facilita o entendimento do trader na tomada de decisões de onde operar e como operar! O indicador é composto por 4 linhas, sendo classificadas em 2 grupos: Linhas Vermelha e Amarela: Denotam os extremos onde o preço conseguiu chegar, mas não foi aceito! Linhas Laranja e Azul: A partir delas, denotam o Início da
FREE
SSFX supply and demand
Emr Aljnaby
4.25 (8)
This indicator automatically identifies demand and supply zones on a number of 1000 candles or more, and you can change that number of settings.  It also carries a high level of accuracy in describing the type of each zone, as it contains: Weak areas . Untested areas . Strong areas . Role-taking areas . Areas tested + number of times visited . Areas to which a return is expected, depending on the direction . The indicator contains alert zones. For signals and more free indicators, you ca
FREE
Stackable VWAP
Flavio Javier Jarabeck
3.33 (6)
Volume Weighted Average Price (VWAP) is a trading benchmark commonly used by Big Players that gives the average price a Symbol has traded throughout the day. It is based on both Volume and price. Additionally we put in this indicator the MVWAP (Moving Volume Weighted Average Price). For those who do not know the usage and the importance od this indicator I recommend a great article about this subject at Investopedia ( https://www.investopedia.com/articles/trading/11/trading-with-vwap-mvwap.asp
FREE
Cybele CFD MT5
Evren Caglar
5 (10)
Cybele: The Less is More Do you ever think, if you really need to open many positions to make mo ney? Or have you ever thought that it could be better to open one position to make $80 instead of opening 80 positions to make $80.  Which is better for you?  In the first trading approach you take the risk only one time in a good quality trade setup. In the second approach, you take the risk 80 times in low quality trade setups. The most professional traders prefer the first approach and they patie
FREE
To get access to MT4 version please click   here . This is the exact conversion from TradingView: "Hammer & ShootingStar Candle Detector" by "MoriFX". This is a light-load processing and non-repaint indicator. All input options are available.  Buffers are available for processing in EAs. You can message in private chat for further changes you need. Thanks.
FREE
MIDAS Super VWAP
Flavio Javier Jarabeck
4.29 (14)
Imagine VWAP, MVWAP and MIDAS in one place... Well, you found it! Now you can track the movement of Big Players in various ways, as they in general pursue the benchmarks related to this measuring, gauging if they had good execution or poor execution on their orders. Traders and analysts use the VWAP to eliminate the noise that occurs throughout the day, so they can measure what prices buyers and sellers are really trading. VWAP gives traders insight into how a stock trades for that day and deter
FREE
Max Hercules
Aaron Pattni
4.43 (7)
Get it FREE while you can! Will be increased to $100 very shortly after a few downloads!! Join my Discord and Telegram Channel - Max's Strategy For any assistance and help please send me a message here.    https://t.me/Maxs_Strategy https://discord.gg/yysxRUJT&nbsp ; The Max Hercules Strategy is a part of a cross asset market making strategy (Max Cronus) built by myself over years of analysis and strategy building. It takes multiple theories and calculations to trade the market in order to c
FREE
Max Poseidon
Aaron Pattni
4 (5)
Get it FREE while you can! Will be increased to $200 very shortly after a few downloads!! Join my Discord and Telegram Channel - Max's Strategy For any assistance and help please send me a message here.    https://t.me/Maxs_Strategy https://discord.gg/yysxRUJT&nbsp ; GBPUSD and EURUSD Set files can be found in the comments! (please message me if you need help with them) TimeFrames are harcoded, therefore any chart and time will work the same. The Max Poseidon Strategy is a part of a cross
FREE
Necessary for traders: tools and indicators Waves automatically calculate indicators, channel trend trading Perfect trend-wave automatic calculation channel calculation , MT4 Perfect trend-wave automatic calculation channel calculation , MT5 Local Trading copying Easy And Fast Copy , MT4 Easy And Fast Copy , MT5 Local Trading copying For DEMO Easy And Fast Copy , MT4 DEMO Easy And Fast Copy , MT5 DEMO The homeopathic indicator is also called the CCI indicator. The CCI indicator was propos
FREE
Supports And Resistances Lines
Francisco Gomes Da Silva
4.76 (41)
지원 및 저항 구역 표시기 MT5 이 표시기는 상단과 하단을 자동으로 식별하는 방법을 알고 있습니다. 이 지지선과 저항선 표시기는 상단과 하단을 기준으로 지지선과 저항선을 만듭니다. 지지선과 저항선을 만드는 방법. 자동 지지선과 저항선을 만드는 지표입니다. 지표로 지원 수준을 찾는 방법 이 표시기는 자동으로 상단과 하단을 찾습니다. 지그재그(ZigZag)가 자동으로 바닥을 생성하거나 새로운 바닥을 이전 바닥보다 낮게 만들 때마다 표시기가 자동으로 지지선을 생성하므로 표시기가 자동으로 화면에 자동 지지선을 그립니다. 저항선을 만드는 방법. 지그재그(ZigZag)가 새로운 최고점이나 최고점을 이전 최고점보다 높게 만들 때마다 표시기가 지지선을 생성하는 것과 같은 방식으로 자동으로 저항선을 생성하므로 표시기가 자동으로 새로운 저항을 생성하므로 사용자가 상단과 하단 레벨이 어디에 있는지 걱정해야 합니다. 이 지표는 트레이더가 차트에 지지와 저항을 표시할 수 있는 쉬운 방법입니다. 상단 표시
FREE
Candle Zones
Flavio Javier Jarabeck
5 (1)
You probably heard about Candlesticks behaviors, which in most of the times could denote and trace Volume behaviors even if you are not watching Volume itself... Well, this indicator will do this. Naked traders love to rely solely on candlesticks patterns and with Candle Zones you can trap special patterns and DRAW THEM on your chart. As simple as that. There are several filters you can tweak in order to achieve the analysis you want. Just give it a try. After several months of testing, we think
FREE
Virtual Targets MT5
Hoang Van Dien
4.75 (8)
This indicator is very useful for day traders or short term traders. (MT5 version) No need to calculate the number of pips manually, just look at the chart and you will see the Virtual Take Profit / Virtual Stop Loss target line and evaluate whether the entry point is feasible to reach the intended target or not. Enter the intended   Take Profit / Stop Loss   pips for your trade. The indicator will display   Virtual Take Profit / Virtual Stop Loss   lines for you to easily see if the target i
FREE
The Advanced Pivot Point Indicator is a powerful tool designed to help traders identify key support and resistance levels in the market. This versatile indicator offers a customizable and user-friendly interface, allowing traders to select from five different pivot point calculation methods: Floor, Woodie, Camarilla, Tom DeMark, and Fibonacci. With its easy-to-read lines for pivot points (PP), support (S1, S2, S3, S4), and resistance (R1, R2, R3, R4) levels, the Advanced Pivot Point Indicator pr
FREE
TilsonT3
Jonathan Pereira
Tillson's T3 moving average was introduced to the world of technical analysis in the article ''A Better Moving Average'', published in the American magazine Technical Analysis of Stock Commodities. Developed by Tim Tillson, analysts and traders of futures markets soon became fascinated with this technique that smoothes the price series while decreasing the lag (lag) typical of trend-following systems.
FREE
IMA Finder MT5
Mubashir Mohamed Quraish Albarakat
1 (1)
This indicator is designed based on the Moving Origin indicator When the moving origin indicator breaks the price, this indicator gives a signal It is useful for better viewing of signals and analysis on them Attributes: Can be used in all symbols Can be used in all time frames Too many signals Simple and quick settings Easy way to work Settings: period: like moving average settings alarmShow: If you want to receive an alert in Metatrader after receiving the signal, enable this setting a
FREE
FRB Agressao Saldo
Fernando Baratieri
FRB Aggression Balance - Indicator shows the Agression Balance of the TIMEFRAMES chosen by the user through a histogram in a new window. - This indicator can only be used if the broker provides data on Volumes. Forex market brokers do not report this data. - B3 (Bovespa - Brazil) informs the data and with that it is possible to use it in Brazilian brokerages. Settings Color - Define the color that will be shown in the histogram. Use Historical Data - Defines whether the indicator will calcu
FREE
ForExp1
Mikhail Sergeev
5 (1)
Удобный трендовый индикатор. Не меняет своих значений. Имеет огромные возможности для настройки. Не требователен к ресурсам компьютера. Создавался для работы в системе BearsHunter. Эксперт МТ5 с использованием данного индикатора: https://www.mql5.com/ru/market/product/30381 Эксперт МТ4 с использованием данного индикатора: https://www.mql5.com/ru/market/product/30383 Параметры: m1_MA_Mode_1 - метод усреднения(0-9). m1_MA_Mode_2 - метод усреднения(0-9). m1_MA_Mode_3 - метод усреднения(0-9). m1
FREE
FRB Day Points
Fernando Baratieri
Day Points Indicadtor that shows the points considered important for X days. (Open,Close, High, Low) Used a lot by those who do day trade. These points can be used for decision making by a trader. You will choose the amount of days ago for it to show. Settings High/Low/Close/Open Show - True/False. Days - Number of days that will show on the chart. Color - Line Color. Style - Line Style.
FREE
FT ADX Color Candles
FELIPE MISAEL MORAES KRUGER
4.86 (7)
Trading can be quite tiring when you need to look at several things at the same time. Format of candles, supports, resistances, schedules, news and indicators. This tool aims to facilitate the analysis of the ADX indicator. It colors the candles based on the levels of the indicator and the DI lines. The period, the limit of the indicator and the colors of the candles are customizable. You can also place a visual aid on the lower right side of the graph to view the values of ADX, DI + and
FREE
Bollinger colorido
Sergio Domingues
5 (1)
Funciona como bandas de bollinger normais. Criado por Joe Ross, é um setup de maior risco por ser contra-tendência. Pode ser usado para Day Trade, Swing Trade e Position. Para identificar, é necessário inserir no gráfico as Bandas de Bollinger, com uma Média Móvel Simples de 20 períodos e largura (desvio) 2. Verifica-se um fechamento de determinado candle abaixo da banda inferior de Bollinger. Se o próximo candle fechar dentro das Bandas, marca-se a máxima dele. O rompimento dessa máxima será o
FREE
Touch VWAP MT5
Danrlei Hornke
5 (5)
O Touch VWAP é um indicador que permite calcular uma Média Ponderada por Volume (VWAP) apenas apertando a tecla 'w' no seu teclado e após clicando no candle do qual deseja realizar o calculo, clicando abaixo do candle é calculada a VWAP baseado na minima dos preços com o volume, clicando sobre o corpo do candle é calculado uma VWAP sobre o preço medio com o volume e clicando acima do candle é calculado uma VWAP baseado na máxima dos preços com o volume, voce tambem tem a opção de remover a VWA
FREE
이 제품의 구매자들이 또한 구매함
Atomic Analyst MT5
Issam Kassas
4.79 (19)
우선적으로 언급할 점은이 거래 지표가 다시 그리지 않고 지연되지 않으며 이를 통해 수동 및 로봇 거래 모두에 이상적이라는 점입니다. 사용자 매뉴얼: 설정, 입력 및 전략. Atomic Analyst는 가격의 강도와 모멘텀을 활용하여 시장에서 더 나은 이점을 찾는 PA Price Action Indicator입니다. 고급 필터를 장착하여 잡음과 거짓 신호를 제거하고 거래 잠재력을 높이는 데 도움이 됩니다. 복잡한 지표의 다중 레이어를 사용하여 Atomic Analyst는 차트를 스캔하고 복잡한 수학적 계산을 간단한 신호와 색상으로 변환하여 초보 트레이더가 이해하고 일관된 거래 결정을 내릴 수 있도록합니다. "Atomic Analyst"는 새로운 및 경험이 풍부한 트레이더를위한 종합적인 거래 솔루션입니다. 프리미엄 지표와 최고 수준의 기능을 하나의 거래 전략에 결합하여 모든 종류의 트레이더에 대한 다재다능한 선택지가되었습니다. 인트라데이 거래 및 스캘핑 전략 : 빠르고 정확한
Atbot
Zaha Feiz
4.96 (28)
AtBot: 작동 방식 및 사용 방법 ### 작동 방식 MT5 플랫폼용 "AtBot" 지표는 기술 분석 도구의 조합을 사용하여 매수 및 매도 신호를 생성합니다. 01:37 단순 이동 평균(SMA), 지수 이동 평균(EMA), 평균 진폭 범위(ATR) 지수를 통합하여 거래 기회를 식별합니다. 또한 Heikin Ashi 캔들을 사용하여 신호의 정확성을 향상시킬 수 있습니다. 구매 후 리뷰를 남기면 특별 보너스 선물을 받게 됩니다. ### 주요 기능: - 비재표시: 신호는 플로팅 후 변경되지 않습니다. - 비재작성: 신호는 일관되며 변경되지 않습니다. - 지연 없음: 지연 없이 시기적절한 신호를 제공합니다. - 다양한 시간대: 거래 전략에 맞게 모든 시간대에서 사용할 수 있습니다. ### 운영 단계: #### 입력 및 설정: - firstkey (TrendValue): 추세 감지의 민감도를 조정합니다. - Secondkey (SignalValue): 매수/매도 신호 생성의 민감도를 정의
우선 이 거래 시스템이 리페인팅, 리드로잉 및 레이그 인디케이터가 아니라는 점을 강조하는 것이 중요합니다. 이는 수동 및 로봇 거래 모두에 이상적인 것으로 만듭니다. 온라인 강좌, 설명서 및 프리셋 다운로드. "스마트 트렌드 트레이딩 시스템 MT5"은 새로운 및 경험이 풍부한 트레이더를 위해 맞춤형으로 제작된 종합적인 거래 솔루션입니다. 10개 이상의 프리미엄 인디케이터를 결합하고 7개 이상의 견고한 거래 전략을 특징으로 하여 다양한 시장 조건에 대한 다목적 선택이 가능합니다. 트렌드 추종 전략: 효과적인 트렌드 추이를 타기 위한 정확한 진입 및 손절 관리를 제공합니다. 반전 전략: 잠재적인 트렌드 반전을 식별하여 트레이더가 범위 시장을 활용할 수 있게 합니다. 스캘핑 전략: 빠르고 정확한 데이 트레이딩 및 단기 거래를 위해 설계되었습니다. 안정성: 모든 인디케이터가 리페인팅, 리드로잉 및 레이그가 아니므로 신뢰할 수 있는 신호를 보장합니다. 맞춤화: 개별 거래 선호도를 고려한 맞춤
Gold Stuff mt5
Vasiliy Strukov
4.9 (185)
Gold Stuff mt5는 금을 위해 특별히 설계된 추세 지표이며 모든 금융 상품에서도 사용할 수 있습니다. 표시기가 다시 그려지지 않고 지연되지 않습니다. 권장 기간 H1. 설정 및 개인 보너스를 받으려면 구매 후 즉시 저에게 연락하십시오!     강력한 지원 및 트렌드 스캐너 표시기의 무료 사본을 받으실 수 있습니다. 메시지를 보내주세요. 나!   설정 화살표 그리기 - 켜기 끄기. 차트에 화살표 그리기. 경고 - 가청 경고를 끕니다. 이메일 알림 - 켜기 끄기. 이메일 알림. Puch-notification - 켜기 끄기. 푸시 알림. 다음으로 색 영역을 조정합니다. Gold Stuff mt5는 금을 위해 특별히 설계된 추세 지표이며 모든 금융 상품에서도 사용할 수 있습니다. 표시기가 다시 그려지지 않고 지연되지 않습니다. 권장 기간 H1. 설정 및 개인 보너스를 받으려면 구매 후 즉시 저에게 연락하십시오!   설정 화살표 그리기 - 켜기 끄기. 차트에
TPSproTREND PrO MT5
Roman Podpora
4.89 (9)
TPSpro TREND PRO  - is a trend indicator that automatically analyzes the market and provides information about the trend and each of its changes, as well as giving signals for entering trades without redrawing! The indicator uses each candle, analyzing them separately. referring to different impulses - up or down impulse. Exact entry points into transactions for currencies, crypto, metals, stocks, indices!  Version MT4               DETAILED DESCRIPTION               R ecommended to use with an
TPSpro RFI Levels MT5
Roman Podpora
4.67 (9)
Reversal First Impulse levels (RFI)      INSTRUCTIONS        RUS       -       ENG              R ecommended to use with an indicator   -   TPSpro  TREND PRO -  Version MT4                 A key element in trading is zones or levels from which decisions to buy or sell a trading instrument are made. Despite attempts by major players to conceal their presence in the market, they inevitably leave traces. Our task was to learn how to identify these traces and interpret them correctly. Main functi
Entry Points Pro for MT5
Yury Orlov
4.56 (163)
다시 색을 칠하지 않고 거래에 진입할 수 있는 정확한 신호를 제공하는 MT5용 지표입니다. 외환, 암호화폐, 금속, 주식, 지수 등 모든 금융 자산에 적용할 수 있습니다. 매우 정확한 추정값을 제공하고 매수와 매도의 가장 좋은 시점을 알려줍니다. 하나의 시그널로 수익을 내는 지표의 예와 함께 비디오 (6:22)시청하십시오! 대부분의 거래자는 Entry Points Pro 지표의 도움으로 첫 거래 주 동안 트레이딩 결과를 개선합니다. 저희의   Telegram Group 을 구독하세요! Entry Points Pro 지표의 좋은점. 재도색이 없는 진입 신호 신호가 나타나고 확인되면(시그널 캔들이 완성된 경우) 신호는 더 이상 사라지지 않습니다. 여타 보조지표의 경우 신호를 표시한 다음 제거되기 때문에 큰 재정적 손실로 이어집니다. 오류 없는 거래 게시 알고리즘을 통해 트레이드(진입 또는 청산)를 할 이상적인 순간을 찾을 수 있으며, 이를 통해 이를 사용하는 모든 거래자의
우선적으로, 이 거래 도구는 전문적인 거래에 이상적인 비-다시 그리기 및 지연되지 않는 지표입니다.  온라인 강좌, 사용자 매뉴얼 및 데모. 스마트 가격 액션 컨셉트 인디케이터는 신규 및 경험 많은 트레이더 모두에게 매우 강력한 도구입니다. Inner Circle Trader Analysis 및 Smart Money Concepts Trading Strategies와 같은 고급 거래 아이디어를 결합하여 20가지 이상의 유용한 지표를 하나로 결합합니다. 이 인디케이터는 스마트 머니 컨셉트에 중점을 두어 대형 기관의 거래 방식을 제공하고 이동을 예측하는 데 도움을 줍니다.  특히 유동성 분석에 뛰어나 기관이 어떻게 거래하는지 이해하는 데 도움을 줍니다. 시장 트렌드를 예측하고 가격 변동을 신중하게 분석하는 데 탁월합니다. 귀하의 거래를 기관 전략에 맞추어 시장의 동향에 대해 더 정확한 예측을 할 수 있습니다. 이 인디케이터는 시장 구조를 분석하고 중요한 주문 블록을 식별하
Quantum Trend Sniper
Bogdan Ion Puscasu
4.92 (48)
소개       Quantum Trend Sniper Indicator는   추세 반전을 식별하고 거래하는 방식을 변화시키는 획기적인 MQL5 지표입니다! 13년 이상의 거래 경험을 가진 숙련된 트레이더 팀이 개발한       Quantum Trend Sniper 표시기       매우 높은 정확도로 추세 반전을 식별하는 혁신적인 방법으로 거래 여정을 새로운 차원으로 끌어올리도록 설계되었습니다. ***Quantum Trend Sniper Indicator를 구입하면 Quantum Breakout Indicator를 무료로 받을 수 있습니다!*** Quantum Trend Sniper Indicator는 추세 반전을 식별하고 세 가지 이익실현 수준을 제안할 때 경고, 신호 화살표를 제공합니다. 초보자 거래자와 전문 거래자 모두에게 적합합니다. Quantum EA 채널:       여기를 클릭하세요 MT4 버전:       여기를 클릭하세요
Trend Screener Pro MT5
STE S.S.COMPANY
4.88 (67)
트렌드 표시기, 트렌드 트레이딩 및 필터링을 위한 획기적인 고유 솔루션, 하나의 도구 안에 내장된 모든 중요한 트렌드 기능! Forex, 상품, 암호 화폐, 지수 및 주식과 같은 모든 기호/도구에 사용할 수 있는 100% 다시 칠하지 않는 다중 시간 프레임 및 다중 통화 표시기입니다. Trend Screener는 차트에 점이 있는 화살표 추세 신호를 제공하는 효율적인 지표 추세 추종 지표입니다. 추세 분석기 표시기에서 사용할 수 있는 기능: 1. 트렌드 스캐너. 2. 최대 이익 분석이 있는 추세선. 3. 추세 통화 강도 측정기. 4. 경고가 있는 추세 반전 점. 5. 경고가 있는 강력한 추세 점. 6. 추세 화살표 Trend Screener Indicator가 있는 일일 분석 예, 일일 신호 성능...등은 여기에서 찾을 수 있습니다. 여기를 클릭하십시오. LIMITED TIME OFFER : Trend Screener Indicator는 50$ 및 평생 동안만 사용할 수 있습니다
FX Power MT5 NG
Daniel Stein
5 (6)
모닝 브리핑 여기 mql5 와 텔레그램에서 FX Power MT5 NG 는 오랫동안 인기 있는 통화 강도 측정기인 FX Power의 차세대 버전입니다. 이 차세대 강도 측정기는 무엇을 제공합니까? 기존 FX Power에서 좋아했던 모든 것 PLUS GOLD/XAU 강도 분석 더욱 정밀한 계산 결과 개별 구성 가능한 분석 기간 더 나은 성능을 위한 사용자 정의 가능한 계산 한도 특별 멀티더 많은 것을보고 싶은 사람들을위한 특별한 다중 인스턴스 설정 모든 차트에서 좋아하는 색상을위한 끝없는 그래픽 설정 수많은 알림 옵션, 중요한 것을 다시는 놓치지 않도록 Windows 11 및 macOS 스타일의 둥근 모서리가 있는 새로운 디자인 마법처럼 움직이는 인디케이터 패널 FX 파워 키 특징 모든 주요 통화의 완전한 강세 이력 모든 시간대에 걸친 통화 강세 이력 모든 브로커 및 차트에서 고유 계산 결과 100% 신뢰할 수있는 실시간100 % 신뢰할 수있는 실시간 계산-> 다시 칠하지 않음
FX Volume MT5
Daniel Stein
4.94 (17)
모닝 브리핑을 통해 세부 정보와 스크린샷으로 매일 시장 업데이트를 받으세요 여기 mql5 및 텔레그램에서 FX 거래량은 브로커의 관점에서 시장 심리에 대한 실제 통찰력을 제공하는 최초이자 유일한 거래량 지표입니다. 브로커와 같은 기관 시장 참여자가 외환 시장에서 어떤 포지션을 취하고 있는지에 대한 훌륭한 통찰력을 COT 보고서보다 훨씬 빠르게 제공합니다. 차트에서 이 정보를 직접 확인하는 것은 트레이딩의 진정한 판도를 바꾸고 획기적인 솔루션입니다. 다음과 같은 고유한 시장 데이터 인사이트의 이점 비율 는 통화의 매수/매도 포지션 비율을 백분율로 표시 비율 변화 는 선택한 기간 내 매수 비율과 비율 변화를 표시 총 거래량 는 해당 통화의 총 거래량(롱 및 숏)을 로트 단위로 보여줍니다 Volumes Long 는 해당 통화의 모든 롱 포지션의 거래량을 보여줍니다 Volumes Short 는 해당 통화의 모든 숏 포지션의 거래량을 보여줍니다 Net Long 는 순 롱 포지션의 거래량
IX Power MT5
Daniel Stein
4.17 (6)
IX Power는   마침내 FX Power의 탁월한 정밀도를 외환이 아닌 기호에도 적용했습니다. 좋아하는 지수, 주식, 원자재, ETF, 심지어 암호화폐까지 단기, 중기, 장기 추세의 강도를 정확하게 파악할 수 있습니다. 단말기가 제공하는   모든 것을 분석할   수 있습니다. 사용해 보고 트레이딩   타이밍이 크게 향상되는   것을 경험해 보세요. IX Power 주요 특징 단말기에서 사용 가능한 모든 거래 심볼에 대해 100% 정확한 비재도장 계산 결과 제공 사전 구성 및 추가적으로 개별 구성 가능한 강도 분석 기간의 드롭다운 선택 가능 이메일, 메시지, 모바일 알림을 통한 다양한 알림 옵션 제공 EA 요청을 위한 액세스 가능한 버퍼 더 나은 성능을 위한 사용자 지정 가능한 계산 한도 더 많은 것을 보고 싶은 사용자를 위한 특별 다중 인스턴스 설정 모든 차트에서 좋아하는 색상을 위한 무한한 그래픽 설정 가능 Windows 11 및 macOS 스타일의 둥
XQ Indicator MetaTrader 5
Marzena Maria Szmit
3.5 (2)
Step into the realm of Forex trading with confidence and precision using XQ, a cutting-edge Forex indicator designed to elevate your trading game to unprecedented heights. Whether you're a seasoned trader or just stepping into the world of currency exchange, XQ Forex Indicator empowers you with the insights and signals needed to make informed trading decisions. The signal conditions are a combination of three indicators, and XQ Forex Indicator only display  medium and long-term trends . The ind
Easy Buy Sell Signal Alert
Franck Martin
4.86 (7)
Easy By Sell is a market indicator for opening and closing positions. It becomes easy to track market entries with alerts. It indicates trend reversal points when a price reaches extreme values ​​and the most favorable time to enter the market. it is as effective as a Fibonacci to find a level but it uses different tools such as an algorithm based on ATR indicators and Stochastic Oscillator. You can modify these two parameters as you wish to adapt the settings to the desired period. My othe
이 대시보드는 선택한 심볼에 대해 사용 가능한 최신 고조파 패턴을 표시하므로 시간을 절약하고 더 효율적으로 사용할 수 있습니다 /   MT4 버전 . 무료 인디케이터:   Basic Harmonic Pattern 인디케이터 열 Symbol :   선택한 심볼이 나타납니다 Trend :   강세 또는 약세 Pattern :   패턴 유형(가틀리, 나비, 박쥐, 게, 상어, 사이퍼 또는 ABCD) Entry :   진입 가격 SL:   스톱로스 가격 TP1:   1차 테이크프로핏 가격 TP2:   2차 테이크프로핏 가격 TP3:   3차 테이크프로핏 가격 Current price:   현재 가격 Age (in bars):   마지막으로 그려진 패턴의 나이 주요 입력 Symbols :   "28개 주요 통화쌍" 또는 "선택한 심볼" 중에서 선택합니다. Selected Symbols :   쉼표로 구분하여 모니터링하려는 원하는 심볼("EURUSD,GBPUSD,XAUUSD")
TrendMaestro5
Stefano Frisetti
note: this indicator is for METATRADER4, if you want the version for METATRADER5 this is the link:  https://www.mql5.com/it/market/product/108106 TRENDMAESTRO ver 2.4 TRENDMAESTRO recognizes a new TREND in the bud, he never makes mistakes. The certainty of identifying a new TREND is priceless. DESCRIPTION TRENDMAESTRO identifies a new TREND in the bud, this indicator examines the volatility, volumes and momentum to identify the moment in which there is an explosion of one or more of these data a
Golden Spikes Premium
Kwaku Bondzie Ghartey
Golden Spikes Detector Overview: The Golden Spikes Premium is a groundbreaking trading indicator meticulously crafted for the Boom and Crash indices on the Deriv market. Tailored to meet the needs of discerning traders, this powerful tool operates exclusively on the one-minute timeframe, providing timely and precise signals to maximize your trading potential. The Golden Spikes Detector stands out in its ability to deliver accurate signals, ensuring that you capitalize on market opportunities wit
Gartley Hunter Multi
Siarhei Vashchylka
5 (8)
Gartley Hunter Multi - An indicator for searching for harmonic patterns simultaneously on dozens of trading instruments and on all possible timeframes. Manual (Be sure to read before purchasing) | Version for MT4 Advantages 1. Patterns: Gartley, Butterfly, Shark, Crab. Bat, Alternate Bat, Deep Crab, Cypher 2. Simultaneous search for patterns on dozens of trading instruments and on all possible timeframes 3. Search for patterns of all possible sizes. From the smallest to the largest 4. A
PZ Support Resistance MT5
PZ TRADING SLU
4.17 (6)
Unlock key market insights with automated support and resistance lines Special Offer: Purchase now to receive free bonuses worth $89! (Read more for details) Tired of plotting support and resistance lines? This is a multi-timeframe indicator that detects and plots supports and resistance lines in the chart with the same precision as a human eye would. As price levels are tested over time and its importance increases, the lines become thicker and darker, making price leves easy to glance and ev
Matrix Arrow Indicator MT5
Juvenille Emperor Limited
5 (14)
매트릭스 화살표 표시기 MT5 는 외환, 상품, 암호 화폐, 지수, 주식과 같은 모든 기호/도구에 사용할 수 있는 100% 다시 칠하지 않는 다중 기간 표시기를 따르는 고유한 10 in 1 추세입니다.  Matrix Arrow Indicator MT5 는 다음과 같은 최대 10개의 표준 지표에서 정보와 데이터를 수집하여 초기 단계에서 현재 추세를 결정합니다. 평균 방향 이동 지수(ADX) 상품 채널 지수(CCI) 클래식 하이켄 아시 캔들 이동 평균 이동 평균 수렴 발산(MACD) 상대 활력 지수(RVI) 상대 강도 지수(RSI) 포물선 SAR 스토캐스틱 오실레이터 윌리엄스의 백분율 범위 모든 지표가 유효한 매수 또는 매도 신호를 제공하면 강력한 상승/하락 추세를 나타내는 다음 캔들/막대가 시작될 때 해당 화살표가 차트에 인쇄됩니다. 사용자는 사용할 표시기를 선택하고 각 표시기의 매개변수를 개별적으로 조정할 수 있습니다. 매트릭스 화살표 표시기 MT5는 선택한 표시기에서만 정보를 수
Volume by Price MT5
Brian Collard
3.6 (5)
The Volumebyprice.com Indicator for MetaTrader 5 features Volume Profile and Market Profile TPO (Time Price Opportunity). Volume and TPO histogram bar and line charts. Volume Footprint charts. TPO letter and block marker collapsed and split structure charts. Static, dynamic and flexible range segmentation and compositing methods with relative and absolute visualizations. Session hours filtering and segment concatenation with Market Watch and custom user specifications. Graphical layering, posit
ICT, SMC, SMART MONEY CONCEPTS, SMART MONEY, Smart Money Concept, Support and Resistance, Trend Analysis, Price Action, Market Structure, Order Blocks, BOS/CHoCH,   Breaker Blocks ,  Momentum Shift,   Supply&Demand Zone/Order Blocks , Strong Imbalance,   HH/LL/HL/LH,    Fair Value Gap, FVG,  Premium  &   Discount   Zones, Fibonacci Retracement, OTE, Buy Side Liquidity, Sell Side Liquidity, BSL/SSL Taken, Equal Highs & Lows, MTF Dashboard, Multiple Time Frame, BigBar, HTF OB, HTF Market Structure
Volatility Trend System - a trading system that gives signals for entries. The volatility system gives linear and point signals in the direction of the trend, as well as signals to exit it, without redrawing and delays. The trend indicator monitors the direction of the medium-term trend, shows the direction and its change. The signal indicator is based on changes in volatility and shows market entries. The indicator is equipped with several types of alerts. Can be applied to various trading in
Blahtech Supply Demand MT5
Blahtech Limited
4.54 (13)
Was: $299  Now: $99   Supply Demand uses previous price action to identify potential imbalances between buyers and sellers. The key is to identify the better odds zones, not just the untouched ones. Blahtech Supply Demand indicator delivers functionality previously unavailable on any trading platform. This 4-in-1 indicator not only highlights the higher probability zones using a multi-criteria strength engine, but also combines it with multi-timeframe trend analysis, previously confirmed swings
금 TMAF MTF - 최고의 주식 기술 지표입니다. 지표 알고리즘은 자산의 가격 움직임을 분석하고 변동성과 잠재적 진입 구간을 반영합니다. 최고의 지표 신호입니다: - 매도 = TMA1의 빨간색 상한선 위의 TMA2의 빨간색 상한선 + 위의 빨간색 프랙탈 인디케이터 + 같은 방향의 노란색 SR 신호 화살표. - 매수 = TMA2의 파란색 하한선 아래 TMA1의 파란색 하한선 + 아래에서 파란색 프랙탈 표시기 + 같은 방향의 아쿠아 SR 신호 화살표. 인디케이터의 장점 1. 이 인디케이터는 높은 정확도로 신호를 생성합니다. 2. 확인 된 화살표 신호는 다시 그려지지 않으며 프랙탈 신호는 절반 기간 동안 다시 그릴 수 있습니다. 3. 모든 브로커의 메타트레이더 5 거래 플랫폼에서 거래할 수 있습니다. 4. 모든 자산(통화, 금속, 암호화폐, 주식, 지수 등)을 거래할 수 있습니다. 5. M30-H1 차트주기(중기 트레이딩)에서 거래하는 것이 좋습니다. 6
Automated Trendlines MT5
Georgios Kalomoiropoulos
추세선은 외환 거래에서 기술적 분석의 가장 필수적인 도구입니다. 불행히도, 대부분의 거래자는 올바르게 그리지 않습니다. 자동 추세선 표시기는 시장의 추세 움직임을 시각화하는 데 도움이 되는 진지한 거래자를 위한 전문 도구입니다. 추세선 강세 추세선과 약세 추세선에는 두 가지 유형이 있습니다. 상승 추세에서 Forex 추세선은 가격 움직임의 가장 낮은 스윙 포인트를 통해 그려집니다. 최소 두 개의 "최저 저점"을 연결하면 추세선이 생성됩니다. 하락 추세에서 추세선은 가격 움직임의 가장 높은 스윙 포인트를 통해 그려집니다. 최소 두 개의 "최고 최고점"을 연결하면 추세선이 생성됩니다. 추세선이 깨질 때? 강세 추세선은 약세 양초가 강세 추세선 아래에서 닫히고 양초의 고점이 추세선 위에 있을 때 깨집니다. 약세 추세선은 강세 양초가 약세 추세선 위로 마감되고 양초 저점이 추세선 아래에 있을 때 깨집니다. 추세선이 삭제되면? 강세 추
TPA True Price Action indicator reveals the true price action of the market makers through 100% non-repainting signals strictly at the close of a candle! TPA shows entries and re-entries, every time the bulls are definitely stronger than the bears and vice versa. Not to confuse with red/green candles. The shift of power gets confirmed at the earliest stage and is ONE exit strategy of several. There are available now two free parts of the TPA User Guide for our customers. The first "The Basics"
The 1 2 3 Pattern Scanner MT5
Reza Aghajanpour
5 (16)
** All Symbols x All Timeframes scan just by pressing scanner button ** ***Contact me after purchase to send you instructions and add you in "123 scanner group" for sharing or seeing experiences with other users. After 17 years of experience in the markets and programming, Winner indicator is ready. I would like to share with you! Introduction The 123 Pattern Scanner indicator with a special enhanced algorithm is a very repetitive common pattern finder with a high success rate . Interestingly,
Auto Order Block with break of structure based on ICT and Smart Money Concepts (SMC) Futures Break of Structure ( BoS )             Order block ( OB )            Higher time frame Order block / Point of Interest ( POI )    shown on current chart           Fair value Gap ( FVG ) / Imbalance   -  MTF      ( Multi Time Frame )    HH/LL/HL/LH  -  MTF      ( Multi Time Frame )  Choch  MTF      ( Multi Time Frame )  Volume Imbalance     ,  MTF          vIMB Gap’s Power of 3 Equal High
제작자의 제품 더 보기
Auto Fibonacci
Ali Gokay Duman
5 (2)
This indicator calculates fibonacci levels via moving averages trend and draw these lines. You can change fast and slow Moving Averages settings for customization. Inputs: Fast MA Time Period :  64 Fast MA Shift: 0 Fast MA Method: Smoothed Fast MA Apply To: Median Price Slow MA Time Period: 32 Slow MA Shift: 0 Slow MA Method: Smoothed Slow MA Apply To: Median Price ZigZag: False ZigZag Color: Red ZigZag Type: DashDot ZigZag Width: VeryThin Fibo Settings TrendFibonacci: True FiboTrendColor: Blac
FREE
Gann Pivot Levels
Ali Gokay Duman
4.75 (4)
This indicator calculates gann support and resistance prices with use gann pyramid formulation and draw them on the chart. And If you want, Indicator can alert you when the current price arrive these pivot levels. Alert Options: Send Mobil Message, Send E-mail, Show Message and Sound Alert Levels: S1, S2, S3, S4, S5, R1, R2, R3, R4, R5 Inputs:  GannInputPrice: Input price for gann pyramid formulation. GannInputDigit: How many digit do you want to use for calculation formula. (The number and the
FREE
MA ZigZag
Ali Gokay Duman
5 (1)
This indicator calculates trend via two different moving averages and draw zigzag trend lines. You can change fast and slow Moving Averages settings for customization. Inputs: Fast MA Time Period :  64 Fast MA Shift: 0 Fast MA Method: Smoothed Fast MA Apply To: Median Price Slow MA Time Period: 32 Slow MA Shift: 0 Slow MA Method: Smoothed Slow MA Apply To: Median Price ZigZag Color: Red ZigZag Type: DashDot ZigZag Width: VeryThin 
FREE
You can send MetaTrader screenshot easily to your identified telegram channel via press the send button that on the chart. TelegramBotToken: Telegram API credentials. You can create API credentials on my.telegram.org web page ChatId: Your telegram chatId. Secreenshots will be sending this channel - Please do not press the button repeatedly. This may cause your bot or ip address to be blocked. - You have to add telegram api address ( https://api.telegram.org ) in Option > Expert Advisors > Allow
FREE
You can use this tool to create as many pending orders (limit order) as you want in one button press. All inputs must be in points. You can use this useful tool when such as FED speech times. User Inputs: MagicNumber = Magic number DeviationPoint = Deviation point number for limit orders Level = You can choise how many level do you want to create pending orders. BuyOrder = true/false SellOrder = true/false StartDistance = Distance between each level. StepDistance = Distance to be added incremen
FREE
You can send MetaTrader screenshot easily to your identified telegram channel via press the send button that on the chart. TelegramBotToken: Telegram API credentials. You can create API credentials on my.telegram.org web page ChatId: Your telegram chatId. Secreenshots will be sending this channel  - Please do not press the button repeatedly. This may cause your bot or ip address to be blocked. - You have to add telegram api address ( https://api.telegram.org ) in Option > Expert Advisors > Allow
FREE
This indicator draws on the chart high and low prices of different periods . And If you want, Indicator can alert you when the current price arrive these levels. Alert Options:   Send Mobil Message, Send E-mail, Show Message, Sound Alert Time Periods:  M1, M5, M15, M30, H1, H4, D1, W1, MN Inputs:  TimeShift: You can set start hour for calculating. And that way you can see levels independently from broker server's time-zone. PipDeviation: You can set price sensibility for alert (Default: 3) Lines
FREE
This utility exports candle data   which you chosed by input parameter  to CSV  file. Time Frames:  M1,M5,M15,M30,H1,H4 Inputs: StartTime: Start time for exporting data. EndTime:   End time for exporting data. DataType: Close, Open, High, Low, Median(HL/2), Typical(HLC/3), Weighted(HLCC/4), Pip(H-L). DecimalSeperator: Decimal seperator for candle price data. (Default = ".") CSVDelimiter: Delimiter character for CSV file.  (Default = ";") * This utility exports candle data horizontally. That
FREE
Pivot Point Expert
Ali Gokay Duman
5 (1)
This indicator calculates support and resistance prices in multi-timeframe with different formulation and draw them on the chart that style do you choose. And If you want, Indicator can alert you when the current price arrive these pivot levels. Formulations: Classic, Camarilla, Woodie, Demark, Floor, Fibonacci Alert Options: Send Mobil Message, Send E-mail, Show Message, Sound Alert Levels: PP, S1, S2, S3, S4, S5, R1, R2, R3, R4, R5, TC, BC and Middle Points Why do you need this indicator:
All in One Pivot Point
Ali Gokay Duman
5 (8)
This indicator calculates support and resistance prices in multi-timeframe with different formulation and draw them on the chart that style do you choose. And If you want, Indicator can alert you when the current price arrive these pivot levels. Formulations: Classic, Camarilla, Woodie, Demark, Floor, Fibonacci Alert Options: Send Mobil Message, Send E-mail, Show Message, Sound Alert Levels: PP, S1, S2, S3, S4, S5, R1, R2, R3, R4, R5, TC, BC  and Middle Points Why do you need this indicator:
This Expert Advisor follows your channel lines that you draw. and when the price reaches these support and resistance trend lines, EA send open or close order automatically. You must draw two trend line with same color for EA to work, not equidistant channel line. and this color must be specified in ChannelColor parameter Strategies: Inside Channel Strategy: If the price reaches bottom trend line, the EA will place a buy order. and when the price reaches the top trend point, EA send close orde
필터:
simon.metivier
71
simon.metivier 2024.04.02 13:37 
 

Hello Ali, Thanks for the indicator, it works great. I only can't seem to use the time shift, I am trying to start my H4 candle at custom time, but it doesn't seem to work when adding input 1 to 12 for time shift in Hour. Am-I correct?

Ali Gokay Duman
10933
개발자의 답변 Ali Gokay Duman 2024.04.03 14:01
Thank you for your feedback. No, You are correct. I'll check ASAP.
valdecism
128
valdecism 2022.12.06 21:13 
 

Amazing indicator! Could the line names be only M1, H1, D1 an so on? And could the line values be highlighted in the price area? In my screen when 2 TF'S have the same value, I can't read it. Thanks in advance. Regards!

Ali Gokay Duman
10933
개발자의 답변 Ali Gokay Duman 2022.12.07 06:47
Of course, it could be. Thank you for your good feedbacks. I'll add these features in the next version asap.
marcello 981
118
marcello 981 2022.06.15 07:38 
 

Great indicator! waiting for more timeframes like, H3, H6...

Ali Gokay Duman
10933
개발자의 답변 Ali Gokay Duman 2022.06.22 17:24
Thank you for your feedback. I added H2, H3, H6, H8 and H12 time frames
Detleff Böhmer
2652
Detleff Böhmer 2022.03.11 16:36 
 

Der Indikator arbeitet sehr genau, gute Arbeit.

Ali Gokay Duman
10933
개발자의 답변 Ali Gokay Duman 2022.03.12 17:18
Ich danke dir sehr. Wenn Sie irgendwelche Vorschläge haben, würde ich sie gerne hören.
drloewtz
69
drloewtz 2022.02.25 21:06 
 

Wirklich ein Top Indikator! Bin begeistert! Danke dafür :)

Ali Gokay Duman
10933
개발자의 답변 Ali Gokay Duman 2022.02.26 06:54
Danke. Ich bin froh, dass es dir gefällt.
vinnil07
14
vinnil07 2022.02.12 04:37 
 

An excellent indicator. Please make a separate notification for buying and selling. Thanks!

Ali Gokay Duman
10933
개발자의 답변 Ali Gokay Duman 2022.02.12 09:07
Thank you for your feedback. I'll add next version
13qwerty
55
13qwerty 2022.02.02 08:49 
 

Прекрасное дополнение к любой стратегии. Разработчику большое спасибо!

Ali Gokay Duman
10933
개발자의 답변 Ali Gokay Duman 2022.02.02 11:22
Thank you
Ruhail Ashraf Khan
630
Ruhail Ashraf Khan 2022.01.30 15:44 
 

Plz add high and low on chart and quarterly timeframe as well.

Ali Gokay Duman
10933
개발자의 답변 Ali Gokay Duman 2022.01.31 08:16
Thank you for your feedback. I'll add quarterly timeframe.
리뷰 답변
버전 1.3 2022.11.30
- Lows and High lines were hidden in the object list for preventing wrong deletion.

- A drag-drop button was added to the chart window for hiding lines easily. (you should set ButtonEnable parameter in the user input list to use it)
버전 1.2 2022.06.22
- H2, H3, H6, H8, H12 time frames added
버전 1.1 2022.02.14
- Added AlertLH input parameter which you can choose low, high or both price alert.