Ticks ADX
- 지표
- Andrej Nikitin
- 버전: 1.12
- 업데이트됨: 18 11월 2021
- 활성화: 5
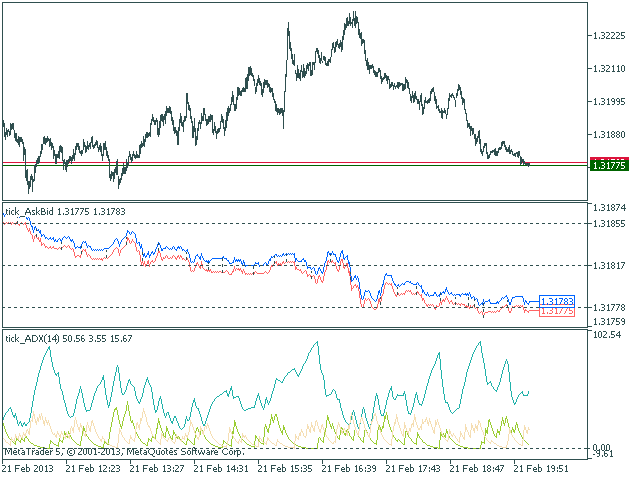
The Average Directional Movement Index indicator drawn using a tick chart.
After launching it, wait for enough ticks to come.
Parameters:
- Period - period of averaging.
- Сalculated bar - number of bars on the chart for the indicator calculation.
Buffer indexes: 0 - MAIN_LINE, 1 - PLUSDI_LINE, 2 - MINUSDI_LINE.