Omega Trend Oscillator
- 지표
- Elias Mtwenge
- 버전: 1.0
- 활성화: 20
The Omega Trend Oscillator is a trend indicator based on Moving averages and Bollinger bands.
I made it simple for you to have easy and soft market analysis approach.
The indicator can be used for the following purpose.
1. For trend analysis
2. For determining the overbought and oversold market condition
3. For discovering market selling and buying opportunities.
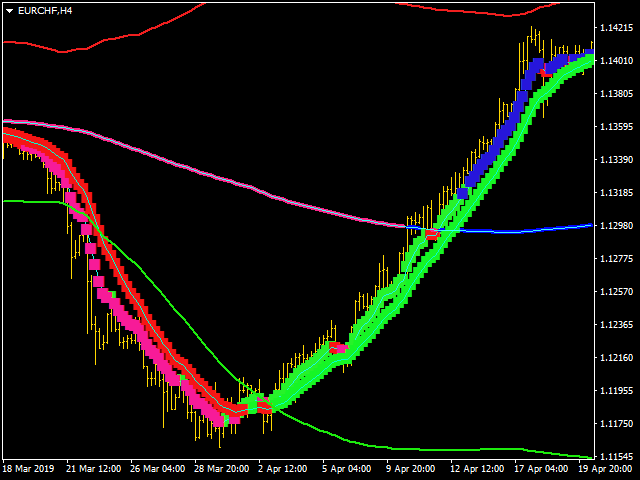
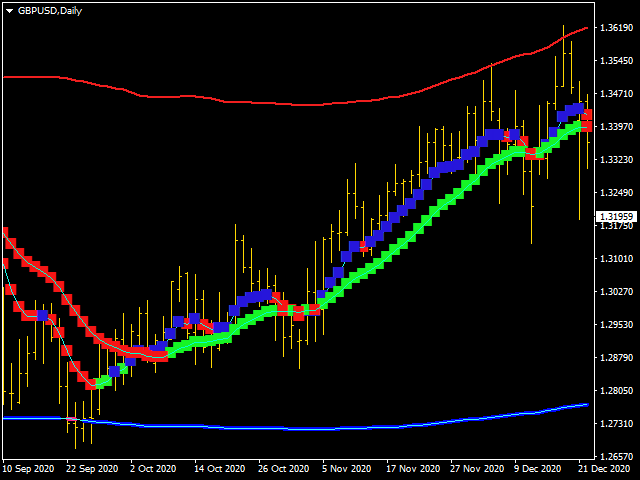
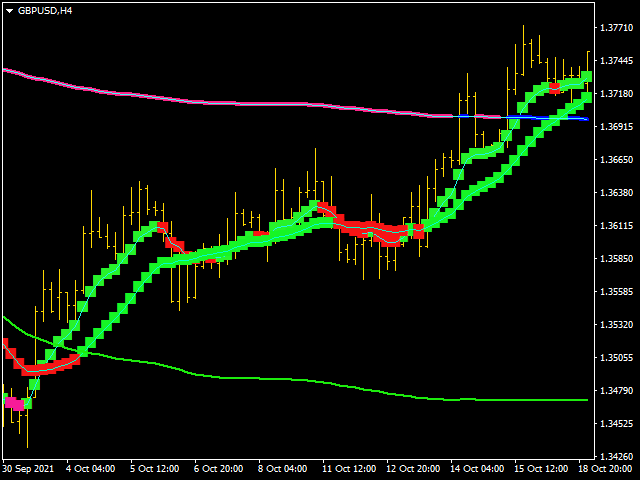
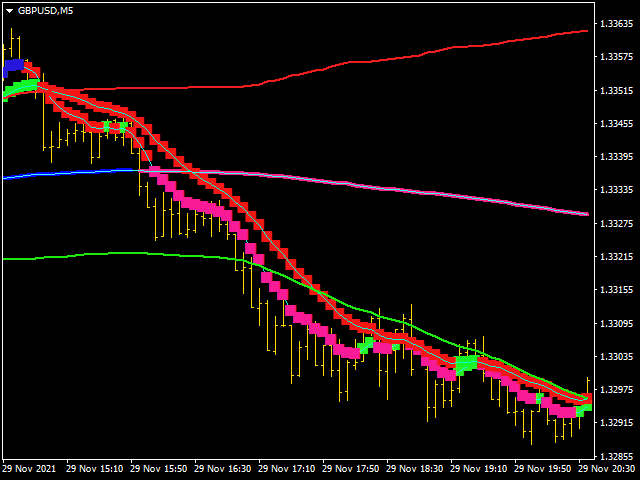
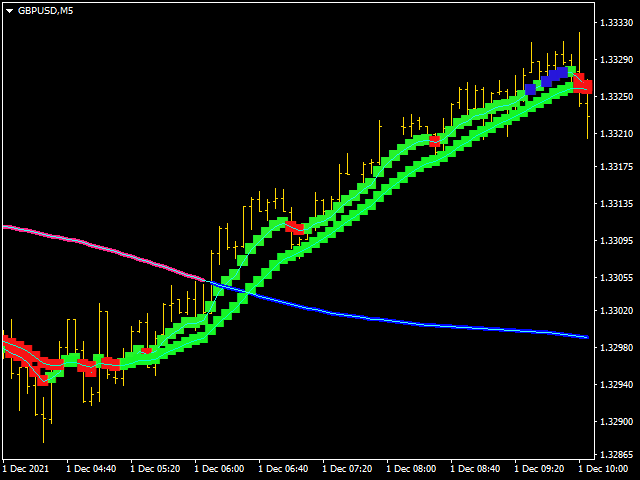
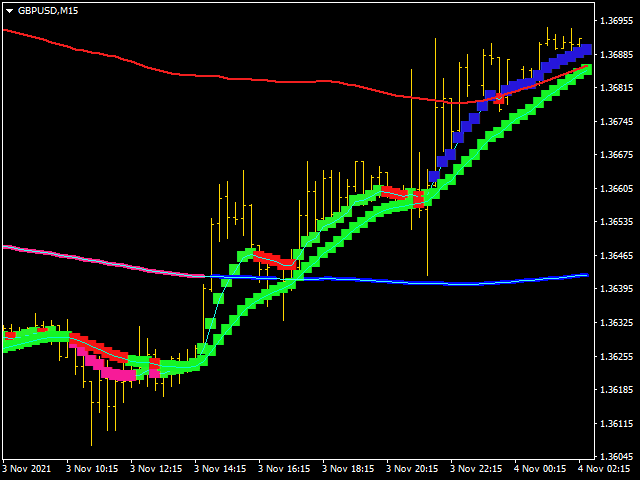
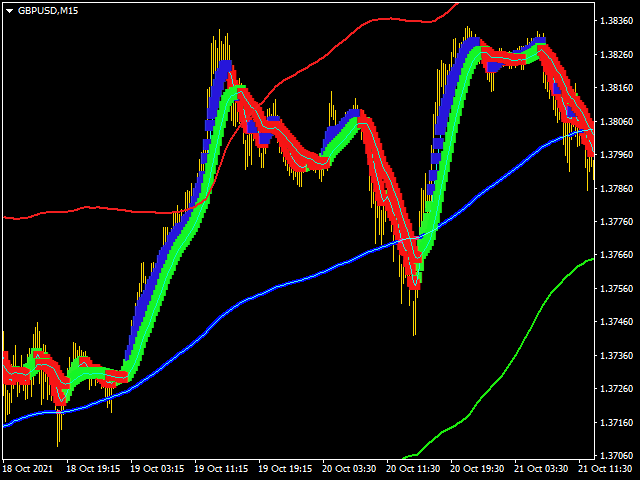
Meaning of colors on the indicator
FOR BULLISH MARKET (Buy)
1. Lime color is for bullish market/trend
2. Blue color is for very strong bullish market/trend
FOR BEARISH MARKET (sell)
1. Red color is for bearish market/trend
2. Purple color is for very strong bearish market/trend.
When to enter a buy trade?
1. You enter a buy trade after the exhaustion of the bearish trend and the signal alert is buy. The moving averages are all pointing up and lime green colored.
2. You enter a sell trade after the exhaustion of the bullish trend and the signal alert is sell. The moving averages are all pointing down and red colored.
For reference I have attached the screenshots.
Last words.
Disclaimer: Not every signal will be correct! Signals generated by this tool should not be considered as the final to making financial decisions. You may lose your valuable capital if not making wise decisions! You are responsible for your trading decisions and actions! Thank you for working with my tools wisely.

