Supply demand zoning
- 지표
- Oluwatosin Isaac Omotayo
- 버전: 1.0
- 활성화: 20
After forming a New Structure High the market will retrace creating a higher low. When this movement occurs, that NSH's now become an area of structure called resistance. As price action pushes up from the newly created higher lows, that resistance level becomes the last stand for sellers to stop the buyers from rallying.
IF the resistance level cannot be penetrated, THEN it's likely that we'll see either a period of consolidation or a reversal in trend. IF price action breaks through the resistance level it symbolizes a continuation in the current trend.
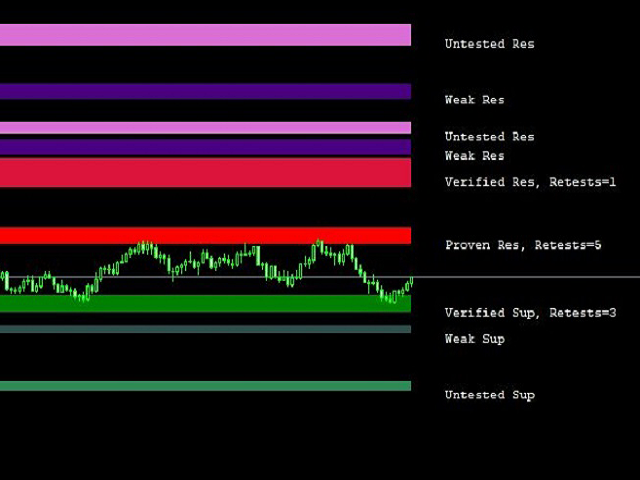
This Expert Indicator accurately maps out supply and demand zones and works on all timeframes and can be used for multi-markets across multiple platforms at the same time.
This Expert Indicator defines Support and Resistance levels relative to their Strength into WEAK LEVELS, UNTESTED LEVELS, VERIFIED LEVELS and PROVEN LEVELS and also indicates the number of times the market has retested these levels in REAL-TIME.


