EA Supremacy NT
- Experts
- Dmytro Melnyk
- 버전: 1.1
- 업데이트됨: 24 10월 2023
- 활성화: 5
Our team - @Supremacy_Lab - are glad to introduce our first product - EA_Supremacy_NT - a unique technical solution for day trading, scalping, and trend following.
EA_Supremacy_NT is a non-trading version of our core automated advisor, that will be released later.
It is a truly innovative product that is based on an unconventional approach to market data processing. The underlying algorithm allows traders to reap the maximum possible profit from short-term price movements.
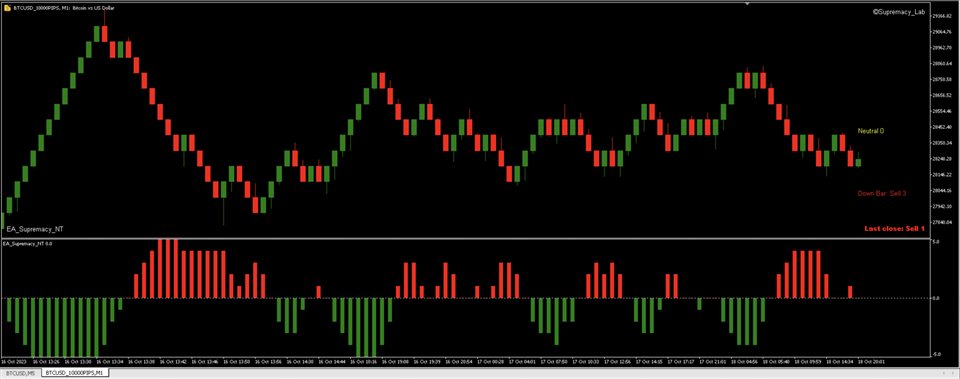
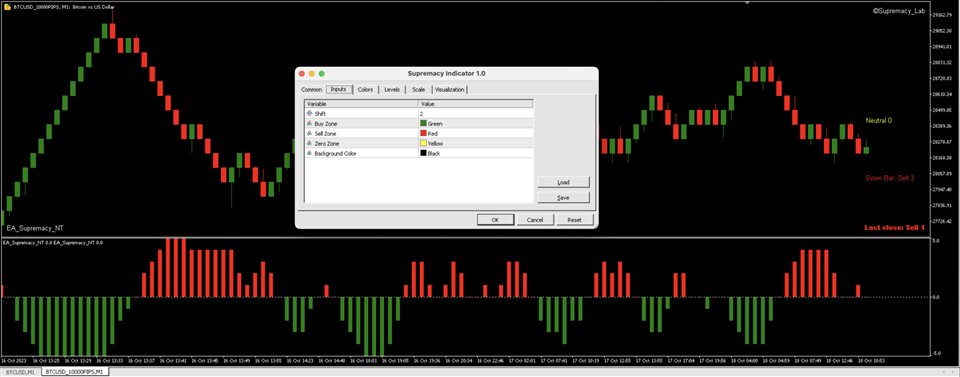
The system uses a single Supremacy Indicator that is self-adaptive and self-adjusting. It is very easy to read and follow the indicator values as it is aligned with the Supremacy Chart - a range chart - an outstanding alternative to traditional time frames.
The product is suitable for day traders, scalpers, swing traders, and trend followers. It is a powerful tool that reveals hidden patterns of market microstructure. The product is not cheap, but it is worth every single penny spent.
The Concept behind:
The calculations and output values are based on the methods of non-parametric statistics. Over time, we have come to the understanding that financial markets represent a complex non-linear, and non-parametric structure and that traditional methods of statistical/mathematical analysis usually result in a weak practical application. At the same point in time, market data could be characterized as a Markov, a non-Markov, or a stochastic (random) process. Simultaneously, the distribution of market data rarely takes the shape of a familiar, like Gaussian, LogNormal, or Exponential. In our numerous experiments, we have attempted to "normalize" market data distribution by applying various mathematical transforms (Hilbert’s, Fisher's, etc). However, only hidden non-parametric models that lie behind the Supremacy algorithm have shown the most efficient, reliable, coherent, and long-run practical results.
We have also designed the Supremacy Chart - a range chart based on the idea of correct discretization of market data. The Supremacy Indicator is attached to the Supremacy Chart and is not compatible with traditional time frames. This Chart gives a much clearer picture of short-term market movements that are easy to read even for beginners.
Core features of the product:
1) Unique approach to market data analysis.
2) A single indicator used with few simple Input variables and output values.
3) Self-adjusting algorithm optimized for all possible market variations.
4) Tailor-made Supremacy Chart.
5) Perfect for scalping, day and swing trading, trend following.
6) Precise in the determination of neutral zones, where no trades should be taken.
Recommendations:
- Trading instruments: Bitcoin, Gold, US30.
- Minimum deposit: $500 - 1000.
- Account type: ECN, Zero Spread, or similar with a tiny or no spread.
- Brokers: any reliable broker that offers zero spread or a low spread account.
- VPS: Highly recommended.
- Leverage: At your discretion.
Instructions:
1) Choose the instrument you want to trade. Open a regular time-frame chart. Set a 1-minute time frame.
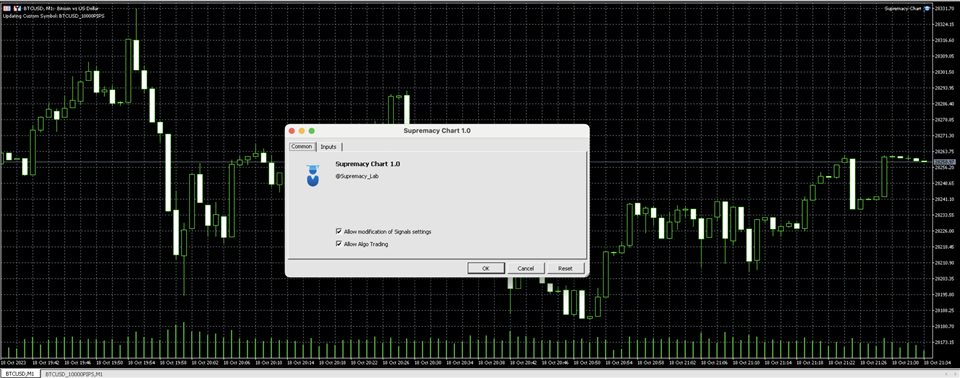
2) Run the EA and tick both "Allow algo trading" and "Allow modification of Signal Settings".
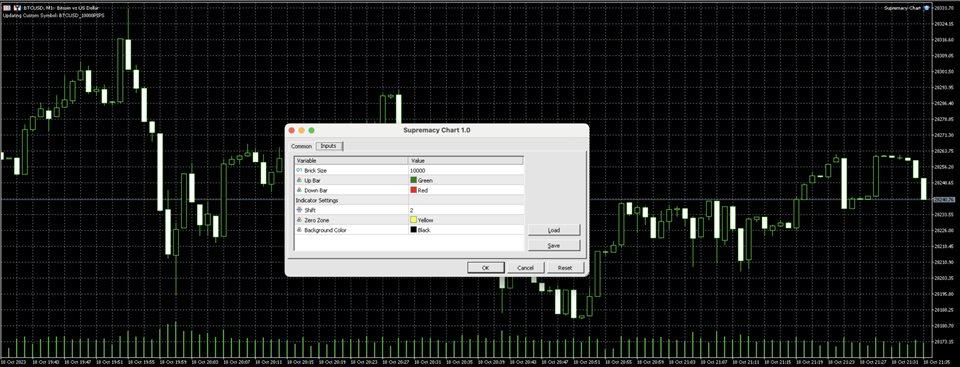
3) Select the brick size - the size of a one-step price change. On Bitcoin (BTCUSD) with 2 decimal digits, e.g. 25800.35, a 10000 brick size would result in a $100 price.
Recommended brick sizes are equivalent to $100/$200 for Bitcoin and Dow30 and $2-$10 for Gold.
4) Choose a Shift: 1 or 2. There is a slight difference between the two shifts in the timing of opening/closing positions and the duration of market-neutral zones: Shift 1 shows more neutral zones.
5) After clicking the "Ok" button, a new window with the Supremacy Chart and Supremacy Indicator will emerge. All trades are now done on this Chart.
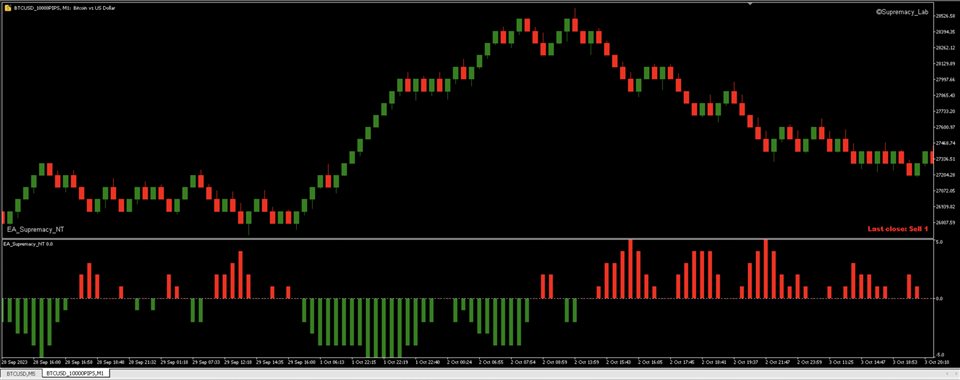
6) The Supremacy Chart shows the sequence of green (Up) and red (Down) bars (bricks) of the size set up in point 3.
7) The Supremacy Indicator shows the historical values (closed bars) and the current bar values. The last one allows you to trade in real-time.
- The Buy zone (green color) values are limited to the -1 to -5 range, while the Sell zone (red color) values are bounded to the 1 to 5 range. The higher the number, the larger the order lot that could be placed (opened). Use 1 to 5 (for Sell) and -1 to -5 (for Buy) values as a multiplier to your Input lot.
- 0 marks a neutral bar: you either close all opened positions or steer clear of opening new ones.
- When the color is changed from red to green and vice versa, you must close your previous position and flip it over.
- The two values on the current (open) bar give a clue on what you should do in both scenarios of a current bar closing: Green (UpBar) or Red(DownBar).
- In the lower right-hand corner, you can find the indicator value of the previous (last closed) bar.
8) To change the Shift in the open Supremacy Chart window, click the right button on the Supremacy Indicator and open the properties.
More to come soon. Enjoy your trading with this outstanding trading solution.
