MarketMonitor
- 지표
- Vasyl Temchenko
- 버전: 1.0
- 활성화: 5
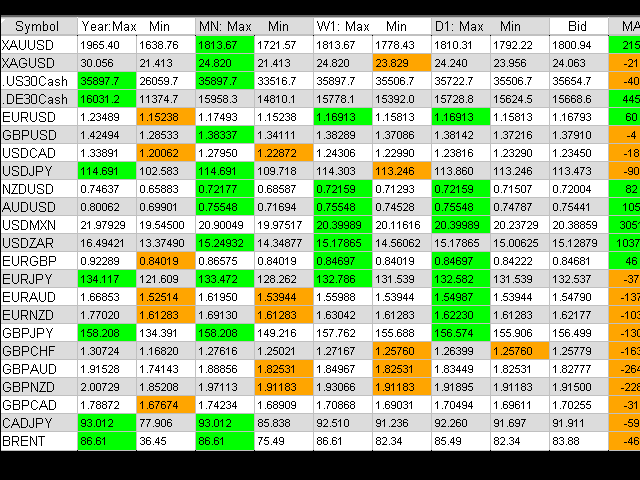
응용 프로그램은 한 시트에 수십 쌍의 데이터를 표시합니다. 이를 통해 거래를 위한 유망한 쌍을 빠르게 식별할 수 있습니다.
수십 개의 차트를 열어 분석할 필요가 없습니다. 3-4-5개의 차트와 정확히 분석해야 하는 차트만 열면 됩니다.
"댓글" 전체 크기 사진을 참조하십시오.
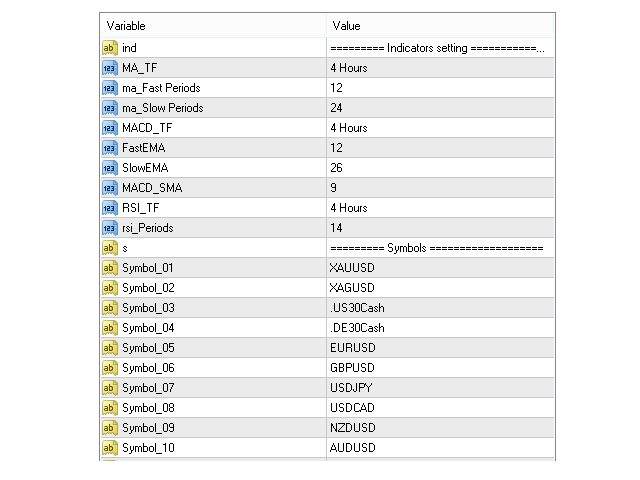
메뉴는 1~30개의 기호로 설정할 수 있습니다. 이것이 충분하지 않으면 그래픽 인터페이스를 통해 무제한으로 추가할 수 있습니다. 거기에서 불필요한 쌍을 삭제할 수도 있습니다.
GUI를 통해 내장 표시기의 추세 설정을 변경할 수도 있습니다.
표시기는 일, 주, 월, 연도의 최대값과 최소값을 찾습니다. 표는 최대/최소 값을 표시합니다. "최대-최소" 진폭은 각 기간에 대한 도구 설명에 표시됩니다.
가격이 최대 또는 최소값에 도달하면 해당 셀의 색상이 변경됩니다. 최대값이 Lime이면 최소값이 주황색입니다.
고가/저가도 현재 가격과 비교할 수 있으며, 이는 표에도 표시됩니다.
애플리케이션에는 MA-Cross, MACD, RSI의 3가지 지표가 내장되어 있습니다.
표에는 지표의 현재 값이 표시되며 추세 방향도 색상으로 표시됩니다.
표시기의 기본 설정은 메뉴에서 설정되며 모두 GUI를 통해 변경할 수 있습니다.
GUI 아래의 두꺼운 녹색 선을 두 번 클릭하면 응용 프로그램 메뉴가 열립니다.
입력 매개변수
MA_TF ... ... ... rsi_Periods - 표시기 입력 매개변수.
Symbol_01 ... Symbol_30은 관찰하려는 쌍의 이름입니다. 이름은 Market Watch 탭에 나타나는 대로 정확하게 입력해야 합니다. 대소문자, 점, 대시가 중요합니다.