Fracture
- 지표
- Nadiya Mirosh
- 버전: 1.0
- 활성화: 5
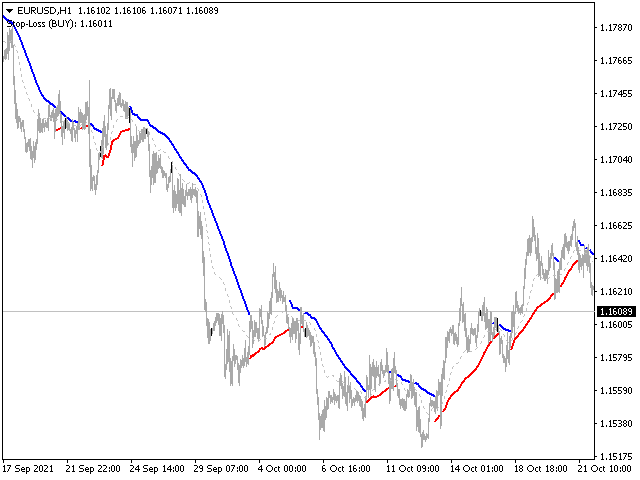
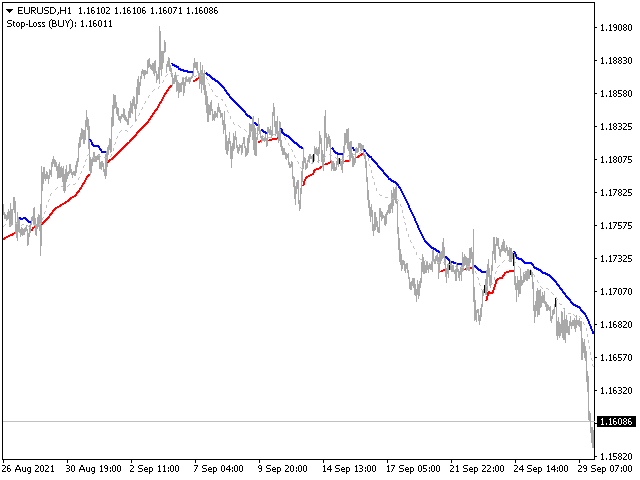
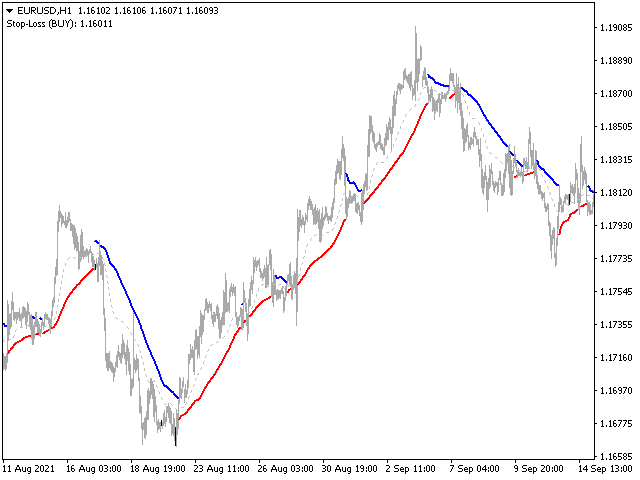
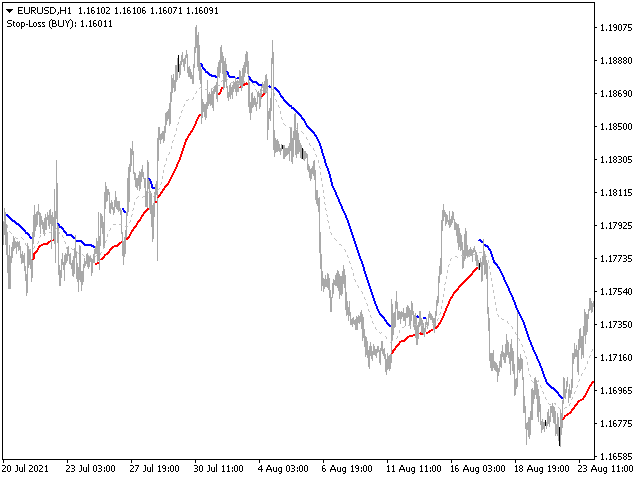
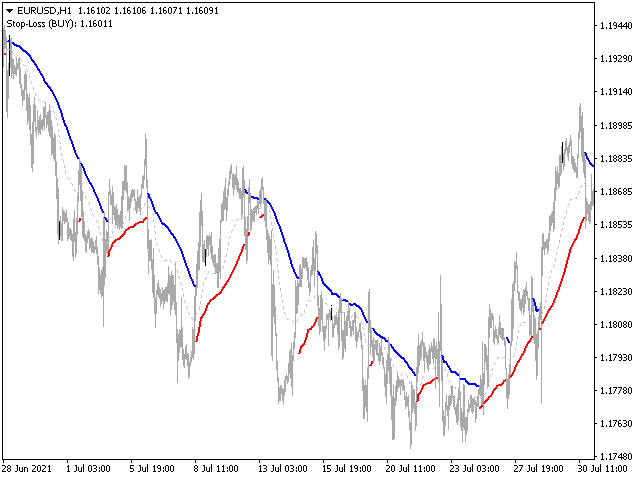
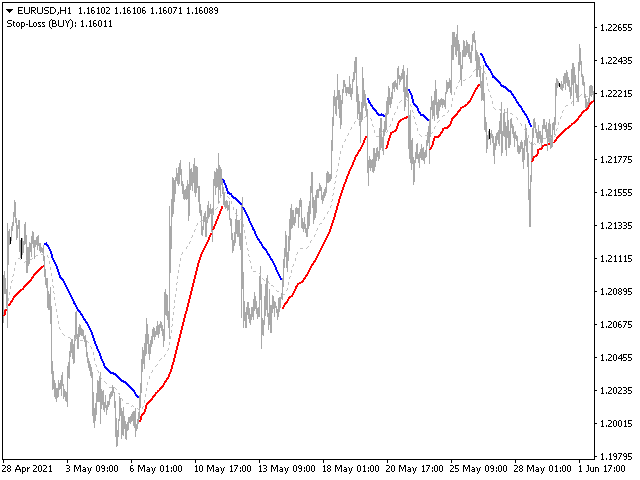
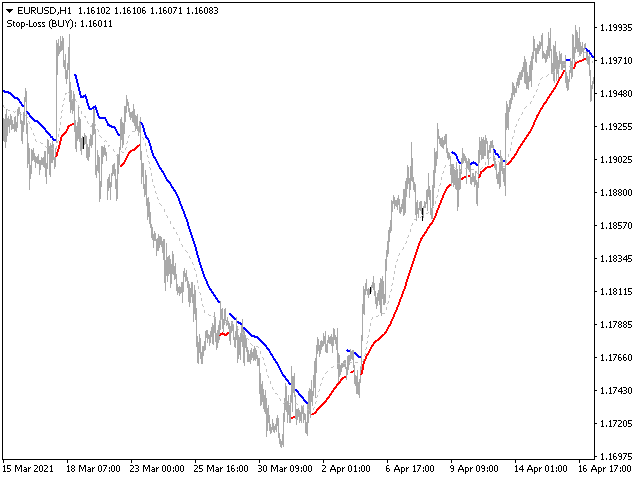
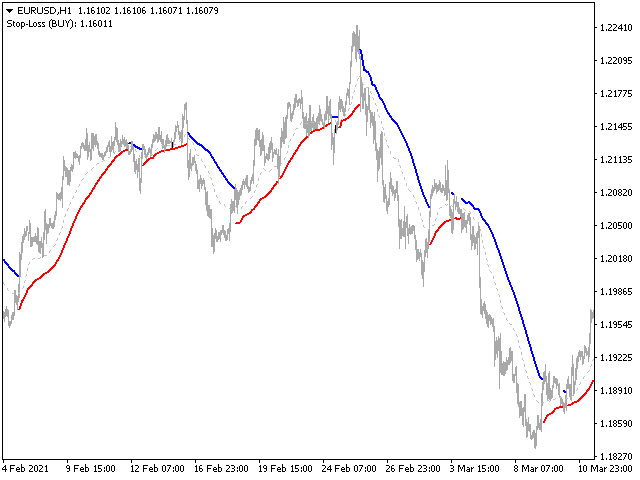
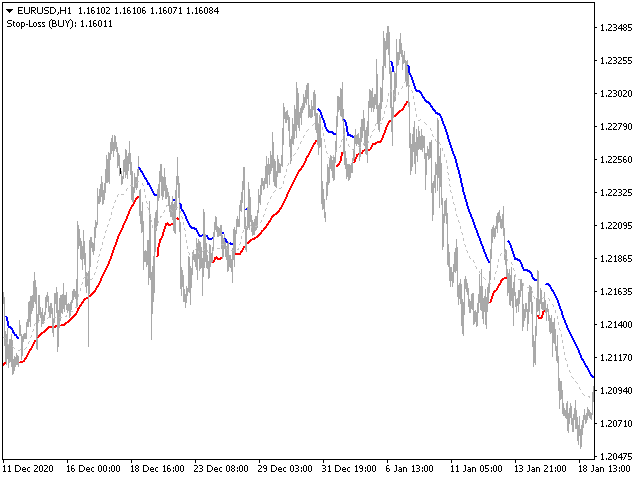
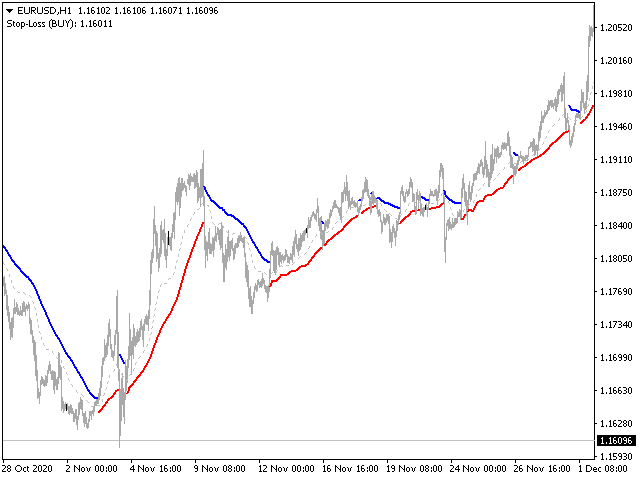
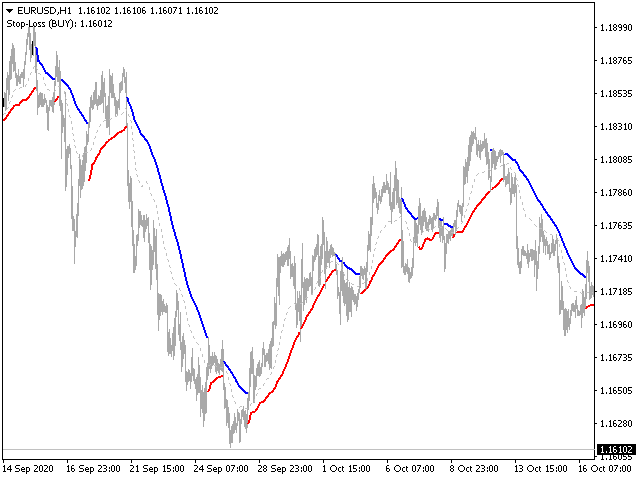
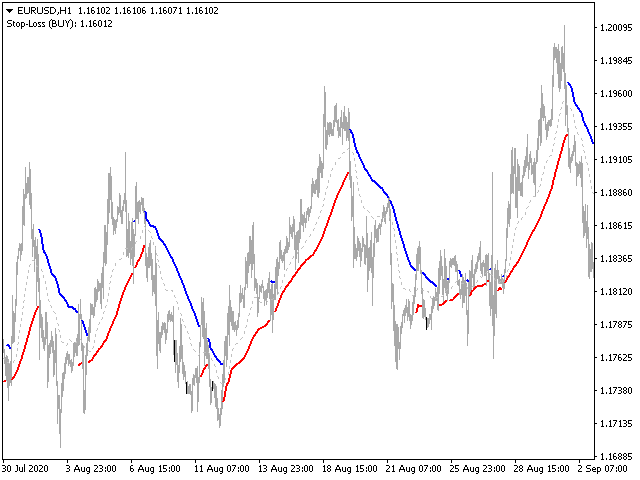
The Fracture indicator uses many moving averages that are with a given Length step. As a result of the work, the resulting lines are formed, which are displayed on the price chart as blue and red lines. The simplest use case for the indicator is to open a trade in the direction of an existing trend. The best result is obtained by combining the indicator with fundamental news; it can act as a news filter, that is, show how the market reacts to this or that news. The indicator lines can also be interpreted as the levels at which the stop loss should be set. The default indicator settings are quite effective most of the time. You can customize the indicator based on your needs.

