Cat bounce MT5
- 지표
- Dmitry Fedoseev
- 버전: 1.2
- 업데이트됨: 3 10월 2021
- 활성화: 5
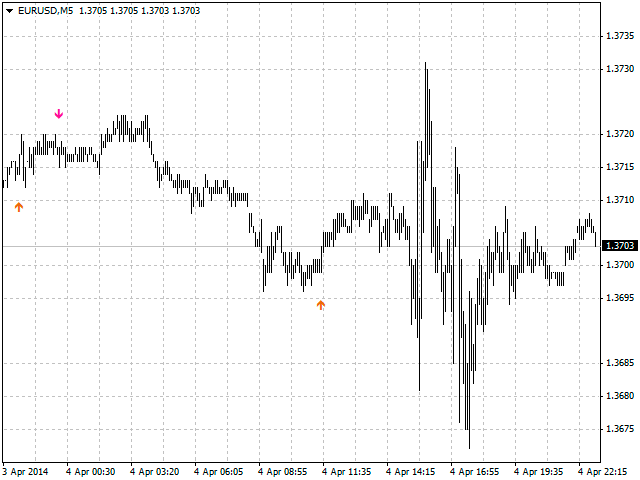
An indicator of pattern #54 ("Dead cat bounce") from Encyclopedia of Chart Patterns by Thomas N. Bulkowski.
Parameters:
- Alerts - show alert when an arrow appears
- Push - send a push notification when an arrow appears (requires configuration in the terminal)
- PeriodBars - indicator period
- ArrowType - a symbol from 1 to 17
- ArrowVShift - vertical shift of arrows in pixels.
Note. Arrows appear on a forming bar and do not disappear.
It cannot be guaranteed that the indicator recognizes the patterns exactly as implied by the author.
Recommended optimization parameters: PeriodBars.