• 미리보기
  • 리뷰 (1)
  • 코멘트

Secured

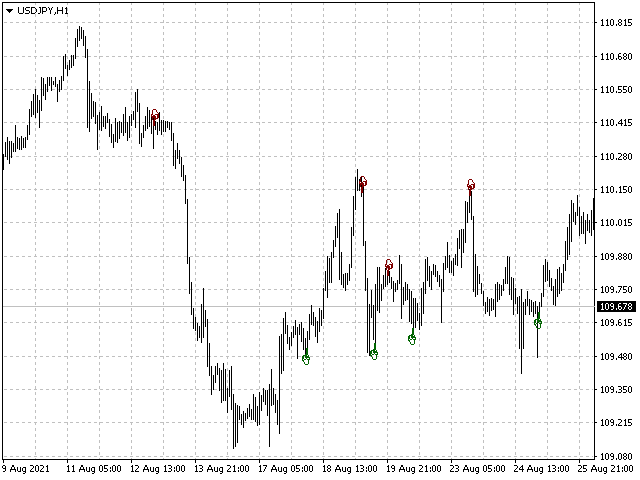
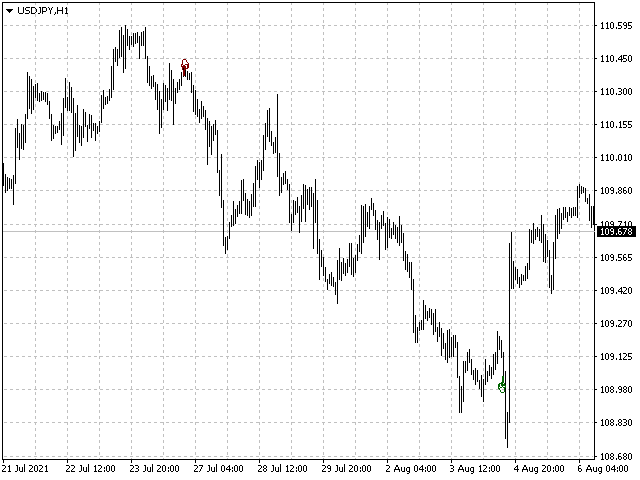
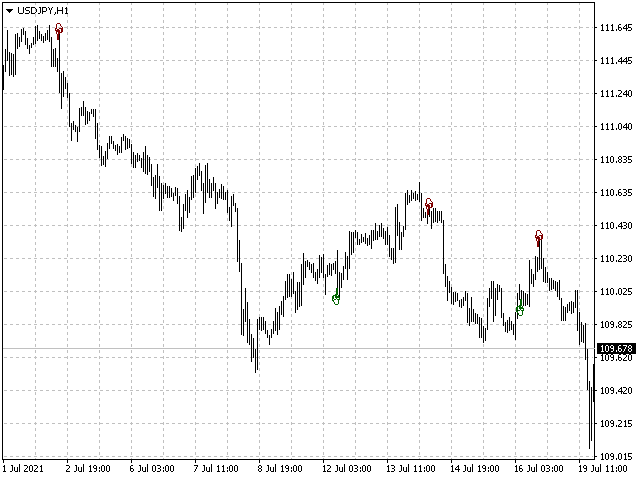
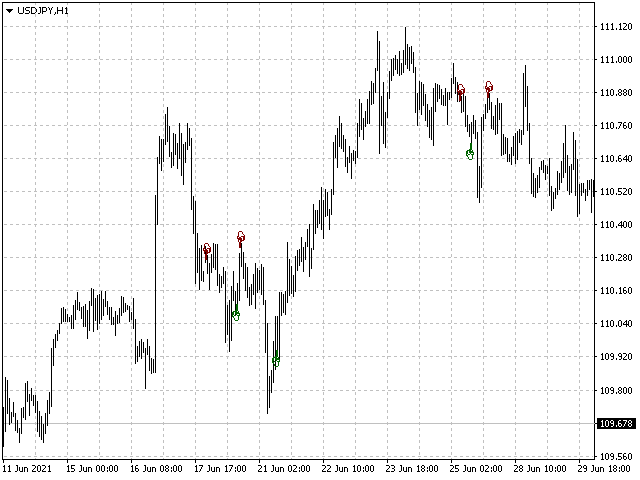
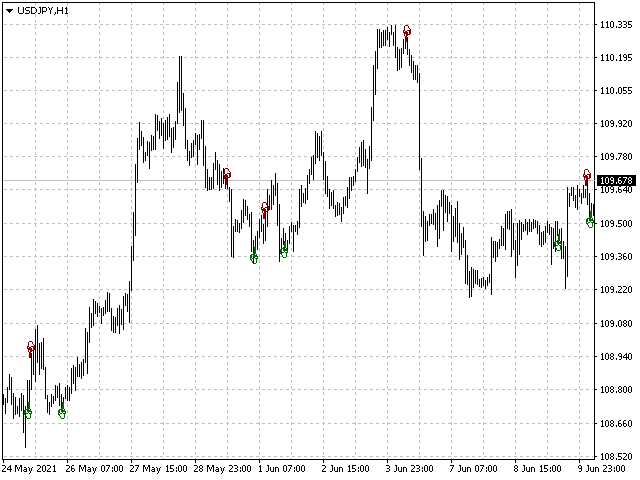
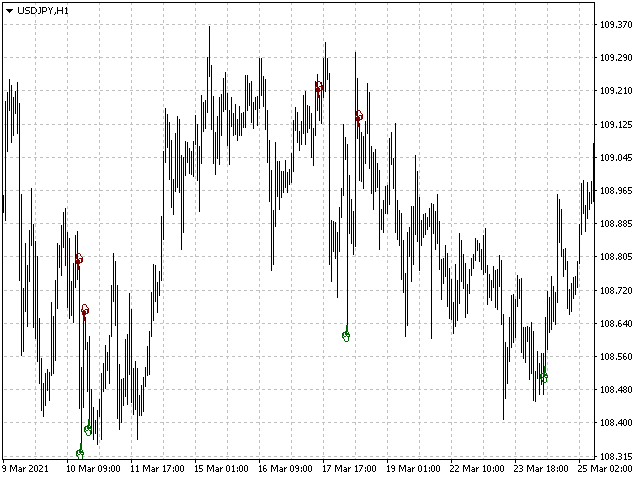
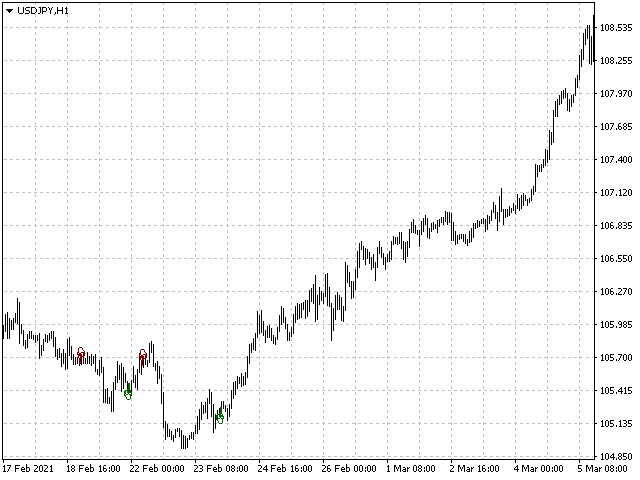
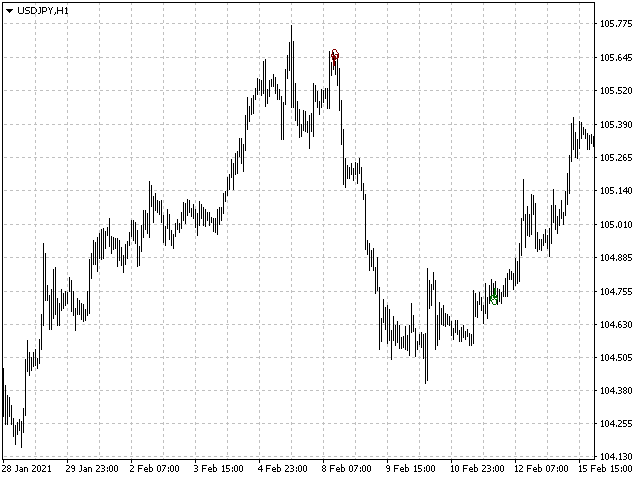
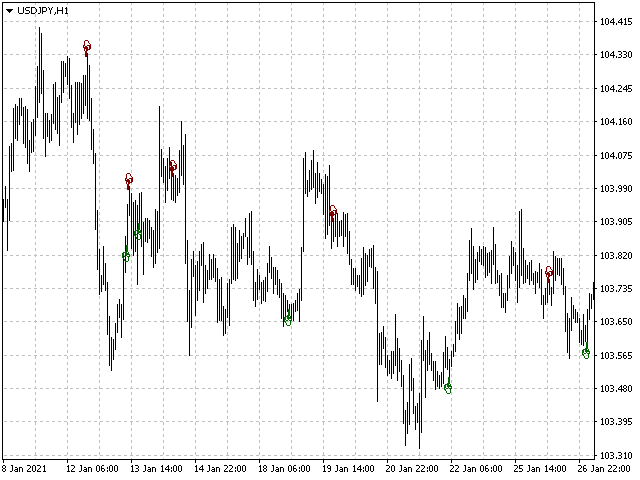
This tool scans the market looking for the correct entry. You can see and evaluate it yourself, perhaps it will suit you for a number of tasks related to forecasting price movements. It uses only price data and analytics to calculate entry points. Does not use auxiliary indicators. It has two parameters for customization.

Setting the indicator.
  • Interval - price analysis interval.
  • Subterfuge - analysis correction interval.
추천 제품
This indicator works on MT4 and is very easy to use. When you receive a signal from it, you wait for that candle with the signal to close and you enter your trade at the beginning of the next new candle . A red arrow means sell and a green arrow means buy. All arrows comes with Alert  like for easy identification of trade signal. Are you okay with that? 1 minute candle 1 minute expire
Rira Renko
Vitor Palmeira Abbehusen
RENKO on Time Chart This indicator is an enhanced Renko, so you can watch the Renko bricks on the chart to understand price movement more clearly the other improvement is automated box size according to ATR (Average True Range) period you can set the ATR number as you want and the box size of Renko changes automatically based on price movement Inputs Mode: Box size is the input to specify the size of the Renko box you want to print on the chart. This input lets you choose the fixed b
Signal From Level
Yaroslav Varankin
Binary Options Support Resistance Indicator This indicator is designed for binary options trading and effectively shows retracements from support and resistance levels. Signals appear on the current candle. A red arrow pointing downwards indicates a potential selling opportunity, while a blue arrow pointing upwards suggests buying opportunities. All that needs adjustment is the color of the signal arrows. It is recommended to use it on the M1-M5 timeframes as signals are frequent on these timef
Perfect for one minutes high trading and scalping. This indicator is very effective for trading on one minutes, in the hour. A combination of moving averages and STOCHASTICS calculation to produce a very convincing signal every hour. Blue colour signals a buy opportunity. Follow the X signs for possible buy points. The Blue average line serves as possible trend direction and support. Red colour signals a sell opportunity. Follow the X signs for possible sell points. The Red average line serves a
Renko, Heiken Ashi, Ticks Bar, Range Bar.    Easy switching, easy setup, all in one window.        Place the Custom Chart indicator and view Renko, Heiken Ashi, Tick bar, Range bar charts in real time at real chart.    Position the offline chart window so that the indicator control panel is visible.    Switch the chart mode by click of a button.    Connect to the output chart any indicator, expert advisor without any restrictions.    No, it doesn't work in the tester.    Yes, you can use an
Dynamic Forex28 Navigator
Bernhard Schweigert
5 (1)
Dynamic Forex28 Navigator - 차세대 외환 거래 도구. 현재 49% 할인. Dynamic Forex28 Navigator는 오랫동안 인기 있는 지표의 진화형으로, 세 가지의 힘을 하나로 결합했습니다. 고급 통화 Strength28 지표(695개 리뷰) + 고급 통화 IMPULSE with ALERT(520개 리뷰) + CS28 콤보 신호(보너스). 지표에 대한 자세한 정보 https://www.mql5.com/en/blogs/post/758844 차세대 Strength 지표는 무엇을 제공합니까?  원래 지표에서 좋아했던 모든 것이 새로운 기능과 더 높은 정확도로 강화되었습니다. 주요 기능: 독점적인 통화 Strength 공식.  모든 시간대에 걸쳐 부드럽고 정확한 강도선. 추세와 정확한 진입을 식별하는 데 이상적입니다. 역동적인 시장 피보나치 수준(시장 피보나치).  이 지표에만 있는 고유한 기능. 가격 차트가 아닌 통화 강도에 피보나치가 적용
This is an arrow indicator without a future function,developed based on the most advanced profit trading algorithms.It has the most innovative and advanced dual trend analysis module, as well as the latest and highly effective market trend prediction algorithm.Trends are your friends, and following larger trends can earn the maximum profit in foreign exchange. This indicator helps traders identify current trends and track them. Someone once made a profit of 10 times in a week by relying on it.No
The Pearson Trend!! My name is Murat Yazici. I have B.Sc. Statistics and M.Sc. Quantitative Methods degrees. I have several scientific papers, conference presentations in Texas, Toronto, London, Istanbul, books and book chapters studies, and many projects about mathematical and statistical modelling. I am also journal reviewer at some scientific journals. What is The Pearson Trend's Logic? It is based on   A Fuzzy Model  developed by me.  Vague or fuzzy data and application several fields,
XAUUSD points
Andrey Kozak
Price pivot point indicator. The indicator shows with points on the chart the places where the price can turn in the opposite direction. When the indicator draws a red dot, it means that the price can turn its movement down. When the indicator draws a blue dot, then the price can turn its move up. This indicator can be used for both manual trading and automated trading by integrating it into your robot. To do this, the indicator has data exchange buffers. Recommended currency pairs: XAUUSD EU
Gold Phoenix
Yaroslav Varankin
The perfect tool for Scalng in the Forex markets You can trade both from signal to signal and using take profit  The algorithm does not use Zigzag!  No redrawing!  This is a channel instrument that uses a moving average as a filter. Moving Average  There are 2 parameters for the settings Ma Period = 5 period Moving Average  Channel 1.0 distance of channel lines from the chart Price Signal Filter - calculation of signal opening and filter There is a complete set of Alert There is a multi-timefram
PZ Harmonacci Patterns
PZ TRADING SLU
3.17 (6)
Trade smarter, not harder: Empower your trading with Harmonacci Patterns Special Offer: Purchase now to receive free bonuses worth $165! (Read more for details) This is arguably the most complete harmonic price formation auto-recognition indicator you can find for the MetaTrader Platform. It detects 19 different patterns, takes fibonacci projections as seriously as you do, displays the Potential Reversal Zone (PRZ) and finds suitable stop-loss and take-profit levels. [ Installation Guide | Upda
Shark Deal Book
Philip Pankaj Suthagar
4 (3)
Term  "shark"  in the business world denotes a high volume investor who just made a good investment in a highly Potential business deal.So, sharks are the ones who make the market move. In our case, if an American shark bought a Japanese company, he/she has to convert American dollars into Japanese yen to make the deal. So, the demand for the Japanese yen will increase sharply. Thus USD/JPY will go short rapidly if the deal was from the shark. Another example, In the case of forex, if fed increa
SMT Divergence Pro
Suvashish Halder
SMT (Smart Money Technique) Divergence refers to the price divergence between correlated assets or their relationship to inversely correlated assets.  By analyzing SMT Divergence, traders can gain insights into the market's institutional structure and identify whether smart money is accumulating or distributing assets.  Every price fluctuation should be confirmed by market symmetry, and any price asymmetry indicates an SMT Divergence, suggesting a potential trend reversal. MT5 Version -  https:/
Power Renko MT4
Pierce Vallieres
Power Renko is an indicator which plots Renko bricks underneath the chart using a histogram. You can select the brick size and the timeframe of the Renko bricks as well as whether or not to use the close price or the high/low price of the candles. Renko bricks are based on price alone, not time, therefor the Renko bricks will not be aligned with the chart's time. They are extremely useful for trend trading and many different strategies can be formed from them. Buffers are provided allowing you t
SignalSailor
Tatiana Savkevych
The SignalSailor indicator is your reliable assistant in Forex for quick market analysis. It not only reflects the current market condition but also provides valuable signals about the best times to open trades. Market conditions are constantly changing, and to stay ahead, a trader needs to quickly adapt their strategies. This is precisely why the Klaus indicator was created - it will help you accurately determine the direction of the trend on the price chart. SignalSailor is an indispensable
Credible Cross System
Muhammed Emin Ugur
Credible Cross System   indicator is designed for signal trading. This indicator generates trend signals. It uses many algorithms and indicators to generate this signal. It tries to generate a signal from the points with the highest trend potential. The indicator works based on instant price movements. This indicator is a complete trading product. This indicator does not need any additional indicators. The indicator certainly does not repaint. The point at which the signal is given does not
Pair Trading Station MT4
Young Ho Seo
3.67 (3)
How to use Pair Trading Station Pair Trading Station is recommended for H1 time frame and you can use it for any currency pairs. To generate buy and sell signal, follow few steps below to apply Pair Trading Station to your MetaTrader terminal. When you load Pair Trading Station on your chart, Pair Trading station will assess available historical data in your MetaTrader platforms for each currency pair. On your chart, the amount of historical data available will be displayed for each currency pai
Pattern 123
Pavel Verveyko
"Pattern 123" is an indicator-a trading system built on a popular pattern, pattern 123. This is the moment when we expect a reversal on the older trend and enter the continuation of the small trend, its 3rd impulse. The indicator displays signals and markings on an open chart. You can enable/disable graphical constructions in the settings. The indicator has a built-in notification system (email, mobile terminal, standard terminal alert). "Pattern 123" has a table that displays signals from
Good Signal
Yaroslav Varankin
The indicator is designed for binary options and short-term transactions on Forex To enter a trade when a signal appears blue up arrow buy red down arrow sell signal For Forex enter on a signal exit on the opposite signal or take profit For binary options Enter on 1 candle, if the deal goes negative, set a catch on the next candle Works on all timeframes If you apply a filter like Rsi, you will get a good reliable strategy.. The algorithm is at the stage of improvement and will be further develo
True Magic Oscillator
Muhammed Emin Ugur
The   True Magic Oscillator   indicator is designed for signal trading. This indicator generates trend signals. It uses many algorithms and indicators to generate this signal. It tries to generate signals from the points with the highest trend potential. This indicator is a complete trading product. This indicator does not need any additional indicators. The indicator is never repainted. The point at which the signal is given does not change.         Features and Recommendations Wor
Crosskalp1
Mikhail Bilan
Добрый День уважаемые трейдеры!  Вашему вниманию индикатор созданный и работающий на базе трендовика ADX,  для торговли на смене направления движения который учитывает коррекцию и даёт возможность на ней заработать.  Применяю этот индикатор для скальпинга. Рекомендую таймфреймы от 15 ти минутного(М15) до часового (Н1) периодов.  Красный кружок сигнал на продажу- Sell) Зелёный кружок  сигнал на покупку Buy) Чем меньше ваш таймфрейм тем меньше пунктов вы зарабатываете.   Важно выставлять стопы! !В
Automated Trendlines
Georgios Kalomoiropoulos
5 (16)
추세선은 외환 거래에서 기술적 분석의 가장 필수적인 도구입니다. 불행히도, 대부분의 거래자는 올바르게 그리지 않습니다. 자동 추세선 표시기는 시장의 추세 움직임을 시각화하는 데 도움이 되는 진지한 거래자를 위한 전문 도구입니다. 추세선 강세 추세선과 약세 추세선에는 두 가지 유형이 있습니다. 상승 추세에서 Forex 추세선은 가격 움직임의 가장 낮은 스윙 포인트를 통해 그려집니다. 최소 두 개의 "최저 저점"을 연결하면 추세선이 생성됩니다. 하락 추세에서 추세선은 가격 움직임의 가장 높은 스윙 포인트를 통해 그려집니다. 최소 두 개의 "최고 최고점"을 연결하면 추세선이 생성됩니다. 추세선이 깨질 때? 강세 추세선은 약세 양초가 강세 추세선 아래에서 닫히고 양초의 고점이 추세선 위에 있을 때 깨집니다. 약세 추세선은 강세 양초가 약세 추세선 위로 마감되고 양초 저점이 추세선 아래에 있을 때 깨집니다. 추세선이 삭제되면? 강세 추
FX Flow
Eva Stella Conti
FX Flow   indicator can be used as an anticipator of the next trend, preferably confirmed by Price Action or another oscillator (RSi, Stochastic ..). It takes the money flows of the major currencies USD EUR GBP AUD NZD CAD CHF JPY into account, and processes them. Excellent tool for indices, but also for correlations between currencies. Works on each timeframes.  Blue line: Bull market Yellow line: Bear market Note : if the indicator opens the window, but does not draw lines, load the histo
This indicator detects Inside Bar Narrow Range 4 and Inside Bar Narrow Range 7 two powerful patterns on 28 pairs on all timeframes.  "Inside Bar Narrow Range 4"  is an inside bar with the narrowest range out of the last 4 bars so "Inside Bar Narrow Range 7" an inside bar with the narrowest range  out of the last 7 bars. Hence, IBNR4 and better IBNR7 are an objective criterion for identifying  decreased range and volatility. Once we find an IBNR4 or an IBNR7 pattern, we aim to trade the breakou
Super Reversal Pattern
Parfait Mujinga Ndalika
Super Reversal Pattern Indicator Unlock the power of advanced pattern recognition with our Super Reversal Pattern Indicator. Designed for traders seeking precision and reliability, this indicator identifies one of the most effective reversal patterns in technical analysis, offering a significant edge in your trading strategy. Key Features: Non-Repainting Accuracy: Enjoy the confidence of non-repainting technology. Once a Super Reversal Pattern is detected, it remains static, providing consis
Advanced Stochastic Scalper
Evgeny Belyaev
4.53 (15)
Advanced Stochastic Scalper - is a professional indicator based on the popular Stochastic Oscillator. Advanced Stochastic Scalper is an oscillator with dynamic overbought and oversold levels, while in the standard Stochastic Oscillator, these levels are static and do not change. This allows Advanced Stochastic Scalper to adapt to the ever-changing market. When a buy or a sell signal appears, an arrow is drawn on the chart and an alert is triggered allowing you to open a position in a timely mann
BSA Indicator
Ahmet Metin Yilmaz
BSA indicator is a ZigZag based indicator. This indicator is used to find the reversal level of the price. You can use the existing risk ratio and calculation timeframe in the entries by optimizing them according to your usage preference.  In lower time frames, the indicator can repaint. For healthier results, you can detect the least repainting by observing for a while according to the graphic you will apply.
우선적으로 이 거래 시스템은 다시 그리지 않고, 다시 그리지 않으며, 지연되지 않는 것을 강조할 가치가 있습니다. 이는 전문적인 거래에 이상적입니다. 온라인 강좌, 사용자 매뉴얼 및 데모. "스마트 서포트 앤 레지스턴스 트레이딩 시스템"은 새로운 및 경험 많은 트레이더를 위해 개발된 고급 지표입니다. 이 시스템은 외환 시장에서 정밀도와 신뢰감을 제공합니다. 이 포괄적인 시스템은 일일 거래 전략, 스윙 거래 전략, 지원 및 저항 전략, 캔들스틱 패턴 전략, VWAP 전략, 다중 시간대 추세 전략 등을 포함한 7개 이상의 전략, 10개의 지표 및 다양한 거래 방식을 결합합니다. 이 시스템은 화살표 신호, 진입 및 출구 지점, 거래 경보, 높은 시간대 추세 분석, 실시간 거래 모니터링 및 트렌드 및 볼륨 캔들 색상 제공합니다. 자동 지원 및 저항 감지로 다양한 시장 상황에서 신중한 결정을 돕는 다면적 인 지표입니다. 스마트 서포트 앤 레지스턴스 트레이딩 시스템은 프리미엄 및 강력한
PRO Renko System
Oleg Rodin
5 (25)
PRO Renko System 은 RENKO 차트 거래를 위해 특별히 고안된 매우 정확한 거래 시스템입니다. 이것은 다양한 거래 상품에 적용될 수있는 보편적 인 시스템입니다. 체계는 효과적으로 당신에게 정확한 반전 신호에 접근을 주는 소위 시장 소음을 중화합니다. 이 표시기는 사용하기가 매우 쉽고 신호 생성을 담당하는 매개 변수가 하나만 있습니다. 당신은 쉽게 당신의 선택의 어떤 무역 계기에 공구를 적응시킬 수 있고 renko 막대기의 크기. 나는 항상 당신이 내 소프트웨어로 수익성있게 거래 할 수 있도록 추가 지원을 제공 할 준비가되어 있습니다! 나는 당신에게 행복하고 수익성있는 거래를 기원합니다! 구매 후 저에게 연락하십시오! 내 렌코 차트 생성기를 보내드립니다. 또한 내 개인 권장 사항 및 시스템의 다른 모듈을 무료로 공유 할 것입니다!
Professional Level
Yaroslav Varankin
indicator for trading binary options and forex trading. The indicator does not redraw the readings. when trading binary options, testing was performed. This indicator showed the good results correct predictions. Under these conditions, the eur / usd m1 chart, when a signal appears, the transaction opens in the direction indicated by the indicator for 5 candles, then the truth is (5 minutes since in us the 1-minute chart of a candlestick is 1 minute) the result was. When trading in the forex
이 제품의 구매자들이 또한 구매함
현재 20% 할인 ! 초보자 또는 전문가 트레이더를 위한 최고의 솔루션! 이 대시보드 소프트웨어는 28개의 통화 쌍에서 작동합니다. 2가지 주요 지표(Advanced Currency Strength 28 및 Advanced Currency Impulse)를 기반으로 합니다. 전체 Forex 시장에 대한 훌륭한 개요를 제공합니다. 고급 통화 강도 값, 통화 이동 속도 및 모든(9) 시간대의 28 Forex 쌍에 대한 신호를 보여줍니다. 추세 및/또는 스캘핑 기회를 정확히 파악하기 위해 차트의 단일 지표를 사용하여 전체 시장을 볼 수 있을 때 거래가 어떻게 개선될지 상상해 보십시오! 잠재적인 거래를 식별하고 확인하면서 강력한 통화와 약한 통화를 더욱 쉽게 식별할 수 있도록 이 지표에 기능을 내장했습니다. 이 표시기는 통화의 강세 또는 약세가 증가 또는 감소하는지 여부와 모든 시간대에서 수행되는 방식을 그래픽으로 보여줍니다. 추가된 새로운 기능은 현재 시장 조건 변화에 적
TPSpro RFI Levels
Roman Podpora
4.82 (22)
지침         러시아   -        영어       표시기와 함께 사용하는 것이 좋습니다   .       -       TPSpro   트렌드 프로 -   MT4 버전         거래에서 핵심 요소는 거래 상품을 매수 또는 매도하기로 결정하는 구역 또는 수준입니다. 주요 업체가 시장에서 자신의 존재를 숨기려는 시도에도 불구하고, 그들은 필연적으로 흔적을 남깁니다. 우리의 과제는 이러한 흔적을 식별하고 올바르게 해석하는 방법을 배우는 것이었습니다. 주요 기능:: 판매자와 구매자를 위한 활성 영역을 표시합니다! 이 지표는 매수 및 매도를 위한 모든 올바른 초기 임펄스 레벨/존을 보여줍니다. 진입점 검색이 시작되는 이러한 레벨/존이 활성화되면 레벨의 색상이 바뀌고 특정 음영으로 채워집니다. 또한 상황을 보다 직관적으로 이해하기 위해 화살표가 나타납니다. 더 높은 시간대의 레벨/존 표시(MTF 모드) 더 높은 시간 간격을 사용하여 레벨/존을 표시하는 기능을 추가했습니다.
Apollo Pips PLUS SP
Oleg Rodin
5 (4)
제품을 구매하기 전에 아래 정보를 읽어보세요! Apollo Pips PLUS SP는 독특한 제품입니다! 모든 거래 지표에 액세스할 수 있는 새로운 "APOLLO PIPS" 지표와 "슈퍼 팩" 보너스를 받고 싶은 분들을 위한 것입니다! Apollo Pips PLUS SP 제품을 구매하면 실제로 Apollo Pips 표시기의 완전히 새로운 버전을 구매하게 됩니다. 이 버전의 지표에는 개선된 알고리즘과 사용하기 쉬운 매개변수가 있어 모든 시장 및 거래 스타일에서 지표를 사용할 수 있는 기회를 제공합니다. 이 제품의 구매자는 슈퍼 보너스로 다른 모든 표시기에 무료로 액세스할 수 있습니다! 내 모든 거래 도구에 액세스하고 싶었다면 이 제품이 당신에게 딱 맞습니다! :) 하지만 이것이 전부는 아닙니다! :) 이 제품의 모든 구매자는 또한 내 새로운 지표를 무료로 받을 자격이 있습니다! :) 새로운 거래 지표를 사용할 수 있게 되었는데, 귀하는 저의 특별한 "SUPER PACK" 평생 보너스
Gold Channel XAUUSD
Paulo Rocha
5 (2)
Gold Channel is a volatility-based indicator, developed with a specific timing algorithm for the XAUUSD pair, which consists of finding possible corrections in the market. This indicator shows two outer lines, an inner line (retracement line) and an arrow sign, where the theory of the channel is to help identify overbought and oversold conditions in the market. The market price will generally fall between the boundaries of the channel. If prices touch or move outside the channel it is a tra
Atomic Analyst
Issam Kassas
5 (2)
우선적으로 언급할 점은이 거래 지표가 다시 그리지 않고 지연되지 않으며 이를 통해 수동 및 로봇 거래 모두에 이상적이라는 점입니다. 사용자 매뉴얼: 설정, 입력 및 전략. Atomic Analyst는 가격의 강도와 모멘텀을 활용하여 시장에서 더 나은 이점을 찾는 PA Price Action Indicator입니다. 고급 필터를 장착하여 잡음과 거짓 신호를 제거하고 거래 잠재력을 높이는 데 도움이 됩니다. 복잡한 지표의 다중 레이어를 사용하여 Atomic Analyst는 차트를 스캔하고 복잡한 수학적 계산을 간단한 신호와 색상으로 변환하여 초보 트레이더가 이해하고 일관된 거래 결정을 내릴 수 있도록합니다. "Atomic Analyst"는 새로운 및 경험이 풍부한 트레이더를위한 종합적인 거래 솔루션입니다. 프리미엄 지표와 최고 수준의 기능을 하나의 거래 전략에 결합하여 모든 종류의 트레이더에 대한 다재다능한 선택지가되었습니다. 인트라데이 거래 및 스캘핑 전략 : 빠르고 정확한
M1 Gold
Abdulkarim Karazon
Enigmera
Ivan Stefanov
5 (3)
에니메라: 시장의 핵심 https://www.enigmera.com 소개 이 지표 및 트레이딩 시스템은 금융 시장에 대한 놀라운 접근 방식입니다. 에니메라는 프랙탈 주기를 사용하여 지지선과 저항선을 정확하게 계산합니다. 진정한 축적 단계를 보여주고 방향과 목표를 제시합니다.  추세에 있든 조정에 있든 작동하는 시스템입니다.  어떻게 작동하나요? 에니메라는 지지선/저항선, 목표선, 편차선의 세 가지 라인으로 구성됩니다. 이 시스템은 과거 데이터를 현재와 미래로 추정하는 일반적인 시장 지표와 달리 현재에 대한 완전한 그림을 제공합니다. 지지선 위에 있으면 실제 지지를 의미하고 저항선 위에 있으면 실제 저항을 의미합니다. 레벨이 깨지면 추세의 변화를 나타냅니다. 다시 그리지 않습니다. 시장이 지속적으로 진화함에 따라 에니메라는 평가 도구를 조정하여 전략을 정기적으로 수정합니다.   이를 통해 모든 시나리오를 철저히 평가할 수 있습니다. 이 시장 지표의 고유성은 분명하며 그 기
Dear traders I am happy to introduce to you my new tool called "Brilliant Oscillator" Indicator. This is one of the indicators that can be used as a stand alone indicator. WHAT I LIKE ABOUT THIS TOOL IS Fast and reliable signals Purpose The purpose of this tool is to assist both newbie and Advanced traders to analyze the market with high level of accuracy in both bearish and bullish market trends. The inputs In the input section you will be able to change colors of the indicator only. Currency p
TrendMaestro
Stefano Frisetti
5 (3)
note: this indicator is for METATRADER4, if you want the version for METATRADER5 this is the link:  https://www.mql5.com/it/market/product/108106 TRENDMAESTRO ver 2.4 TRENDMAESTRO recognizes a new TREND in the bud, he never makes mistakes. The certainty of identifying a new TREND is priceless. DESCRIPTION TRENDMAESTRO identifies a new TREND in the bud, this indicator examines the volatility, volumes and momentum to identify the moment in which there is an explosion of one or more of these data a
Supply and Demand Dashboard PRO
Bernhard Schweigert
4.8 (20)
현재 20% 할인! 이 대시보드는 여러 기호와 최대 9개의 타임프레임에서 작동하는 매우 강력한 소프트웨어입니다. 주요 지표(최상의 리뷰: 고급 공급 수요)를 기반으로 합니다.   Advanced Supply Demand 대시보드는 훌륭한 개요를 제공합니다. 다음과 같이 표시됩니다.  영역 강도 등급을 포함하여 필터링된 공급 및 수요 값, 영역에 대한/및 영역 내 Pips 거리, 중첩된 영역을 강조 표시하고 모든 (9) 시간 프레임에서 선택한 기호에 대해 4가지 종류의 경고를 제공합니다. 그것은 당신의 개인적인 필요에 맞게 고도로 구성 가능합니다! 당신의 혜택! 모든 트레이더에게 가장 중요한 질문: 시장에 진입하기에 가장 좋은 수준은 무엇입니까? 최고의 성공 기회와 위험/보상을 얻으려면 강력한 공급/수요 영역 내 또는 그 근처에서 거래를 시작하십시오. 손절매를 위한 최적의 장소는 어디입니까? 가장 안전하려면 강력한 수요/공급 구역 아래/위에 정
Gann Signal Scaner
Kirill Borovskii
This indicator is based on the Gann Signal indicator and acts as a market scanner. All you need to do is fill in the selected currency pairs in the settings and that’s it. Next, the indicator itself will view all these currency pairs and time frames from M5 to D1 simultaneously. When a new signal appears, the indicator will give you an Alert and also draw the letter N where this new signal will be.
PTS Precision Index Oscillator V2
PrecisionTradingSystems
5 (1)
프리시전 트레이딩 시스템의 로저 메드칼프에 의한 프리시전 인덱스 오실레이터 (Pi-Osc) 버전 2는 차트에 신속하게 로드되도록 주의 깊게 다시 코딩되었으며 경험을 향상시키기 위해 몇 가지 다른 기술적 개선 사항이 통합되었습니다. Pi-Osc는 정확한 거래 타이밍 신호를 제공하도록 개발되었으며 시장이 모든 사람의 스톱을 청산하기 위해 가야 하는 극도의 고갈 지점을 찾는 데 목적이 있습니다. 이 제품은 극단적인 지점이 어디에 있는지 알고 있는 고전적인 문제를 해결하며 트레이더로서의 삶을 훨씬 간단하게 만듭니다. 이것은 업계 표준 오실레이터와는 상당히 다른 강력한 차이점을 가지고 있는 고도로 복잡한 합의 지표입니다. 사용하는 기능 중 일부는 수요 지수, 자금 흐름, RSI, 스토캐스틱, 패턴 인식, 거래량 분석, 표준 편차 극단점 및 다양한 길이에서 위와 유사한 변형을 갖습니다. 미숙한 눈에는 다른 오실레이터와 비슷해 보일 수 있지만 RSI 또는 모멘텀과 같은 다
Bomb Bank Signal
Igor Pereira Calil
5 (1)
폭탄 은행 신호: MetaTrader 4의 신뢰도 지표 Bomb Bank Signal은 금융 시장에서 가장 관련성이 높은 추세를 식별하도록 설계된 MetaTrader 4의 강력한 지표입니다. 움직임을 정확하게 예측하는 도구를 찾고 있다면 Bomb Bank가 바로 여러분에게 필요한 동맹입니다. 작동 방식: 이 지표는 거래량 분석, 양초 종가, 대칭 추세 등 세 가지 방법을 결합하여 매수 및 매도 기회를 감지하고 신호를 보냅니다. Bomb Bank는 매수 기회를 포착할 때는 '폭탄'과 같고, 매도 신호를 감지할 때에는 '해골'과 같습니다. 폭탄 은행은 왜 다른가요? 완전한 신뢰성: 폭탄 은행 신호는 신호를 제거하지 않습니다. 일단 신호가 발행되면 그 신호는 계속 유지되므로 기회를 절대 놓치지 않습니다. 극도의 정확성: Bomb Bank는 잘못된 신호를 보내지 않습니다. 시장이 발전함에 따라 조정하면서 실시간으로 업데이트하지만 이전 신호의 투명성은 유지합니다. 실시간
NAM Order Blocks
NAM TECH GROUP, CORP.
5 (1)
MT4 Multi-timeframe Order Blocks detection indicator. Features - Fully customizable on chart control panel, provides complete interaction. - Hide and show control panel wherever you want. - Detect OBs on multiple timeframes. - Select OBs quantity to display. - Different OBs user interface. - Different filters on OBs. - OB proximity alert. - ADR High and Low lines. - Notification service (Screen alerts | Push notifications). Summary Order block is a market behavior that indicates order collection
RelicusRoad Pro
Relicus LLC
4.64 (103)
이제 $ 147 (몇 가지 업데이트 후 $ 499 증가) - 무제한 계정 (PCS 또는 MACS) RelicusRoad 사용 설명서 + 교육 비디오 + 비공개 Discord 그룹 액세스 + VIP 상태 시장을 보는 새로운 방법 RelicusRoad는 외환, 선물, 암호화폐, 주식 및 지수에 대한 세계에서 가장 강력한 거래 지표로서 거래자에게 수익성을 유지하는 데 필요한 모든 정보와 도구를 제공합니다. 우리는 초보자부터 고급까지 모든 거래자가 성공할 수 있도록 기술적 분석 및 거래 계획을 제공합니다. 미래 시장을 예측할 수 있는 충분한 정보를 제공하는 핵심 거래 지표입니다. 우리는 차트에서 말이 안 되는 여러 지표 대신 완전한 솔루션을 믿습니다. 타의 추종을 불허하는 매우 정확한 신호, 화살표 + 가격 조치 정보를 표시하는 올인원 표시기입니다. 강력한 AI를 기반으로 하는 RelicusRoad는 누락된 정보와 도구를 제공하여 교육하고 성공적인 트레이더인 트레이딩 전문
Quantum Trend Monitor Indicator
QUANTUM TRADING SOFTWARE LIMITED
Currency pairs never go up or down in a straight line. They rise and fall constantly, creating pullbacks and reversals. And with each rise and fall, so your emotions rise and fall. Hope, then fear, then hope. This is when the market will try to frighten you out of a strong position. It is when you are most vulnerable. But not if you have the Quantum Trend Monitor. And here, you even get two indicators for the price of one! The Quantum Trend Monitor has been designed to absorb these temporary pau
Quantum Volume Point of Control Indicator
QUANTUM TRADING SOFTWARE LIMITED
5 (1)
The Quantum VPOC indicator has been developed to expand the two dimensional study of volume and price, to a three dimensional one which embraces time. The volume/price/time relationship then provides real insight to the inner workings of the market and the heartbeat of sentiment and risk which drives the price action accordingly. The Quantum VPOC indicator displays several key pieces of information on the chart as follows: Volume Profile - this appears as a histogram of volume on the vertical pr
Indicator : RealValueIndicator Description : RealValueIndicator is a powerful tool designed specifically for trading on the EURUSD pair. This indicator analyzes all EUR and USD pairs, calculates their real currency strength values, and displays them as a single realistic value to give you a head start on price. This indicator will tell you moves before they happen if you use it right. RealValueIndicator allows you to get a quick and accurate overview of the EURUSD currency pair tops and bottoms,
Introduction to Fractal Pattern Scanner Fractal Indicator refers to the technical indicator that makes use of the fractal geometry found in the financial market. Fractal Pattern Scanner is the advanced Fractal Indicator that brings the latest trading technology after the extensive research and development work in the fractal geometry in the financial market. The most important feature in Fractal Pattern Scanner is the ability to measure the turning point probability as well as the trend probabi
AT Forex Indicator MT4
Marzena Maria Szmit
5 (3)
The AT Forex Indicator MT4 is a sophisticated trading tool designed to provide traders with a comprehensive analysis of multiple currency pairs. This   powerful indicator   simplifies the complex nature of the forex market, making it accessible for both novice and experienced traders. AT Forex Indicator uses   advanced algorithms   to detect trends, patterns and is an essential tool for traders aiming to enhance their forex trading performance. With its robust features, ease of use, and reliabl
Precautions for subscribing to indicator This indicator only supports the computer version of MT4 Does not support MT5, mobile phones, tablets The indicator only shows the day's entry arrow The previous history arrow will not be displayed (Live broadcast is for demonstration) The indicator is a trading aid Is not a EA automatic trading No copy trading function The indicator only indicates the entry position No exit (target profit)  The entry stop loss point is set at 30-50 PIPS Or the front
이 지표는 실용적인 거래를위한 완벽한 웨이브 자동 분석 지표입니다! =》Increase the choice of international style mode, (red fall green rise style) 대역의 표준화된 정의는 더 이상 다른 사람들의 물결이 아니며 인공 간섭의 그림이 제거되어 접근 방식의 엄격한 분석에서 핵심 역할을 합니다.             현재 구매 할인 중!   색인 내용: 1.         기본파동:   첫째, 가격변동과정에서 기본변동의 변곡점을 찾았고, 물론 그의 주문이 너무 강하지 않아 다음 계산의 기초가 된다. 2.         2차 대역   : 기본파를 기반으로 알고리즘 분석을 통해 보다 명확한 2차 대역을 획득하고, 2차 대역은 파동 분석의 기반 제공 삼.         Wave:   추세가 더 명확하고 직관적이고 방향성이 있습니다.파동의 지속 여부를 분석하기 위해서는 2차 파동 대역의 형태를 살펴보고, 2차 파동의 구성을
DashBoard Multi TimeFrame
Harikrishna Darapaneni
This indicator ( dashboard) provides trend for multi currency on multi timeframe Charts. It gives entries and Stoploss on the chart itself  if the currency pair is uptrend then the cell color is displayed as Green and if its downtrend the cell displays the color as Red Alerts are generated whenever the trend changes on that particular timeframe. can customize the time frames as desired
Beast Indicator V7
Mohamed Ahmed Sh Muhumed
Step into the future of automated trading with the Beast Indicator V7, The indicator allows you to trade binary options. T his indicator give high winning ratio with over 20 years of backtesting  an unparalleled tool that seamlessly transforms your trading journey into an effortless and lucrative venture. Designed to simplify and optimize the trading process, the Beast Indicator is the ultimate game-changer, offering a hassle-free experience that allows you to set your buy and sell options effo
ECM Elite Channel is a volatility-based indicator, developed with a specific time algorithm, which consists of finding possible corrections in the market. This indicator shows two outer lines, an inner line (retracement line) and an arrow sign, where the channel theory is to help identify overbought and oversold conditions in the market. The market price will generally fall between the boundaries of the channel. If prices touch or move outside the channel, it's a trading opportunity. The
ON Trade Optuma Astro
Abdullah Alrai
5 (4)
물론입니다. 아래는 제공해주신 텍스트의 한국어 번역입니다: MT4용 천문학 지표 소개: 귀하의 최상급 하늘 트레이딩 동반자 트레이딩 경험을 천체의 높이로 끌어올리기 준비가 되셨나요? MT4용 천문학 지표를 소개합니다. 이 혁신적인 도구는 복잡한 알고리즘의 힘을 활용하여 탁월한 천문학적 통찰과 정밀한 계산을 제공합니다. 정보의 우주를 손에 담다: 천문학적 데이터의 보물함을 드러내는 포괄적인 패널을 살펴보세요. 행성의 지오/헬리오센트릭 좌표, 태양/지구 거리, 크기, 길이, 별자리, 황도 좌표 및 적도 좌표, 심지어 수평 좌표 등 각각이 정밀하게 계산되고 아름답게 제시됩니다. 지표에 의해 생성된 수직선은 시간 값에 해당하여 트레이딩 여정에 우주적인 시각을 부여합니다. 행성 라인과 관계: 수정 가능한 스케일과 각도로 차트를 장식하는 행성 라인의 마법을 경험해보세요. 직관적인 컨트롤 패널을 통해 각 행성의 라인의 가시성을 손쉽게 전환할 수 있습니다. 쥰션이나 섹스타일, 사분각, 삼분각, 트
The indicator " ZigZag on Trend " is an assistant in determining the direction of price movement, as well as a calculator of bars and points. It consists of a trend indicator, which follows the price direction by the trend line presented in the form of a zigzag and a counter calculating the number of bars traversed in the direction of the trend and the number of points on the vertical scale. (calculations are carried out by the opening of the bar) The indicator does not redraw. For convenience,
Market Swing Index MSI
Elias Mtwenge
5 (1)
Septermber OFFER 85% OFF next price for unlimited version will be 2500$. This is the only time you can get this institutional and professional indicator at this price for unlimited version. Don't dare to miss this. The tool I am about to introduce to you you can't compare it with other tools due to its strategy and accuracy level in predicting the next price directional movement. This tool is designed for serious traders who have decided to make a difference through trading. Be the next person t
Swing Master Indicator
Elias Mtwenge
5 (1)
Dear Traders this is my another tool called " Swing Master Indicator ". As the name above the indicator is designed to help you in swing trading by capturing the low and highs of the price. You may us this tool with any trading strategy and style from scalping to position trading. It is made for level of traders including newbies and advanced traders even prop-firms, hedge funds and banks to help them make sold market analysis. I create tools for serious traders who want to make a difference in
Introduction to X3 Chart Pattern Scanner X3 Cherart Pattern Scanner is the non-repainting and non-lagging indicator detecting X3 chart patterns including Harmonic pattern, Elliott Wave pattern, X3 patterns, and Japanese Candlestick patterns. Historical patterns match with signal patterns. Hence, you can readily develop the solid trading strategy in your chart. More importantly, this superb pattern scanner can detect the optimal pattern of its kind. In addition, you can switch on and off individu
제작자의 제품 더 보기
Form designer
Maryna Shulzhenko
Form Designer : Advanced Trading Bot for Forex and Cryptocurrency Markets Form Designer represents the latest advancement in automated trading technology designed to perform optimally in both the Forex and Cryptocurrency markets (with supported brokers). This highly effective tool has unique capabilities, making it an indispensable assistant for traders. Key features and benefits: Multi-currency: Form Designer supports a wide range of currency pairs, providing flexibility and versatility in
BoomTroom
Maryna Shulzhenko
The original BoomTroom trend indicator. With this indicator, you do not need to sit near the computer and wait for the inflection point to appear day and night. How important it is to determine the trend in the stock market or the Forex market! Still not sure how to determine the inflection point of a trend? Are you still worried about how to draw short-term and long-term trend lines? Run this smart utility. You will see pivot points of varying strength, as well as long-term and short-term tr
Trend Units
Maryna Shulzhenko
The Forex market can go through many different price paths to reach a point in the future. The future is dynamic. Therefore, planning a trade with a possible future scenario is an essential step for your success. For these purposes, we present to your attention Trend Units. A unique author's strategy that simultaneously determines the strength of trends and points of entry into the market, visualizing it using arrows on the chart. The indicator is optimally adapted for trading on time periods
TrendSys
Maryna Shulzhenko
Trend Sys, an indicator designed to detect trends in price movement and allows you to quickly determine the direction of the trend. The best way to trade Trend Sys is to enter the market when Trend Sys peaks and goes the other way. This is a sign of a trend reversal. I hope you enjoy this indicator and leave your comments to make it even better. Good luck and happy trading.
Trend Moment
Maryna Shulzhenko
Using the Trend Moment indicator, you can find not only overbought and oversold zones, but also be able to identify the strongest reversals of the current trend. This will take your trading to a whole new level. Forget about slipping in oscillators, be it Stochastic or RSI or any other oscillator. Trend Moment signals 100% do not redraw and do not require adjusting the parameters - the indicator will work equally well on any chart, even with default parameters.
Trend Sens
Maryna Shulzhenko
Trend Sens is a universal indicator, the values of which are calculated based on different indicators. The iPump indicator is a versatile indicator that combines the advantages of three categories of indicators. You get 3 indicators in 1 product. Trend Sense itself appeared in the process of many years of work with financial assets. The indicator has become a consequence of those desires and requirements, for the analysis that I personally would like to use for trading.
Trend Lime
Maryna Shulzhenko
With the development of information technologies and a large number of participants, financial markets are less and less amenable to analysis by outdated indicators. Conventional technical analysis tools, such as the Moving Average or Stochastic, in their pure form are not able to determine the direction of the trend or its reversal. Can one indicator indicate the correct direction of the future price, without changing its parameters, in the history of 14 years? At the same time, not to lose ad
Trend Map
Maryna Shulzhenko
The Trend Map indicator is designed to detect trends in price movement and allows you to quickly determine not only the direction of the trend, but also to understand the levels of interaction between buyers and sellers. It has no settings and therefore can be perceived as it signals. It contains only three lines, each of which is designed to unambiguously perceive the present moment. Line # 2 characterizes the global direction of the price movement. If we see that the other two lines are above
Trend LineA
Maryna Shulzhenko
Trend LineA is a powerful trend indicator equipped with everything you need to trade and at the same time very easy to use. The indicator calculates the most probable zones of trend stop / reversal, zones of confident trend movements. The indicator works on all timeframes and currency pairs. The indicator gives quite accurate signals and it is customary to use it both in trend and flat markets. It is advisable to use the indicator in combination with other instruments for more reliable signals
Trrend Arrow
Maryna Shulzhenko
Original Trrend Arrow trend indicator showing buy and sell areas. With this indicator, you do not need to sit near the computer and wait for the inflection point to appear day and night. The indicator is very easy to use. When an up arrow appears, open a buy deal. When a down arrow appears, open a sell trade. The indicator works on all timeframes and currency pairs. It is advisable to use the indicator in combination with other instruments for more reliable signals and making a more balance
Trend Op
Maryna Shulzhenko
One of the biggest challenges traders face is finding the trading system that's right for them. Trend Op indicator predicts the most likely short-term price movement based on complex mathematical calculations. This indicator is designed to detect trends in price movement and allows you to quickly determine not only the direction of the trend, but also to understand the levels of interaction between buyers and sellers. It has no settings and therefore can be perceived as it signals.
Trend Hist
Maryna Shulzhenko
The Trend Hist indicator is designed to display on a chart and visually evaluate the trailing algorithm by inside bars. This indicator finds strong trend movements of a currency pair on a given number of bars, and also finds a correction to this trend. If the trend is strong enough, and the correction becomes equal to the one specified in the parameters, then the indicator signals this.
Trend Slow
Maryna Shulzhenko
The Trend Slow indicator uses the author's algorithm for analyzing price behavior and displays the result of complex work in the form of lines. For simplicity, the algorithm automatically changes the line color according to its direction. The indicator has a parameter to enable alerts when the color changes, thus helping the trader to identify new market trends. This system will help you find high-probability trades in the direction of strong trends.
Effect
Maryna Shulzhenko
The Effect indicator shows the points of potential market reversal. Simple, visual and efficient trend detection. Ready-made trading system. The intelligent algorithm of the indicator determines the trend with good probability. Uses just one parameter for settings. The indicator does not redraw and does not lag. Works on all currency pairs and all timeframes. You should remember that using a combination of forecasting tools, it is advisable to choose 2-3 indicators for trading. Otherwise, the
Going straight
Maryna Shulzhenko
American traders say: “Trend is your friend”, which means “Trend is your friend”. And indeed it is! By trading with the trend, you reduce your risks and gain an advantage, as you increase the mathematical expectation of completed trades and, therefore, earn more profit. Together with the Going straight indicator you will trade with the trend with ease! This is one of the most effective ways to deal with market trends. Trading strategies using the channel indicator belong to the classic method
Schrodinger Channel
Maryna Shulzhenko
Schrodinger Channel is a non-redrawing channel indicator based on moving averages, it takes into account not simple moving averages, but twice smoothed ones, which, on the one hand, makes it possible to more clearly determine the market movement, and on the other hand, makes the indicator less sensitive. Signals are not redrawn and can be used immediately after they appear. This means that there is no need to wait for a new confirming bar. The lower and upper bands are used as support / resista
Direction Arrows
Maryna Shulzhenko
The Direction Arrows indicator tracks the market trend while ignoring the sharp market fluctuations and noise around the average price. The indicator implements a kind of technical analysis based on the idea that the market is cyclical in nature. It catches the trend and shows favorable moments of entering the market with arrows. The indicator can be used both for pipsing on small periods and for long-term trading.
Incognito RSI
Maryna Shulzhenko
The Incognito RSI indicator is an advanced internal strength index. It transforms the signal so that the low-frequency components lag behind much more than the high-frequency components. In general, the data of the last bar has more weight than the previous data, like an exponential moving average. The indicator demonstrates not the relative strength of the compared trading instruments, but the internal strength of a single instrument, therefore it is the “Internal Strength Index”. This is an
Oscillator Trends
Maryna Shulzhenko
The Oscillator Trend indicators are most useful in identifying trend decay. Nobody canceled the divergence. Correct use of this signal will give you a certain head start in the market. When working in flat. The principle of operation of the oscillator is based on the measurement of fluctuations. The indicator tries to determine the maximum or minimum of the next swing - an exit from the overbought and oversold zones. Do not forget that these signals are most interesting at the borders of the fl
Purpose Trend
Maryna Shulzhenko
Purpose Trend - analyzes the current trend gives an excellent understanding of which direction the market is aimed at, at what point it should be expected in the near future. Unfortunately, most of the popular indicators in practice give a huge number of false signals, since they all work without any consideration of global trends. That is why in today's conditions, when the market is far from stable price movement, it is almost impossible to build a strategy without using trend indicators. H
BitTerraCoin
Maryna Shulzhenko
BitTerraCoin is a unique trading system! It goes through the entire history and all currency pairs with one single setting. Works using sharp tick movements. Recommendations for working with a scalpel: It is recommended to work on liquid Forex pairs with a low spread. The lower the commission and the spread, the greater the profit. You can start using it with $ 100 and 0.01 lot. You can work on any hourly period, on any currency pair and on the server of any broker. Details: The MaxSpread p
Make Use
Maryna Shulzhenko
The Make Use trend indicator copes with the main task of trading: to find an entry point to the market at the moment of trend initiation and an exit point at the moment of its completion. A stable movement of quotations in a certain direction is called a trend in trading. In this case, the movement itself can be downward, upward or sideways, when the market movement does not have a pronounced direction. The Make Use trend indicator is important for identifying trends in financial markets. Howev
Trend Thyrogen
Maryna Shulzhenko
Trend Thyrogen is a trend trading strategy, filtering and all the necessary features built into one tool! Intelligent indicator algorithm with generates input signals and output levels. The principle of operation of the indicator is to automatically determine the current state of the market when placed on a chart, analyze historical data based on historical data and display instructions for further actions on the trader's screen. The system itself shows in the form of arrows when to buy and w
Channel Token
Maryna Shulzhenko
The Channel Token indicator automatically builds a trend movement tracking channel. The price is in its trend movement in a certain range, and not a chaotic spread of the price, it is not clear in which direction. And if the price deviates within a certain range, it means that the boundaries of these ranges are support and resistance lines and form the Channel Token channel. Channel Token - an indicator in which the indicator period is automatically calculated based on the number of bars of
Gibraltar
Maryna Shulzhenko
The bot uses 4 MACD indicators and two MAs in its work, thus a zone is formed for trading on the breakdown of the Bands channel and, accordingly, with a minimum stop level and only one deal. The bot also takes into account parameters such as slippage, spread and volatility. Entry is made only when there is sufficient volatility. Thus, the bot works using sharp tick movements. It is recommended to work on liquid Forex pairs with a low spread. The lower the commission and the spread, the greater
Trend Long
Maryna Shulzhenko
The Trend Long indicator accompanies long trends. It can be used only to determine the global trend, but not as an entry point. Any reliable entry indicator can be used for the entry point. Or the standard RSI, based on overbought / oversold levels. The indicator can be used without restrictions on instruments or timeframes. Experiment with the parameters! The parameters are not linear! When you specify a period, you only specify a period to determine the price range for a certain interval. T
Channel Reliable
Maryna Shulzhenko
This is no ordinary channel. Everyone should analyze it and find a way to use it in their trading strategies. Like all channels, it has a middle line as well as a high and low line. This channel is worth watching for its unusual behavior. The use of the Channel Reliable indicator allows the trader to react in time to the price going beyond the boundaries of the channel set for it. This corridor is built on the basis of the analysis of several candles, and changes in the parameter of the number
Pattern Trend
Maryna Shulzhenko
The principle of operation of the Patern Trend indicator is to work on a channel breakout. The parameters and width of the channel are selected in such a way that the closing in the red is sufficiently balanced, which is shown on the chart by the inscriptions near the arrows. You can see that the arrow signal does not appear every time the channel is broken. Because the indicator has a volatility filter that has a big impact on the entry. In total on the chart (EURUSD / H1) you can see that t
Signal Switched
Maryna Shulzhenko
Signal Switched is a channel indicator designed to work with support and resistance levels and help traders find opportunities to enter the market. It is also protected by arrows that help to enter the market correctly. Channel indicators are among the most popular technical analysis tools on Forex and Signal Switched is a promising market analysis tool. Signal Switched can be used as a base for building a strategy or as an addition to an existing one. Signal Switched is a limited range (co
Quatre
Maryna Shulzhenko
Quatre is a trend indicator, it indicates well the points of the beginning of the trend and its completion or reversal. This indicator is characterized by the following behavior: After a trend movement appears on the market, the indicator sends a signal of its beginning in the form of arrows. Quatre is a mathematical averaging of prices, and based on this, one can assume the direction of price movement (trend) in the future. Against the background of insignificant fluctuations, it is possible t
필터:
maroonxy
2245
maroonxy 2021.09.23 20:13 
 

사용자가 평가에 대한 코멘트를 남기지 않았습니다

Maryna Shulzhenko
6675
개발자의 답변 Maryna Shulzhenko 2021.09.24 01:20
good day. The message has just been read. I can answer questions about the operation of the indicator.
리뷰 답변