• 미리보기
  • 리뷰
  • 코멘트

ATR to Baseline MT4

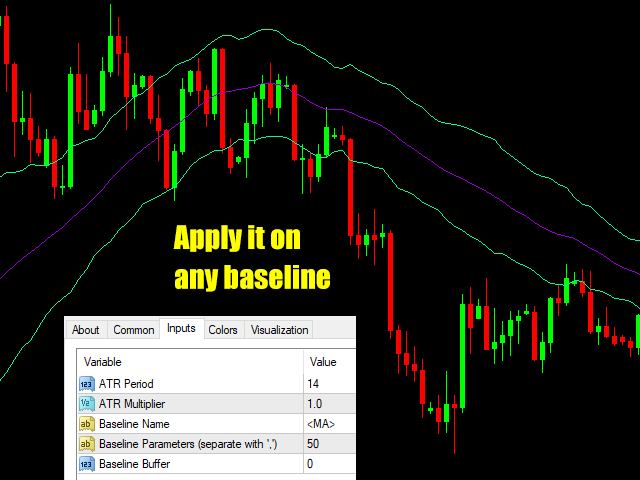
이 표시기는 다른 차트 표시기에 상대적인 채널을 생성합니다:  표시기 + ATR 및 표시기 - ATR . 가격이 기준선보다 너무 많이 올랐는지 알 때 유용합니다. ATR 레벨은 승수로 조정할 수 있습니다.

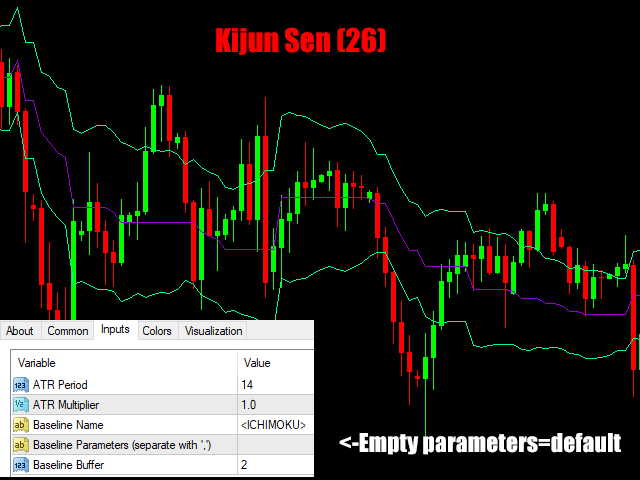
이 버전은 MT4 제한 사항 중 일부를 피하기 위해 MT5 버전보다 더 복잡합니다. 기준선의 이름 , 매개변수 (쉼표로 구분된 문자열) 및 버퍼 를 도입해야 합니다. 기준선이 하나 의 버퍼에만 필요한 모든 값을 가지고 있는지 확인하십시오(또는 둘 이상의 인스턴스를 넣어야 할 수도 있음).

  • 기준선의 문자열 매개변수는 지원되지 않으며 , 어떤 값이 도입되더라도 항상 기본값이 사용됩니다.
  • 열거자의 경우 위치를 사용합니다(대부분의 경우 0부터 시작). 예를 들어 MA 모드의 경우: sma=0; 에마=1; smma=2; lwma=3

이점으로 이 표시기는 원래 기준선도 표시하므로 동일한 표시기에 3개의 선이 모두 표시됩니다. 특별한 이름 태그가 있는 MT4 기본 표시기에 액세스할 수 있습니다. 이 경우 유용한 것은 "<MA>" 및 "<ICHIMOKU>"(kijun-sen용)입니다. 더 많은 것을 사용할 수 있지만 차트에서는 별로 의미가 없습니다(아마도 볼린저 밴드에서 무언가를 얻을 수도 있습니다: <BB>).


MT5용 버전도 있습니다.

추천 제품
RJT Salamander for MT4
Rafael Jimenez Tocino
RJT SALAMANDER, the indicator as in a video game VERSION 2 Pilot your PRICE spaceship inside the cavern and avoid the collision against the stalactites (green) and stalagmites (red), dodging these obstacles to win. When these objects are forming (or disappearing) then you must make the decision how to move your ship (just like in a video game) Depending on the market and the size of the candles/bars you can adjust the calculation of stalactites and stalagmites (based on the last bars) in the
FREE
Stochastic Rsi Style
Javier Morales Fernandez
스타일이 중요하기 때문에 촛불의 색상, 배경을 밝거나 어둡게 변경하고 격자를 넣거나 제거하기 위해 매번 속성을 클릭하는 것이 얼마나 성가신 일인지 압니다. 클릭 한 번으로 해결하는 방법은 다음과 같습니다. 차트에서 그리드를 표시하거나 숨기는 버튼 1개. 트레이더가 원하는 캔들 스타일을 선택할 수 있는 3개의 맞춤형 버튼. 주간 모드와 야간 모드 사이를 전환하는 버튼 1개. *****설정에서 화면에서 버튼을 표시할 위치를 선택할 수 있습니다.*** 내 다른 제품을 확인하는 것을 고려하십시오 https://www.mql5.com/en/users/javimorales.fer/seller 스토캐스틱 RSI란 무엇입니까? 스토캐스틱 RSI(StochRSI)는 0과 1(또는 일부 차트 플랫폼의 경우 0과 100) 범위의 기술적 분석에 사용되는 지표이며 스토캐스틱 오실레이터 공식을 상대 강도 지수(RSI) 값 세트에 적용하여 생성됩니다. 표준 가격 데이터보다 작가 트레이딩 알고리즘의 창시자 하비
FREE
Two Lines Color
Cristobal Hidalgo Soriano
Nombre del Indicador: Two Lines Color 1 Telegran:13 Crow Trading Club Descripción: Este indicador personalizado para MetaTrader 4, "Two Lines Color 1", es una herramienta de análisis técnico diseñada para ayudarte a identificar oportunidades de trading en los mercados financieros. Este indicador utiliza dos Medias Móviles Simples (SMA) de diferentes períodos y las representa en el gráfico con dos líneas de colores distintos. Las características clave de este indicador son las siguientes: Rá
FREE
MACD in MA
Nikolaos Pantzos
iMACD in iMA is indicator to change color in iMA if iMACD is upper of zero (up trend) or lower of zero (down trend). It is a useful tool to track when the upside and the downside iMACD on iMA. You can to get source code from here . Parameters MA_Periods — Period for iMA. MA_Method — Method for iMA. MACD_FastEMA — Fast EMA for MACD. MACD_SlowEMA — Slow EMA for MACD. MACD_SignalSMA — SMA signal for MACD. MACD_ApliedPrice — Price used for MACD. BarsCount — How many bars will show the line. Revers
FREE
Basic Theme Builder
Mehran Sepah Mansoor
5 (1)
Basic Theme Builder: 차트 맞춤화를 간편하게 Basic Theme Builder   지표로 거래 경험을 혁신하세요. 이 다용도 도구는 MetaTrader 4 에서 차트의 외관을 간편하게 사용자 맞춤화할 수 있도록 설계된 직관적인 패널을 제공합니다. 다양한 테마와 색상 스킴을 간단히 전환하여 거래 환경의 시각적 매력과 기능성을 향상시킬 수 있습니다.   Free MT5 version Basic Theme Builder   지표는 MetaTrader 4 차트를 손쉽게 개인화하려는 거래자에게 최적의 도구입니다. 간단한 패널 인터페이스와 다양한 테마 프리셋을 통해 거래 스타일이나 기분에 맞게 차트의 외관을 빠르게 조정할 수 있습니다. 클래식한 룩부터 현대적인 미학까지, Basic Theme Builder는 시각적 경험을 향상시키고 집중력을 높이는 데 도움이 되는 다양한 옵션을 제공합니다. 오늘 이 실용적이고 사용하기 쉬운 지표로 거래 환경을 최적화하세요. 주요 기능: 간편
FREE
Signals and Alerts for Accelerator/Decelerator indicator based on these MQL5 posts: Accelerator Oscillator and Signals of the Indicator Accelerator Oscillator . Note : this tool is based on the code of Accelerator indicator developed by MetaQuotes Software Corp. Features The signals are triggered at   closing   of last bar/opening of a new bar; Any kind of alerts can be enabled: Dialog Box, Email message, SMS notifications for smartphones and tablets, and Sound alerts; Customizable arrows. By d
FREE
Ind4 InfoPad Information Panel
Vladislav Andruschenko
4.71 (7)
INFOPad는 MetaTrader 4 터미널에서 선택한 통화 쌍에 대한 정보를 생성하는 정보 패널입니다. 이 표시기에는 5가지 기능이 있습니다. 선택한 기호에 대한 주요 및 주요 정보를 표시합니다. 매도호가 매수, 스프레드, 스탑 레벨, 스왑, 틱 값, 수수료 가격; SL 목표와 TP 목표의 미래 목표를 보여줍니다(설정된 손절매와 이익실현의 포인트 수, 달러 금액). 그것은 기간 동안 받은 이익을 보여줍니다: 오늘, 주, 월, 연도, 선택한 통화에 대한 총 이익; 현재 오픈 포지션, 로트(볼륨), 포지션 수, 포지션 이익(포인트, 달러, 퍼센트)을 보여줍니다. 미결 거래에 대한 차트에 대한 추가 정보를 표시합니다. 그것은 손절매 및 이익 수준 및 이러한 정지 수준의 목표를 보여줍니다. 심볼에서 트랜잭션이 열리거나 트랜잭션이 닫히거나 트랜잭션이 수정될 때 로그 파일에 정보를 기록합니다. 거래를 열 때, 거래를 닫을 때, 거래를 수정할 때 사운드 파일을 재생합니다. 거래 개시, 거래
FREE
Rsi Style
Javier Morales Fernandez
스타일이 중요하기 때문에 매번 속성을 클릭하여 초의 색상을 변경하고, 배경을 밝거나 어둡게 만들고, 격자를 삽입하거나 제거하는 것이 얼마나 성가신 일인지 압니다. 클릭 한 번으로 해결하는 방법은 다음과 같습니다. 트레이더가 원하는 캔들 스타일을 선택할 수 있는 3개의 맞춤형 버튼. 낮과 밤 모드 사이를 전환하는 버튼입니다. 차트에서 그리드를 표시하거나 숨기는 버튼입니다. *****설정에서 화면에서 버튼을 표시할 위치를 선택할 수 있습니다.**** 내 다른 제품도 확인하십시오 https://www.mql5.com/en/users/javimorales.fer/seller MT5 버전 확인: https://www.mql5.com/en/market/product/69070 RSI 지표는 무엇입니까? RSI는 0에서 100까지 측정할 수 있는 오실레이터로 표시됩니다. 이 지표는 J. Welles Wilder Jr.가 개발했으며 1978년 그의 저서 New Concepts in Technica
FREE
The Analytical cover trend indicator is a revolutionary trend trading and filtering solution with all the important features of a trend tool built into one tool! The Analytical cover indicator is good for any trader, suitable for any trader for both forex and binary options. You don’t need to configure anything, everything is perfected by time and experience, it works great during a flat and in a trend. The Analytical cover trend indicator is a tool for technical analysis of financial markets
Golden Hunter MT4
Rodrigo Arana Garcia
4.86 (7)
MT5 버전 Golden Hunter 는 수동으로 시장을 거래하는 트레이더를 위해 개발되었습니다. 3가지 지표로 구성된 매우 강력한 도구입니다. 강력한 진입 전략: 통화 쌍의 변동성을 측정하고 시장 추세를 식별하는 지표로 구성됩니다. LSMA: 가격 데이터를 평활화하고 단기 추세 파악에 유용합니다. Heikin Ashi: 지표가 차트에 연결되면 일본 캔들은 Heikin Ashi 캔들로 변경됩니다. 이러한 유형의 양초는 가격 정보를 부드럽게 하여 강력한 추세를 파악할 수 있도록 합니다. 형질 다시 칠하지 마십시오 이 표시기는 새 데이터가 도착해도 값을 변경하지 않습니다 스프레드가 매우 낮고 변동성이 큰 거래 쌍(EURUSD, GBPUSD, BTCUSD…). 범위(범위) 쌍을 사용하는 것은 권장되지 않습니다 기간 M5 거래 시간 시장에서 더 많은 움직임이 있고 스프레드가 낮은 시간대에 거래하는 것이 좋습니다   요구 사항 스프레드가 좁은 ECN 브로커를 사용하여 포지
FREE
The indicator detects and displays М. Gartley's Butterfly pattern. The pattern is plotted by the extreme values of the ZigZag indicator (included in the resources, no need to install). After detecting the pattern, the indicator notifies of that by the pop-up window, a mobile notification and an email. The pattern and wave parameters are displayed on the screenshots. The default parameters are used for demonstration purposes only in order to increase the amount of detected patterns. Parameters z
Pivot Mean Oscillator
Marco Calabrese
4 (1)
Pivot Mean Oscillator (PMO) is a unbounded zero-centered oscillator that provides a quick and normalized measure of divergence between two spreads. Detailed description of the mathematical formulation along with some comments and experiments can be found in this article .  Trading aspects This version of PMO is tuned on spreads relative to Close and Open price signals against their cumulative moving average (CMA). Positive PMO(m,n) values means that last (normalized) m Close prices are higher t
FREE
Introduction This indicator detects volume spread patterns for buy and sell opportunity. The patterns include demand and supply patterns. You might use each pattern for trading. However, these patterns are best used to detect the demand zone (=accumulation area) and supply zone (=distribution area). Demand pattern indicates generally potential buying opportunity. Supply pattern indicates generally potential selling opportunity. These are the underlying patterns rather than direct price action. T
FREE
Wise Men Indicator demo
Bohdan Kasyanenko
3 (2)
The indicator displays signals according to the strategy of Bill Williams on the chart. Demo version of the indicator has the same features as the paid, except that it can work only on a demo account . Signal "First Wise Man" is formed when there is a divergent bar with angulation.  Bullish divergent bar - with lower minimum and closing price in the upper half. Bearish divergent bar - higher maximum and the closing price at the bottom half. Angulation is formed when all three lines of Alligator
FREE
MerkaStudent is a basic version of an expert advisor that allows us to understand part of the behavior of a chart in historical time. It uses some basic parameters in trading, which allows us to understand mathematically how a chart moves and thus know what is our mathematical expectation in the historical period analyzed. Starting from a mathematical logic, we can create a strategy to evaluate its results.
FREE
New Bar Alarm Free
Tomoyuki Nakazima
This indicator alerts you when/before new 1 or 5 minute bar candle formed. In other words,this indicator alerts you every 1/5 minutes. This indicator is especially useful for traders who trade when new bars formed. *This indicator don't work propery in strategy tester.Use this in live trading to check functionality. There is more powerful Pro version .In Pro version,you can choose more timeframe and so on. Input Parameters Alert_Or_Sound =Sound ----- Choose alert or sound or both to notify y
FREE
WPR Breakout SW
Mohamed Hassan Mohamed Hassan Alsherbiny
When prices breakout resistance levels are combined with Larry Williams' Percent Range oscillator "WPR" breaks out its historical resistance levels then higher chances emerges to record farther prices. It's strongly encouraged to confirm price breakout with oscillator breakout since they have comparable effects to price breaking support and resistance levels; certainly short trades will have the same perception. Concept is based on find swing levels which based on number of bars by each side to
FREE
The indicator analyzes the change in the minimum and maximum prices of the previous bars fixing the entrance of the big players. If the change (delta) increases, a signal is displayed on the graph in the form of an arrow. At the same time, virtual trade on history is carried out. In the free version, virtual trade is performed without refills in case of a repeat of the signal. The results of virtual trading in the form of losses / losses, profitability, drawdown and transaction lines are display
FREE
Geo Info
Georgij Komarov
5 (3)
Geo_Info is one of the most informative indicators displaying net levels as well as basic data on a symbol and trading positions in a space-saving manner. displays brief data on the basic symbol parameters in the upper left corner of the chart: Swap for Buy order, swap for Sell order, current spread, margin, tick size, stop level, order freeze level . The data is shown for one lot in points. The data is displayed as follows: SWAP B:4.200 /S:-8.470 /SPR:342 /MRG:256.0/TCV:0.10/STL:0/FRL The data
FREE
Stochastic Arrow
Anton Iudakov
4.5 (4)
The indicator has combined 5 popular strategies. Draws an arrow after confirming a signal for the selected strategy. There are signal alerts. Doesn't redraw its values. I recommend watching my advisor -   Night Zen EA 5 strategies. The main line crosses the signal line. The main line crosses the signal line in the oversold (for buy) / overbought (for sell) zones. The main line enters the oversold (for sell) / overbought (for buy) zones . The main line comes out of the oversold (for buy ) / over
FREE
The XR Gartley Pattern MT4 is an indicator which displays and alerts Gartley pattern detected on the candlestick chart. It also displays potential trade with calculated Take Profit and Stop Loss, Timeframe H1. After purchasing XR Gartley Pattern, you can immediately download this indicator from the MT4-MT5 Market and start using it because all features are set to default, is not necessary to change any parameter. In addition, we have created a  private group  for customers who have purchased one
FREE
MACalcAuto MT4
Tatiana Savkevych
As you know, the main invariable indicator of all traders is the moving average; it is used in some way in most strategies. It is also obvious that this indicator is capable of showing good entries in every local area. For which it usually needs to be optimized or just visually adjusted. This development is intended for automatic optimization of the indicator. Once placed on the chart, the indicator will automatically re-optimize itself with the specified period ( PeriodReOptimization ) and dis
A ratio between 0 and 1 with the higher values representing a more efficient or trending market,  It is used in the calculation of Perry J. Kaufman Adaptive Moving Average (KAMA), dividing the price change over a period by the absolute sum of the price movements that occurred to achieve that change. The Fractal Efficiency or also known as Efficiency Ratio was first published by Perry J. Kaufman in his book ‘Smarter Trading‘. This is mostly considered a filter for volatile markets none the less
FREE
Screener Breakout Congestion
CARLO FINANCIAL SOFTWARE TECHNOLOGY LLC
5 (1)
Screener Breakout Congestion: Have you ever missed a trading opportunity because you were not looking at the chart of that market in that specific time frame? Here is this screener to help you identify congestion breakouts in the markets you want to follow in the different time frames required. Once you have identified the markets (forex, indices, CDF) and the different time frames (1M, 5M, 15M, 30M, 1H, 4H, Daily), the screener is represented by several buttons that change colour when the conge
FREE
Strength Scalper Pro
Jose Ramon Miranda Ramos
3 (1)
PLEASE TAKE NOTICE: This indicator is in current development. final version will be free. This is a simple indicator that uses 3 timeframes in its formula to create Possible buy and sell signals. This indicator is optimized for the M1 timeframe Only. It has 2 types of Alerts: Push Notifications Audio Alerts UPDATES: 3/19/24: Still testing the final code Troubleshooting: When loading the indicator, if you don't see the arrows on the current chart that means that MT4 has not loaded all the high
FREE
Toby Strategy Indicator
Ahmd Sbhy Mhmd Ahmd ʿYshh
The indicator rely on The Toby strategy >> The mother candle which is bigger in range than the previous six candles. A vertical line shows the last Toby Candle with the targets shown up and down. The strategy is about the closing price out of the range of the toby candle to reach the 3 targets..The most probable to be hit is target1 so ensure reserving your profits and managing your stop lose.
FREE
Ota A2 MT4
Sander Maehle Andresen
OTA A2 - 고급 터미널 최적화 도구 중요한 시장 순간에 트레이딩 터미널이 느려지는 이유가 궁금하셨나요? OTA A2는 이러한 일반적인 문제에 대한 해답이며, 트레이딩 터미널 최적화의 혁신적인 진보를 보여줍니다. 왜 OTA A2인가? 오늘날의 시장 거래는 최고의 성능을 요구합니다. 여러 전략을 동시에 실행하거나, 집중적인 백테스트를 수행하거나, 수많은 차트를 관리할 때도 모든 밀리초가 중요합니다. OTA A2는 압박 상황에서도 일관된 성능을 유지할 수 있는 솔루션이 필요한 전문 트레이더들의 실제 요구에서 탄생했습니다. 핵심 기능 동적 메모리 회수 - 거래 요구에 맞춰 조정되는 지능형 리소스 관리 캐시 시스템 최적화 - 데이터 접근 속도를 향상시키는 고급 캐싱 알고리즘 작업 세트 관리 - 최적의 성능 수준을 유지하는 정교한 메모리 할당 터미널 리소스 강화 - 최고 거래 조건을 위한 종합적인 시스템 최적화 기술 혁신 OTA A2는 직접적인 시스템 통합을 통해 최첨단 최적화 기술을 활
FREE
TrendPlus
Sivakumar Subbaiya
4.07 (14)
Trend Plus   Trendplus  Indicator   Time Frame: Suitable for any time frame.  Purpose: Trend Prediction. Blue and red candle indicate the buy and sell call respectively. Buy: When the blue candle is formed buy call is initiated. close the buy trades when the next red candle will formed.   Sell: When the Red candle is formed Sell call is initiated. close the Sell trades when the next blue candle will formed.   Happy trade!!
FREE
ZigZag Support Resistance MT4
Emmanuel Tshepang Mosweu
4.5 (2)
This indicator uses the Zigzag indicator to identify swing highs and swing lows in the price chart.    Once it has identified the swing highs and swing lows, it can use them to determine potential support and resistance levels. A support level is formed when the price drops and bounces back up from a swing low, indicating that there is buying pressure at that level. A resistance level is formed when the price rises and reverses downward from a swing high, suggesting selling pressure at that leve
FREE
Zig Zag 123
Stephen Reynolds
Zig Zag 123 tells us when a reversal or continuation is more likely by looking at the shift in supply and demand. When this happens a signature pattern appears known as 123 (also known ABC) will often break out in direction of higher low or lower high. Stop loss and take profit levels have been added. There is a panel that shows the overall performance of your trades for if you was to use these stop loss and take profit levels.  We get alerted if a pattern 123 appears and also if the price re
FREE
이 제품의 구매자들이 또한 구매함
Gann Made Easy
Oleg Rodin
4.81 (118)
Gann Made Easy 는 mr.의 이론을 사용하여 최고의 거래 원칙을 기반으로 하는 전문적이고 사용하기 쉬운 Forex 거래 시스템입니다. W.D. 간. 이 표시기는 Stop Loss 및 Take Profit Levels를 포함하여 정확한 BUY 및 SELL 신호를 제공합니다. PUSH 알림을 사용하여 이동 중에도 거래할 수 있습니다. 구매 후 연락주세요! 내 거래 팁과 훌륭한 보너스 지표를 무료로 공유하겠습니다! 아마도 Gann 거래 방법에 대해 이미 여러 번 들었을 것입니다. 일반적으로 Gann의 이론은 초보자 거래자뿐만 아니라 이미 거래 경험이 있는 사람들에게도 매우 복잡한 것입니다. Gann의 거래 방식은 이론적으로 적용하기 쉽지 않기 때문입니다. 나는 그 지식을 연마하고 Forex 지표에 최고의 원칙을 적용하기 위해 몇 년을 보냈습니다. 표시기는 적용하기가 매우 쉽습니다. 차트에 첨부하고 간단한 거래 권장 사항을 따르기만 하면 됩니다. 지표는 지속적으로 시장 분석 작업
Cycle Maestro
Stefano Frisetti
NOTE: CYCLEMAESTRO is distributed only on this website, there are no other distributors. Demo version is for reference only and is not supported. Full versione is perfectly functional and it is supported CYCLEMAESTRO , the first and only indicator of Cyclic Analysis, useful for giving signals of TRADING, BUY, SELL, STOP LOSS, ADDING. Created on the logic of Serghei Istrati and programmed by Stefano Frisetti ; CYCLEMAESTRO is not an indicator like the others, the challenge was to interpret only t
현재 20% 할인 ! 초보자 또는 전문가 트레이더를 위한 최고의 솔루션! 이 대시보드 소프트웨어는 28개의 통화 쌍에서 작동합니다. 2가지 주요 지표(Advanced Currency Strength 28 및 Advanced Currency Impulse)를 기반으로 합니다. 전체 Forex 시장에 대한 훌륭한 개요를 제공합니다. 고급 통화 강도 값, 통화 이동 속도 및 모든(9) 시간대의 28 Forex 쌍에 대한 신호를 보여줍니다. 추세 및/또는 스캘핑 기회를 정확히 파악하기 위해 차트의 단일 지표를 사용하여 전체 시장을 볼 수 있을 때 거래가 어떻게 개선될지 상상해 보십시오! 잠재적인 거래를 식별하고 확인하면서 강력한 통화와 약한 통화를 더욱 쉽게 식별할 수 있도록 이 지표에 기능을 내장했습니다. 이 표시기는 통화의 강세 또는 약세가 증가 또는 감소하는지 여부와 모든 시간대에서 수행되는 방식을 그래픽으로 보여줍니다. 추가된 새로운 기능은 현재 시장 조건 변화에 적응하는
Scalper Inside PRO
Alexey Minkov
4.76 (63)
!SPECIAL SALE! An exclusive indicator that utilizes an innovative algorithm to swiftly and accurately determine the market trend. The indicator automatically calculates opening, closing, and profit levels, providing detailed trading statistics. With these features, you can choose the most appropriate trading instrument for the current market conditions. Additionally, you can easily integrate your own arrow indicators into Scalper Inside Pro to quickly evaluate their statistics and profitability
Gold Stuff
Vasiliy Strukov
4.86 (257)
Gold Stuff는 금을 위해 특별히 설계된 추세 지표이며 모든 금융 상품에서도 사용할 수 있습니다. 표시기가 다시 그려지지 않고 지연되지 않습니다. 권장 기간 H1. 표시기에서 완전 자동 Expert Advisor EA Gold Stuff를 작동합니다. 내 프로필에서 찾을 수 있습니다. 설정 및 개인 보너스를 받으려면 구매 후 즉시 저에게 연락하십시오!   강력한 지원 및 트렌드 스캐너 표시기의 무료 사본을 받으실 수 있습니다. 메시지를 보내주세요. 나!   설정 화살표 그리기 - 켜기 끄기. 차트에 화살표 그리기. 경고 - 가청 경고를 끕니다. 이메일 알림 - 켜기 끄기. 이메일 알림. Puch-notification - 켜기 끄기. 푸시 알림. 다음으로 색 영역을 조정합니다. Gold Stuff는 금을 위해 특별히 설계된 추세 지표이며 모든 금융 상품에서도 사용할 수 있습니다. 표시기가 다시 그려지지 않고 지연되지 않습니다. 권장 기간 H1. 표시기에서 완전 자동
Algo Pumping MT4
Ihor Otkydach
5 (6)
PUMPING STATION – 당신만을 위한 올인원(All-in-One) 전략 PUMPING STATION은 당신의 외환 거래를 더욱 흥미롭고 효과적으로 바꿔줄 혁신적인 인디케이터입니다. 단순한 보조 도구가 아니라, 강력한 알고리즘을 갖춘 완전한 거래 시스템으로서 보다 안정적인 트레이딩을 시작할 수 있도록 도와줍니다. 이 제품을 구매하시면 다음의 혜택을   무료로   받으실 수 있습니다: 전용 설정 파일: 자동 설정으로 최대의 퍼포먼스를 제공합니다. 단계별 동영상 가이드: PUMPING STATION 전략으로 거래하는 법을 배워보세요. Pumping Utility: PUMPING STATION과 함께 사용하도록 설계된 반자동 거래 봇으로, 거래를 더욱 쉽고 편리하게 만들어줍니다. ※ 구매 후 바로 저에게 메시지를 보내주세요. 추가 자료에 대한 접근 권한을 제공해드립니다. PUMPING STATION은 어떻게 작동하나요? 트렌드 컨트롤: 시장의 추세 방향을 즉시 파악합니다. 추세는
Golden Trend Indicator
Noha Mohamed Fathy Younes Badr
5 (10)
Golden Trend indicator  is The best indicator for predicting trend movement this indicator never lags and never repaints and never back paints    and give  arrow buy and sell    before the candle appear  and it will help you and  will make your trading decisions clearer its work on all currencies and  gold and crypto and all time frame This unique  indicator uses very secret algorithms to catch the  trends, so you can trade using this indicator and see the trend clear on charts  manual guide and
M1 Arrow
Oleg Rodin
5 (17)
시장의 두 가지 기본 원칙에 기반한 일중 전략. 알고리즘은 추가 필터를 사용하여 거래량 및 가격 파동 분석을 기반으로 합니다. 지표의 지능형 알고리즘은 두 가지 시장 요인이 하나로 결합될 때만 신호를 제공합니다. 지표는 더 높은 시간 프레임의 데이터를 사용하여 M1 차트에서 특정 범위의 파도를 계산합니다. 그리고 파동을 확인하기 위해 지표는 볼륨 분석을 사용합니다. 이 표시기는 준비된 거래 시스템입니다. 트레이더가 필요로 하는 모든 것은 신호를 따르는 것입니다. 또한 지표는 자신의 거래 시스템의 기초가 될 수 있습니다. 거래는 분 차트에서만 수행됩니다. 지표가 MTF 원리를 사용한다는 사실에도 불구하고 지표 알고리즘은 가능한 한 안정적입니다. 구매 후 반드시 저에게 편지를 보내주세요! 내 거래 설정 및 권장 사항을 공유하겠습니다!
Trend Screener
STE S.S.COMPANY
4.78 (93)
트렌드 표시기, 트렌드 트레이딩 및 필터링을 위한 획기적인 고유 솔루션, 하나의 도구 안에 내장된 모든 중요한 트렌드 기능! Forex, 상품, 암호 화폐, 지수 및 주식과 같은 모든 기호/도구에 사용할 수 있는 100% 다시 칠하지 않는 다중 시간 프레임 및 다중 통화 표시기입니다. 기간 한정 특가: 지원 및 저항 스크리너 지표는 단 100달러에 평생 제공됩니다. (원래 가격 50 달러) (제안 연장) Trend Screener는 차트에 점이 있는 화살표 추세 신호를 제공하는 효율적인 지표 추세 추종 지표입니다. 추세 분석기 표시기에서 사용할 수 있는 기능: 1. 트렌드 스캐너. 2. 최대 이익 분석이 있는 추세선. 3. 추세 통화 강도 측정기. 4. 경고가 있는 추세 반전 점. 5. 경고가 있는 강력한 추세 점. 6. 추세 화살표 Trend Screener Indicator가 있는 일일 분석 예, 일일 신호 성능...등은 여기에서 찾을 수 있습니다.   여기를 클릭하십시오. L
GOLD Impulse with Alert
Bernhard Schweigert
4.6 (10)
이 지표는 Advanced Currency IMPULSE with ALERT  +   Currency Strength Exotics  의 2가지 제품의 슈퍼 조합입니다. 그것은 모든 시간 프레임에 대해 작동하며 8개의 주요 통화와 하나의 기호에 대한 강약의 충동을 그래픽으로 보여줍니다! 이 표시기는 금, 이국적인 쌍, 상품, 지수 또는 선물과 같은 기호에 대한 통화 강도 가속을 표시하는 데 특화되어 있습니다. 금, 은, 오일, DAX, US30, MXN, TRY, CNH 등의 진정한 통화 강도 가속(충동 또는 속도)을 표시하기 위해 9번째 줄에 모든 기호를 추가할 수 있습니다. 새로운 기본 알고리즘을 기반으로 구축되어 잠재적인 거래를 훨씬 더 쉽게 식별하고 확인할 수 있습니다. 이는 통화의 강세 또는 약세가 가속되는지 여부를 그래픽으로 표시하고 가속 속도를 측정하기 때문입니다. 자동차의 속도계처럼 생각하면 됩니다. 가속화할 때 Forex 시장에서 동일한 일이 분명히 더 빠르
Enigmera
Ivan Stefanov
5 (7)
ENIGMERA: 시장의 핵심 중요: MQL5.com의 데모는 Strategy Tester에서 실행되며 Enigmera의 기능을 완전히 반영하지 못할 수 있습니다. 설명, 스크린샷 및 비디오를 확인하여 자세한 내용을 확인하십시오. 질문이 있으면 언제든지 메시지를 보내주세요! 인디케이터의 코드는 완전히 다시 작성되었습니다. 버전 3.0은 새로운 기능을 추가하고 인디케이터가 처음 출시된 이후 누적된 버그를 수정했습니다. 소개 이 인디케이터 및 거래 시스템은 금융 시장에 대한 주목할 만한 접근 방식입니다. ENIGMERA는 프랙탈 주기를 사용하여 정확하게 지원 및 저항 수준을 계산합니다. 실제 축적 단계를 보여주고 방향과 목표를 제공합니다. 트렌드와 수정 모두에서 작동하는 시스템입니다. 작동 방식 인디케이터의 대부분의 기능은 차트 왼쪽에 있는 버튼을 통해 제어되며, 이를 통해 다양한 시장 상황에 빠르게 대응할 수 있습니다. 버튼 ON/OFF – 인디케이터 전체를 표시하거나 숨깁니다.
PZ Harmonacci Patterns
PZ TRADING SLU
3.17 (6)
Trade smarter, not harder: Empower your trading with Harmonacci Patterns This is arguably the most complete harmonic price formation auto-recognition indicator you can find for the MetaTrader Platform. It detects 19 different patterns, takes fibonacci projections as seriously as you do, displays the Potential Reversal Zone (PRZ) and finds suitable stop-loss and take-profit levels. [ Installation Guide | Update Guide | Troubleshooting | FAQ | All Products ] It detects 19 different harmonic pric
TPSproTREND PrO
Roman Podpora
4.68 (25)
VERSION MT5        —        ИНСТРУКЦИЯ RUS           —        INSTRUCTIONS  ENG 주요 기능: 렌더링 없이 정확한 입력 신호! 신호가 나타나면 관련성은 유지됩니다! 이는 신호를 제공한 후 변경하여 예금 자금 손실을 초래할 수 있는 다시 그리기 지표와의 중요한 차이점입니다. 이제 더 큰 확률과 정확도로 시장에 진입할 수 있습니다. 화살표가 나타난 후 목표에 도달(이익실현)하거나 반전 신호가 나타날 때까지 캔들을 색칠하는 기능도 있습니다. STOP LOSS / TAKE PROFIT 구역 표시 진입점 검색 시 시각적 명확성을 높이기 위해 시장 진입을 위한 최적 지점이 검색되는 BUY/SELL 영역을 초기에 표시하는 모듈을 만들었습니다. 정지 손실 수준 작업을 위한 추가 지능형 논리는 시간이 지남에 따라 크기를 줄이는 데 도움이 되므로 거래에 들어갈 때 초기 위험을 줄이는 데 도움이 됩니다(move sl). 더 높은 기간의 MI
Easy Breakout
Mohamed Hassan
5 (11)
After your purchase, feel free to contact me for more details on how to receive a bonus indicator called VFI, which pairs perfectly with Easy Breakout for enhanced confluence!   Easy Breakout is a powerful price action trading system built on one of the most popular and widely trusted strategies among traders: the Breakout strategy ! This indicator delivers crystal-clear Buy and Sell signals based on breakouts from key support and resistance zones. Unlike typical breakout indicators, it levera
Dynamic Forex28 Navigator
Bernhard Schweigert
5 (5)
Dynamic Forex28 Navigator - 차세대 외환 거래 도구. 현재 49% 할인. Dynamic Forex28 Navigator는 오랫동안 인기 있는 지표의 진화형으로, 세 가지의 힘을 하나로 결합했습니다. 고급 통화 Strength28 지표(695개 리뷰) + 고급 통화 IMPULSE with ALERT(520개 리뷰) + CS28 콤보 신호(보너스). 지표에 대한 자세한 정보 https://www.mql5.com/en/blogs/post/758844 차세대 Strength 지표는 무엇을 제공합니까?  원래 지표에서 좋아했던 모든 것이 새로운 기능과 더 높은 정확도로 강화되었습니다. 주요 기능: 독점적인 통화 Strength 공식.  모든 시간대에 걸쳐 부드럽고 정확한 강도선. 추세와 정확한 진입을 식별하는 데 이상적입니다. 역동적인 시장 피보나치 수준(시장 피보나치).  이 지표에만 있는 고유한 기능. 가격 차트가 아닌 통화 강도에 피보나치가 적용됩니다.
IX Power MT4
Daniel Stein
4.78 (9)
IX Power: 지수, 원자재, 암호화폐 및 외환 시장 통찰력을 발견하세요 개요 IX Power 는 지수, 원자재, 암호화폐 및 외환 시장의 강도를 분석할 수 있는 다목적 도구입니다. FX Power 는 모든 가용 통화 쌍 데이터를 사용하여 외환 쌍에 대해 가장 높은 정확도를 제공하는 반면, IX Power 는 기초 자산 시장 데이터에만 초점을 맞춥니다. 이로 인해 IX Power 는 비외환 시장에 이상적이며, 다중 쌍 분석이 필요하지 않은 간단한 외환 분석에도 신뢰할 수 있는 도구입니다. 모든 차트에서 매끄럽게 작동하며, 거래 결정을 향상시키기 위한 명확하고 실행 가능한 통찰력을 제공합니다. 1. IX Power가 트레이더에게 유용한 이유 다양한 시장 강도 분석 • IX Power 는 지수, 원자재, 암호화폐 및 외환 심볼의 강도를 계산하여 각 시장에 맞는 통찰력을 제공합니다. • US30, WTI, 금, 비트코인 또는 통화 쌍과 같은 자산을 모니터링하여 거래 기회를 발견
Stratos Pali
Michela Russo
5 (2)
Stratos Pali Indicator   is a revolutionary tool designed to enhance your trading strategy by accurately identifying market trends. This sophisticated indicator uses a unique algorithm to generate a complete histogram, which records when the trend is Long or Short. When a trend reversal occurs, an arrow appears, indicating the new direction of the trend. Important Information Revealed Leave a review and contact me via mql5 message to receive My Top 5 set files for Stratos Pali at no cost! Dow
Scalper Vault
Oleg Rodin
5 (29)
Scalper Vault 는 성공적인 스캘핑에 필요한 모든 것을 제공하는 전문 스캘핑 시스템입니다. 이 표시기는 외환 및 바이너리 옵션 거래자가 사용할 수 있는 완전한 거래 시스템입니다. 권장 시간 프레임은 M5입니다. 시스템은 추세 방향으로 정확한 화살표 신호를 제공합니다. 또한 상단 및 하단 신호와 Gann 시장 수준을 제공합니다.  이 시스템은 사용하기가 매우 쉽습니다. 원하는 시장 지역의 화살표만 따라가면 됩니다. 엑시트는 가격이 적정 수준에 도달하거나 시장의 고점 또는 저점 신호가 나타날 때 수행됩니다.  표시기는 PUSH 알림을 포함한 모든 유형의 경고를 제공합니다. 인디케이터 구매 후 연락주세요. 내 개인 거래 권장 사항과 훌륭한 보너스 지표를 무료로 공유합니다! 나는 당신에게 행복하고 유익한 거래를 기원합니다!
Black dragon indicator
Ramil Minniakhmetov
4.86 (119)
추세 감지 표시기는 모든 전략을 보완하며 독립적인 도구로도 사용할 수 있습니다. 표시기 작업에 대한 권장 사항은 댓글 #8 에서 다운로드할 수 있습니다. 장점 사용하기 쉽고 불필요한 정보로 차트에 과부하가 걸리지 않습니다. 모든 전략에 대한 필터로 사용할 수 있습니다. 기본 제공 수준의 동적 지원 및 저항이 있어 이익을 얻고 손절매를 설정하는 데 모두 사용할 수 있습니다. 촛대가 닫힌 후에도 표시기는 색상을 변경하지 않습니다.  주식 시장, 지수, 석유, 금 및 모든 시간대에서 작동합니다. 토스트 알림, 이메일 알림, 푸시 알림 및 소리 알림 기능이 있습니다. 내 다른 개발은 여기에서 찾을 수 있습니다: https://www.mql5.com/ko/users/mechanic/seller 입력 매개변수 Alert - 켜기/끄기. 알리다; Push Notification - 켜기/끄기. 푸시 알림; Mail - 켜기/끄기 이메일 알림; Fibo 1,2,3,4,5,6,7,11,21,
RelicusRoad Pro
Relicus LLC
4.63 (104)
이제 $ 147 (몇 가지 업데이트 후 $ 499 증가) - 무제한 계정 (PCS 또는 MACS) RelicusRoad 사용 설명서 + 교육 비디오 + 비공개 Discord 그룹 액세스 + VIP 상태 시장을 보는 새로운 방법 RelicusRoad는 외환, 선물, 암호화폐, 주식 및 지수에 대한 세계에서 가장 강력한 거래 지표로서 거래자에게 수익성을 유지하는 데 필요한 모든 정보와 도구를 제공합니다. 우리는 초보자부터 고급까지 모든 거래자가 성공할 수 있도록 기술적 분석 및 거래 계획을 제공합니다. 미래 시장을 예측할 수 있는 충분한 정보를 제공하는 핵심 거래 지표입니다. 우리는 차트에서 말이 안 되는 여러 지표 대신 완전한 솔루션을 믿습니다. 타의 추종을 불허하는 매우 정확한 신호, 화살표 + 가격 조치 정보를 표시하는 올인원 표시기입니다. 강력한 AI를 기반으로 하는 RelicusRoad는 누락된 정보와 도구를 제공하여 교육하고 성공적인 트레이더인 트레이딩 전문가가 되도
- Real price is 80$ - 40% Discount (It is 49$ now) - Lifetime update free Contact me for instruction, add group and any questions! Related Products:  Bitcoin Expert , Gold Expert - Non-repaint - I just sell my products in Elif Kaya profile, any other websites are stolen old versions, So no any new updates or support. Introduction The breakout and retest strategy is traded support and resistance levels. it involves price breaking through a previous level.  The break and retest strategy is design
Advanced Supply Demand
Bernhard Schweigert
4.91 (294)
현재 33% 할인! 초보자나 전문 트레이더를 위한 최고의 솔루션! 이 보조지표는 우리가 다수의 독창적 기능과 새로운 공식을 통합한 독특하고 고품질이며 저렴한 거래 도구입니다. 이 업데이트를 통해 이중 시간대를 표시할 수 있습니다. 더 높은 TF를 표시할 수 있을 뿐만 아니라 차트 TF와 더 높은 TF 모두를 표시할 수 있습니다: 중첩 영역 표시. 모든 Supply Demand 트레이더들이 좋아할 것입니다. :) 중요한 정보 공개 Advanced Supply Demand의 잠재력을 극대화하려면 다음을 방문하십시오. https://www.mql5.com/ko/blogs/post/720245   진입 또는 목표의 명확한 트리거 포인트를 정확히 찾아냄으로 해서 거래가 어떻게 개선될지 상상해 보십시오. 새로운 알고리즘을 기반으로 매수자와 매도자 간의 잠재적인 불균형을 훨씬 더 쉽게 분간할 수 있습니다. 왜냐하면 가장 강한 공급영역과 가장 강한 수요 영역과 과거에 어떻게 진행 되었는지를(이전
FX Power MT4 NG
Daniel Stein
4.94 (18)
FX Power: 통화 강세 분석으로 더 스마트한 거래 결정을 개요 FX Power 는 어떤 시장 상황에서도 주요 통화와 금의 실제 강세를 이해하기 위한 필수 도구입니다. 강한 통화를 매수하고 약한 통화를 매도함으로써 FX Power 는 거래 결정을 단순화하고 높은 확률의 기회를 발견합니다. 트렌드를 따르거나 극단적인 델타 값을 사용해 반전을 예측하고자 한다면, 이 도구는 귀하의 거래 스타일에 완벽히 적응합니다. 단순히 거래하지 말고, FX Power 로 더 스마트하게 거래하세요. 1. FX Power가 거래자에게 매우 유용한 이유 통화와 금의 실시간 강세 분석 • FX Power 는 주요 통화와 금의 상대적 강세를 계산하고 표시하여 시장 역학에 대한 명확한 통찰력을 제공합니다. • 어떤 자산이 앞서고 있고 어떤 자산이 뒤처지는지 모니터링하여 보다 현명한 거래 결정을 내릴 수 있습니다. 포괄적인 멀티 타임프레임 뷰 • 단기, 중기 및 장기 타임프레임에서 통화와 금의 강세를
KT Renko Patterns MT4
KEENBASE SOFTWARE SOLUTIONS
2.33 (3)
KT Renko Patterns는 렌코 차트를 벽돌 하나하나 분석하여, 전 세계 다양한 금융 시장에서 트레이더들이 자주 사용하는 유명한 차트 패턴들을 찾아냅니다. 시간 기반 차트와 비교하면, 렌코 차트는 시각적으로 단순하고 깔끔하여 패턴 중심의 트레이딩이 훨씬 쉽게 가능합니다. KT Renko Patterns에는 다양한 렌코 패턴이 포함되어 있으며, 이 중 상당수는 Prashant Shah의 저서 『Profitable Trading with Renko Charts』에서 자세히 설명되어 있습니다. KT Renko Patterns 인디케이터를 기반으로 한 100% 자동화된 EA는 여기에서 이용할 수 있습니다 - KT Renko Patterns EA . 기능 소개 최대 8개의 명확한 렌코 패턴을 거래할 수 있어, 혼동 없이 신뢰도 높은 트레이딩이 가능합니다. 객관성을 제공하기 위해 각 패턴에는 손절선과 피보나치 목표가 함께 제공됩니다. KT Renko Patterns는 각 패턴의 정
Quantum Breakout Indicator PRO
Bogdan Ion Puscasu
4.96 (26)
소개       Quantum Breakout PRO   , 브레이크아웃 존 거래 방식을 변화시키는 획기적인 MQL5 지표! 13년 이상의 거래 경험을 가진 숙련된 트레이더 팀이 개발한   Quantum Breakout PRO는   혁신적이고 역동적인 브레이크아웃 영역 전략으로 거래 여정을 새로운 차원으로 끌어올리도록 설계되었습니다. Quantum Breakout Indicator는 5개의 이익 목표 영역이 있는 브레이크아웃 영역의 신호 화살표와 브레이크아웃 상자를 기반으로 한 손절 제안을 제공합니다. 초보자 거래자와 전문 거래자 모두에게 적합합니다. Quantum EA 채널:       여기를 클릭하세요 MT5 버전 :   여기를 클릭하세요 중요한! 구매 후 설치 매뉴얼을 받으려면 개인 메시지를 보내주십시오. 추천: 기간: M15 통화쌍: GBPJPY, EURJPY, USDJPY,NZDUSD, XAUUSD 계정 유형: 스프레드가 매우 낮은 ECN, Raw 또는 Razo
MTF Supply Demand Zones
Georgios Kalomoiropoulos
4.82 (22)
자동화된 수요 및 공급 구역의 차세대. 모든 차트에서 작동하는 새롭고 혁신적인 알고리즘. 모든 구역은 시장의 가격 움직임에 따라 동적으로 생성됩니다. 두 가지 유형의 경고 --> 1)가격이 영역에 도달할 때 2)새로운 영역이 형성될 때 당신은 더 이상 쓸모없는 지표를 얻을 수 없습니다. 입증된 결과로 완벽한 거래 전략을 얻을 수 있습니다.     새로운 기능:     가격이 공급/수요 영역에 도달하면 경고     새로운 공급/수요 구역이 생성되면 알림     푸시 알림 알림     핍의 영역 너비 레이블     기동특무부대에 한 번 더 시간이 주어집니다. 따라서 현재보다 위의 2개의 시간 프레임 대신 현재보다 높은 3개의 시간 프레임을 볼 수 있습니다.     Alerts/Zones/MTF 기능을 활성화/비활성화하는 버튼 당신이 얻는 이점:     거래에서 감정을 제거하십시오.     거래 항목을 객관화하십시오.     높은 확률 설정을 사용하여 수익
Chart Patterns All in One
Davit Beridze
4.68 (19)
"Chart Patterns All in One"을 데모 모드에서 사용해보고 보너스를 받아보세요. 데모 모드에서 사용해본 후 메시지를 보내주시면 보너스를 드립니다. 구매 후 댓글을 남기시면 고품질의 인디케이터 8개를 보너스로 받으실 수 있습니다. Chart Patterns All-in-One 지표는 트레이더가 기술 분석에서 흔히 사용되는 다양한 차트 패턴을 시각화하는 데 도움을 줍니다. 이 지표는 잠재적인 시장 움직임을 식별하는 데 도움이 되지만, 수익성을 보장하지는 않습니다. 구매 전에 데모 모드에서 지표를 테스트하는 것이 좋습니다. 현재 할인 : "Chart Patterns All in One" 지표 50% 할인 중. 포함된 패턴 : 1-2-3 패턴 : 세 가지 주요 지점(고점 또는 저점)을 사용하여 시장 반전을 감지합니다. 매수 : 연속된 두 저점 이후, 이전 고점보다 낮은 고점이 발생할 때. 매도 : 연속된 두 고점 이후, 이전 저점보다 높은 저점이 발생할 때. 시각화 :
Matrix Arrow Indicator MT4
Juvenille Emperor Limited
5 (3)
매트릭스 화살표 표시기 MT4 는 외환, 상품, 암호 화폐, 지수, 주식과 같은 모든 기호/도구에 사용할 수 있는 100% 다시 칠하지 않는 다중 기간 표시기를 따르는 고유한 10 in 1 추세입니다.  Matrix Arrow Indicator MT4 는 다음과 같은 최대 10개의 표준 지표에서 정보와 데이터를 수집하여 초기 단계에서 현재 추세를 결정합니다. 평균 방향 이동 지수(ADX) 상품 채널 지수(CCI) 클래식 하이켄 아시 캔들 이동 평균 이동 평균 수렴 발산(MACD) 상대 활력 지수(RVI) 상대 강도 지수(RSI) 포물선 SAR 스토캐스틱 오실레이터 윌리엄스의 백분율 범위 모든 지표가 유효한 매수 또는 매도 신호를 제공하면 강력한 상승/하락 추세를 나타내는 다음 캔들/막대가 시작될 때 해당 화살표가 차트에 인쇄됩니다. 사용자는 사용할 표시기를 선택하고 각 표시기의 매개변수를 개별적으로 조정할 수 있습니다. 매트릭스 화살표 표시기 MT4는 선택한 표시기에서만 정보를 수
Reversal Master
Alexey Minkov
4.92 (13)
!SPECIAL SALE! The Reversal Master is an indicator for determining the current direction of price movement and reversal points. The indicator will be useful for those who want to see the current market situation better. The indicator can be used as an add-on for ready-made trading systems, or as an independent tool, or to develop your own trading systems. The Reversal Master indicator, to determine the reversal points,  analyzes a lot of conditions since the combined analysis gives a more accura
Apollo Secret Trend
Oleg Rodin
5 (6)
Apollo Secret Trend는 모든 쌍과 시간대의 추세를 찾는 데 사용할 수 있는 전문적인 추세 지표입니다. 지표는 거래를 선호하는 쌍이나 기간에 관계없이 시장 동향을 감지하는 데 사용할 수 있는 주요 거래 지표가 될 수 있습니다. 표시기의 특수 매개변수를 사용하여 개인 거래 스타일에 맞게 신호를 조정할 수 있습니다. 표시기는 PUSH 알림을 포함한 모든 유형의 경고를 제공합니다. 표시기의 신호는 다시 칠하지 마십시오! 제공된 스크린샷에서 과매수/과매도 오실레이터 표시기와 함께 Apollo Secret Trend 표시기를 볼 수 있습니다. 이 표시기는 제가 절대적으로 무료로 제공합니다. 구매 후 두 번째 과매수 및 과매도 오실레이터 표시기를 무료로 받으려면 저에게 연락하십시오! 또한 시스템 사용 방법에 대한 지침도 제공합니다. 나는 또한 당신에게 큰 보너스를 공유 할 것입니다!
제작자의 제품 더 보기
NNFX Trade Panel
Manuel Alejandro Cercos Perez
4.75 (4)
No Nonsense Forex 방법을 위한 트레이드 패널 차트를 깨끗하게 유지하면서 거래 속도를 향상시키십시오. 특징: -포지션 사이징:   매수/매도를 클릭하면 이 도구는 귀하의 위험에 가장 근접한 로트의 양으로 2개의 거래를 엽니다(각 거래에서 사용되는 잔액의 백분율). 핍 값 계산은 잊어버리세요! -SL 및 TP:   각 거래는 1.5*ATR에서 손절매로 시작되고 1*ATR에서 이익실현으로 두 절반 중 하나가 열립니다. 사용된 ATR 값은 일일 양초를 완료하는 데 4시간 미만이 남은 경우 현재 양초 중 하나이고, 그렇지 않은 경우 이전 양초 값입니다. - 손절매 업데이트:   손절매를 손익분기점으로 설정하거나 NNFX의 규칙에 따라 후행 손절매를 업데이트하십시오(가격이 2*ATR로 이동한 후 손절매를 1.5*ATR로 이동). -포지션 닫기:   종료 신호를 받으면 단 한 번의 클릭으로 모든 매수 또는 매도를 마감합니다. 기타 고려 사항: - 프로그램은 다른 전문가가 개설한
FREE
Easy Indis
Manuel Alejandro Cercos Perez
5 (2)
FREE
ATR to Baseline
Manuel Alejandro Cercos Perez
This indicator creates a channel relative to other chart indicator: indicator + ATR and indicator - ATR . Useful to know if price has gone up too far of your baseline. The ATR levels can be adjusted with a multiplier. It can also be applied to prices (close, open, high, low, median...) or other subwindow indicators. Actually you can get the same information about distances to baseline when applying it to close prices You can also get this indicator for MT4 (a bit more complex to use, but it can
FREE
Complete Trade Panel for the No Nonsense Forex method: This panel encapsulates almost all things you will need to execute your own NNFX algorithm, helping you trade even faster and easier. It has 3 parts: Symbol Panel Switch to any symbol in your charts quickly by pressing its name. Additional information can be displayed in the panel: currently open trades , correlation of those trades with other symbols (except if their stop loss is in breakeven or positive) and upcoming news (next daily candl
Universal Alerts MT5
Manuel Alejandro Cercos Perez
5 (2)
당신은 정말 좋은 지표를 가지고 있습니다 ...하지만 당신은 경고를 원하십니까? 신호를 제공했는지 확인하기 위해 표시기를 자세히 살펴보는 것이 지겹습니까? ... 그렇다면이 표시기가 당신을위한 것일 수 있습니다! Universal Alerts는 차트 표시기 중 하나를 분석하고 자체 매개변수에 따라 신호가 표시될 때 경고를 제공합니다. 이 표시기를 구성하면 매수/매도 신호가 있을 때마다 아이콘이 표시되고 다음에 오는 모든 신호는 경고를 생성하거나 메일을 보내거나 앱 알림을 보냅니다. 경고가 필요하지 않은 경우에도 이 표시기(또는 여러 인스턴스)를 사용하여 신호를 더 명확하게 표시하고 거래 경험 또는 백테스팅을 개선할 수 있습니다. 이 블로그에서 표시기의 가능한 설정에 대해 자세히 알아볼 수 있습니다. 특징 대부분의 지표   지원   : 라인 크로스오버, 레벨 크로스오버, 차트 신호, 색상 변경... 모든 유형의   알림   : 알림, 메일 또는 앱 알림 수신 여부를 선택합니다. 캔들
Synthetic Symbols
Manuel Alejandro Cercos Perez
5 (1)
터미널 기호(또는 사용자 지정 기호) 사이의 작업을 수행하여 사용자   지정 합성 기호   를 생성합니다   . 로그 스케일, 상대 성과(주식 대 SP500, 금 대 은...), 통화 지수... 가능성은 무한합니다! 초 단위로 기호와 상수 사이의 모든 수학 연산을 실행할 수 있습니다. 두 값 사이의 최소값[min(a,b)] 또는 최대값[max(a,b)]과 제곱근[sqrt(x)], 절대값[abs(x)], 로그 [logn(x) 또는 log10(x)] 또는 한 값의 가장 가까운 정수 [round(x)]. 버전 2.0부터 현재 기호에서 표시기를 선언하고 해당 값에 액세스할 수도 있습니다. 예를 들면 다음과 같습니다. $ma_indi = <MA> : 50,0,0 ;  #CURRENT -  indicator ($ma_indi, 0) 표시기 이름의 구문은 사용자 지정 표시기의 경우   폴더/이름   이고 터미널 표시기의 경우 "   < >   " 사이입니다. 사용하는 방법 "#" 문자로 시작하는
필터:
리뷰 없음
리뷰 답변