MACD by MK
- 지표
- Maxim Kuznetsov
- 버전: 1.0
- 활성화: 5
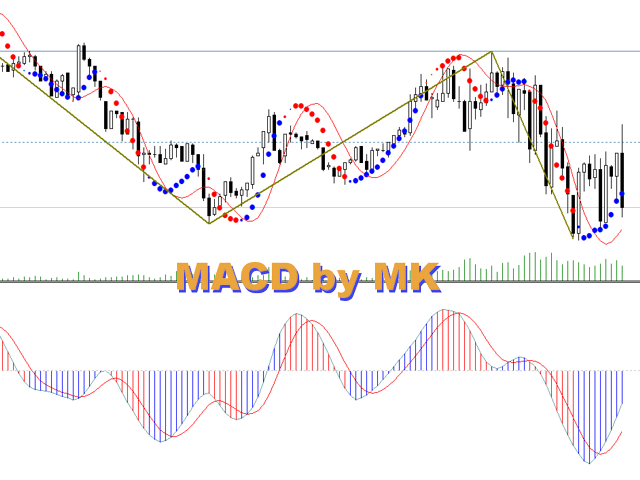
Use the opportunities of the MACD with maximum efficiency. Choose the price, filters and averaging method, all possible parameters. A unique feature of "MACD by MK"is the amplified signal line. The bends of the indicator have color designations and are additionally reflected on the main chart. By correlating them and the initial price, make your trading more qualitative. For ease of use, a neat ZigZag has been added
A remarkable property of "MACD by MK" is the detection of motion attenuation. As soon as the sales are completed, it is worth considering the possibility of buying. And vice versa. The indicator highlights these points very well.
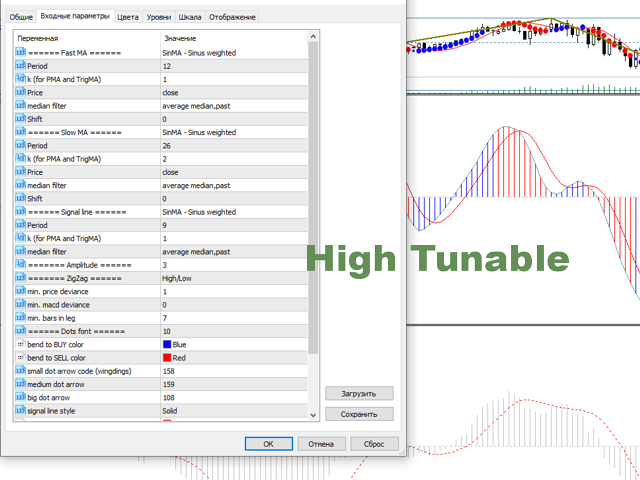
Like the classic MACD, this indicator is based on a comparison of two averages. You can choose the average from a wide number of options:
- the usual SMA,LWMA, EMA
- indicators FraMA,DEMA, TMA
- weighted Parabolic (weight~n^k), Sinus Weighted (weight~sin (n)^k)
- Volume weighted(weight~volume (n)^k)
- weighted by exponential coefficients (weight~exp(n))
As the source data, you can choose the prices of the usual candles or Heiken-Ashi candles, set the filtering method:
- the average of the last values of the
- median filter
- and their combinations
Additionally, you can specify the signal amplitude:
- at an amplitude of 1, the MACD on the main chart coincides with the fast MA
- at large values has a larger scope.
- accordingly, at the amplitude of 0, everything will coincide with the slow MA on the main chart
By default, the amplitude is 2.
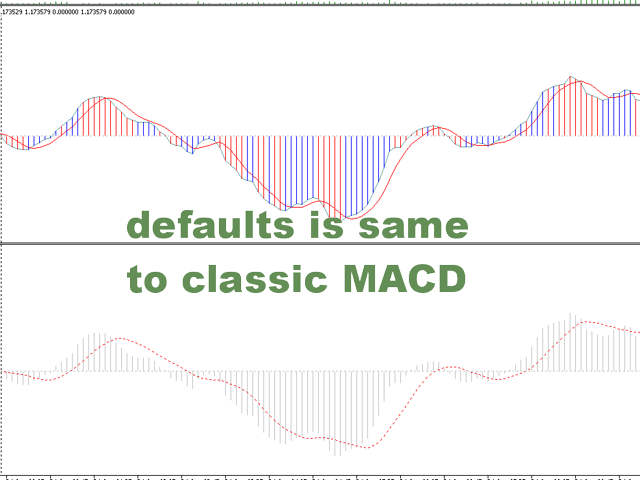
The "MACD by MK" indicator looks generally similar to the MACD and displays the difference between the two averages and its smoothed value (signal line).
The colors of the histogram indicate the direction of the signal line bend. Blue means that purchases are accelerating and sales are slowing down. That is, the signal line has an upward bend. Red on the contrary-in favor of sales
The main chart displays :
- dots are the strengthened values of the MACD. The color and size show the bending directions and stability
- line - enhanced signal line MACD
- zigzag - trend zigzag at prices, based on the indicator readings
Trading recommendations
Use the ZigZag as the trend direction
You enter the trend based on the color of the points and the position of the price relative to the signal line
Take into account the volatility of the symbol and the trading schedule
Good luck !


