MT5 Instrument backtester
- 지표
- Hubert Alphons Emonts
- 버전: 1.1
- 활성화: 5
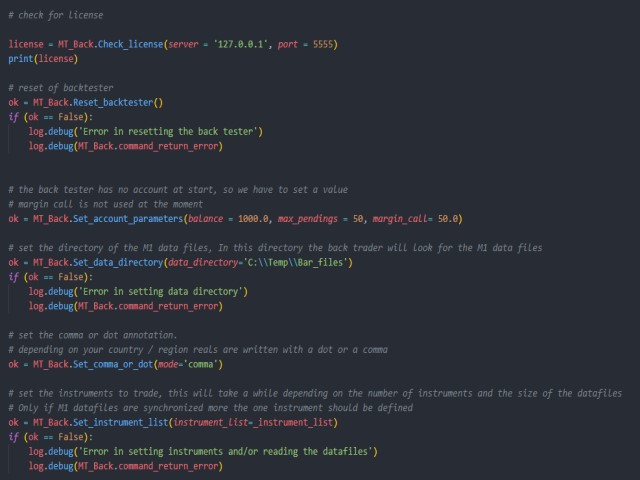
In combination with the BT you can test python strategies.
- The BT has a history of M1 bars from 2016 onwards (over 5 years, source DukasCopy).
- At this moment the history for the basic 28 instruments will be available.
- All time frames are deducted from these M1 bars (M5, M10, M15, M20, M30, H1, H2, H3, H4, H6, H8, H12, D1).
- Stepping through the history in M1 bar increment or multiple M1 bar increments.
- Orders and positions will be updated every increment.
- All history bars of the instruments are synchronized for multi instrument, multi timeframe testing.
- Opening & closing of trades (pendings, market).
- Tracking of minimum and maximum profit of open positions.
- Additional comments for trades, like open conditions and/or close conditions.
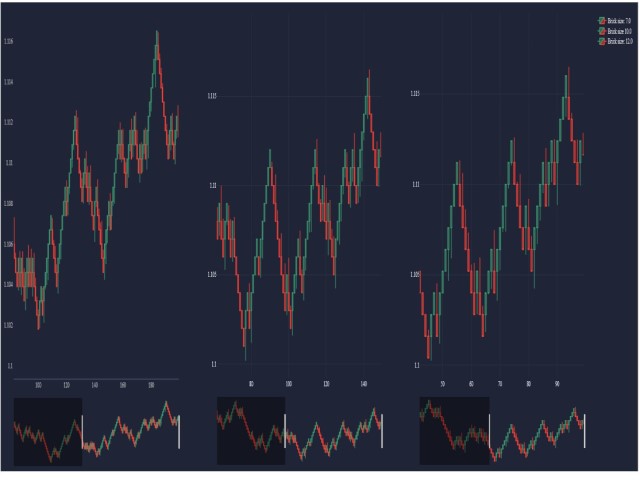
- Renko bars
- Planned
- Renko bars (3x different bricksizes in parallel), now implemented in version V1_02
- Red news (FF)
The communication between python script and windows app is by socket communicaton. The python script is the client.
Also a .DLL interface is available.
In demo the BT works full functionality for EURUSD, USDJPY and AUDNZD, for the other instruments a license is needed.
For persons having a licensed version of the Pytrader_API (MT4 or MT5) the BT is free of charge
There is also a MT4 version available.
For support we have a discord channel available. Discord channel.
The Windows app, python scripts, documentation, .... you can find here.
Best regards