Delta 2 Symbols MT5
- 지표
- VLADISLAV AKINDINOV
- 버전: 3.41
- 업데이트됨: 2 7월 2024
- 활성화: 5
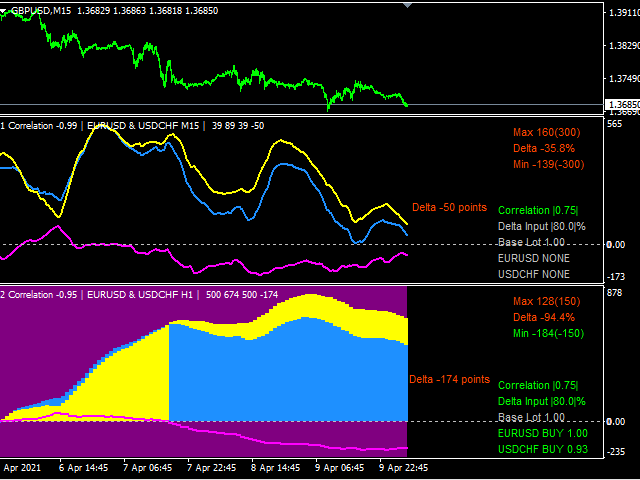
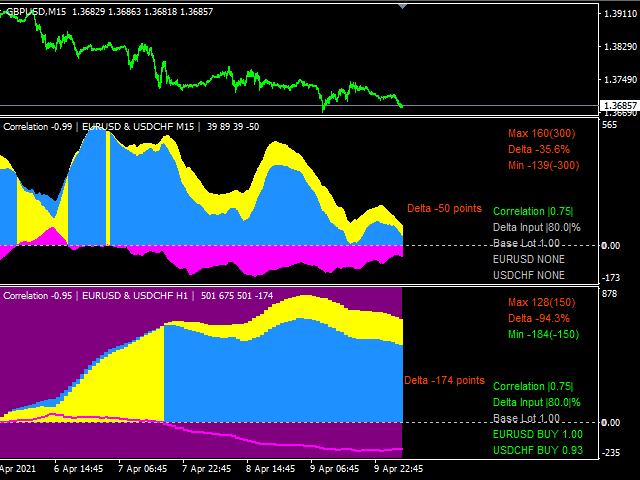
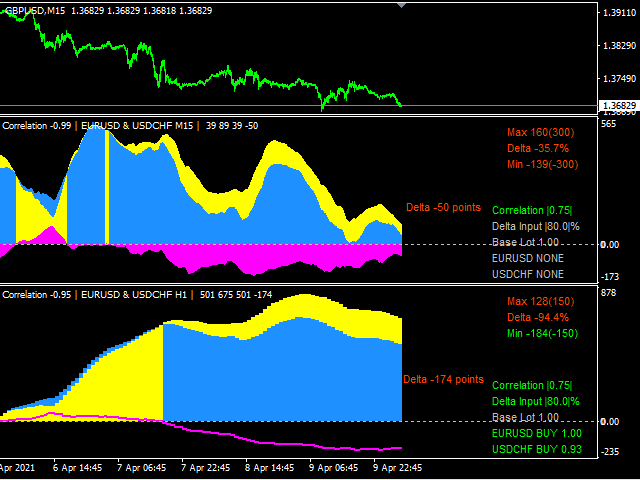
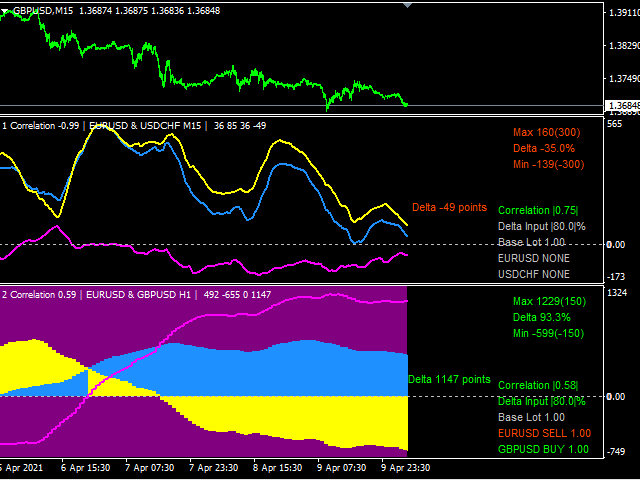
The indicator is designed for pair trading with 2 highly correlated instruments.
Indicator charts can be displayed as lines or histograms. There is an MTF mode, the maximum and minimum deltas for the calculated number of bars are displayed with a check for a specified minimum value. It is possible to enable the calculation of trade operations with checking the current correlation coefficient for the minimum specified, the current delta in points or percent of the maximum (minimum) delta and calculating lots (balancing) relative to the base one by the minimum tick value.
When the specified conditions are triggered, the direction of trade entry and the calculated lot are highlighted for each instrument. You can set the color of the chart subwindow when a trade signal is triggered for the convenience of finding the required indicator (disabled by clicking the mouse). It is possible to enable alert, send messages to e-mail or mobile terminal.
Link to the MT4 version: https://www.mql5.com/en/market/product/65332?source=Site+Profile+Seller