Tendency
- 지표
- Sajjad Karimi
- 버전: 3.0
- 업데이트됨: 17 6월 2022
- 활성화: 10
If you want to know what will happen in the future of the chart, you are in the right place. This indicator allows you to predict the future of the market with advanced computational methods and make the right deal by knowing the support and resistance points and receiving timely buy and sell signals.
What does "Tendency" indicator show us?
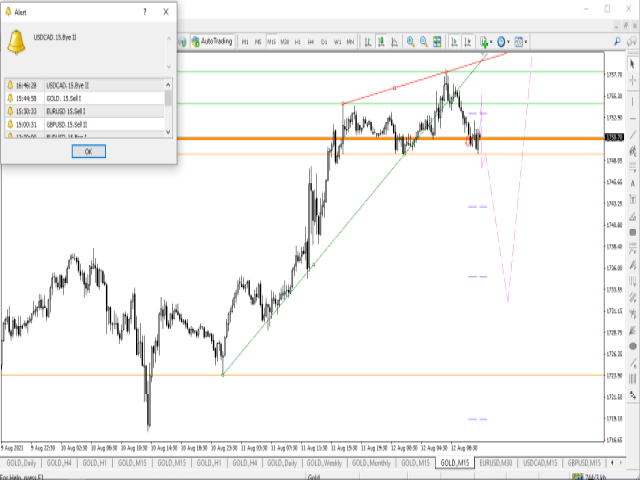
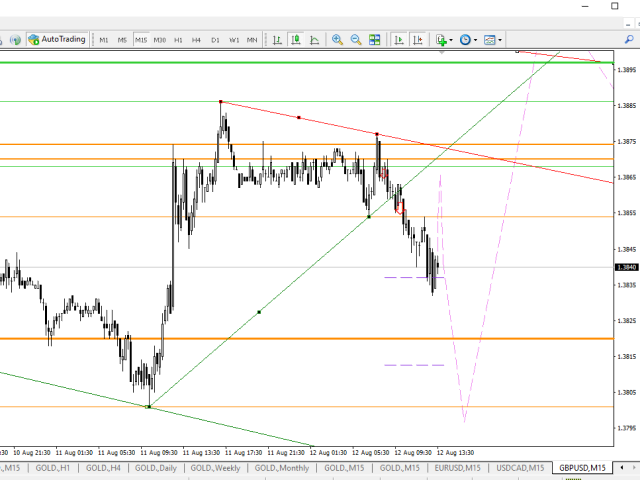
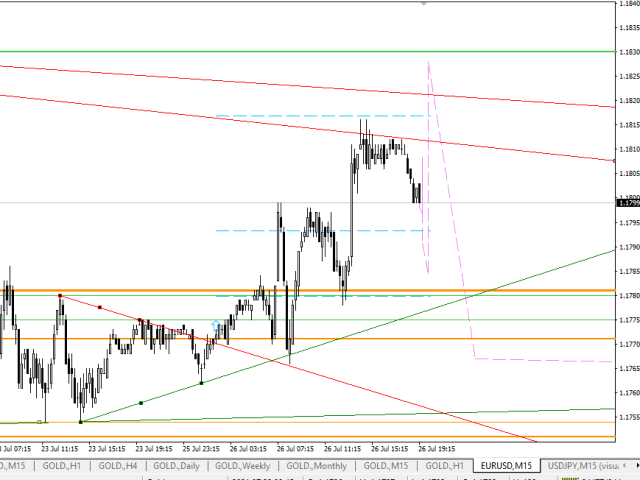
1. Prediction line: Using mathematical calculations, the price is predicted in different timeframes and is interconnected. This means that based on the previous movement of the market, the price movement is expected to be in line with the forecast line.
Although not all predictions happen accurately, these predictions largely indicate the direction of the market in the future. For example, if you are trading in a 15-minute timeframe, predicting the next 15 minutes alone is not very useful, but predicting the next 4 hours is very important for the trader. Smaller timeframes are always affected by larger timeframes, and therefore some predictions that are often contrary to the larger timeframe prediction do not materialize. When the prediction does not come true, it appears in the chart as a vertical wall, and when the price hits this wall, a sudden price movement occurs, which can be clearly seen in 1 minute time form.
*** Very Important: if you want to test The Indicator, use 6 months Last Dates. Prediction line used 1 Minutes Data and there is just 6 months History of 1 Minutes in MetaTrader 4 .
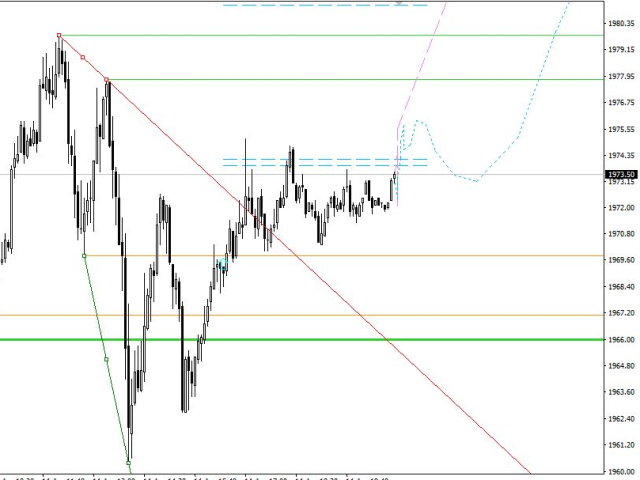
2.''Tendency line'' shows the market tendency at any given moment. When the "Tendency line" and the " Prediction line" show a same direction, it is probably the best time to enter the market.
3. Support and resistance levels: In 1-hour, 4-hour and daily time frames and Current timeframes, support, and resistance levels are specified and trend lines are drawn so that the trader can see all levels on a chart.
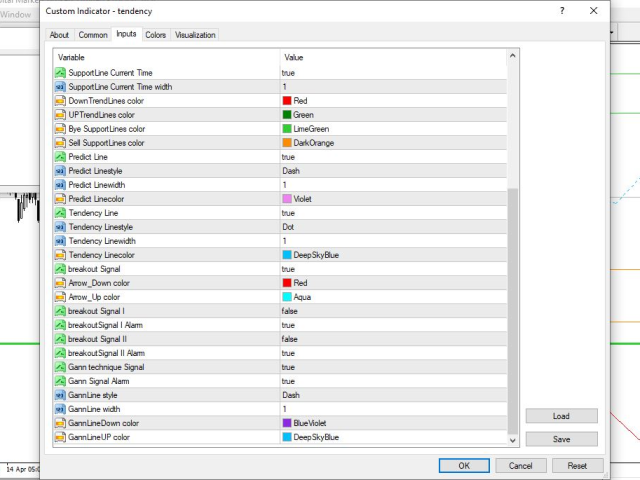
4. Signals: Time plays a very important role for any trader. Often the trader has to analyze several charts at the same time and therefore misses the right time to enter the trade. This indicator analyzes the charts and announces the appropriate time to enter the trade with an alarm. The trader then evaluates the signals and makes the trade.
Signal I: Every move in the market follows a specific target. Using the computational Gann technique, the first, second and third goals are calculated and shown on the chart. These targets are exact numbers, and according to the market reaction to the first target and the location of Kendall 1, it can be said whether the market will follow the next target or not.
Signal II: This signal is created by breaking the peak or floor. For many traders who use the price action method, this will be the entry point into the market.

