ParabolZZ
- 지표
- Ahmet Metin Yilmaz
- 버전: 2.0
- 업데이트됨: 5 8월 2021
- 활성화: 5
The parabolic SAR indicator, developed by J. Wells Wilder, is used by traders to determine trend direction and potential reversals in price. The indicator uses a trailing stop and reverse method called "SAR," or stop and reverse, to identify suitable exit and entry points. Traders also refer to the indicator as the parabolic stop and reverse, parabolic SAR, or PSAR.
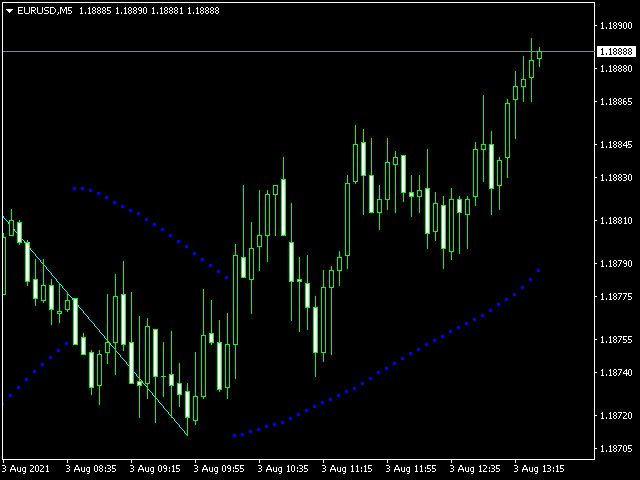
The parabolic SAR indicator appears on a chart as a series of dots, either above or below an asset's price, depending on the direction the price is moving. A dot is placed below the price when it is trending upward, and above the price when it is trending downward.
The ParabolZZ indicator uses ZigZag and SAR calculation logic together.
