Multi Chart MT4
- 지표
- Tais Miranda Hoffmann
- 버전: 1.10
- 업데이트됨: 21 2월 2022
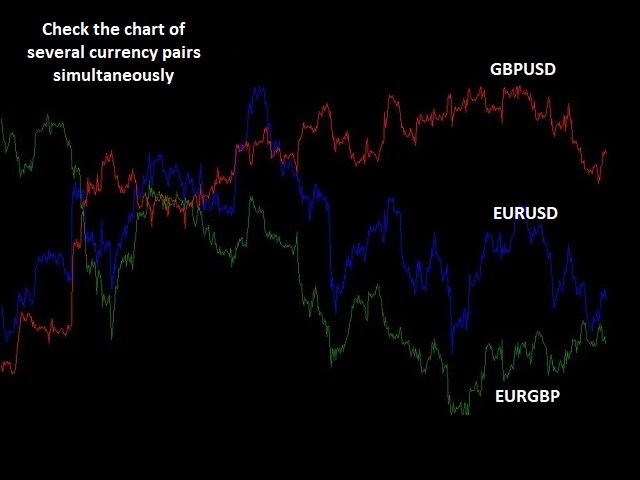
An indicator for analyzing different currency pairs simultaneously
Forex is a complex market that requires several currency pairs to be analyzed simultaneously
Determine the number of currency pairs yourself
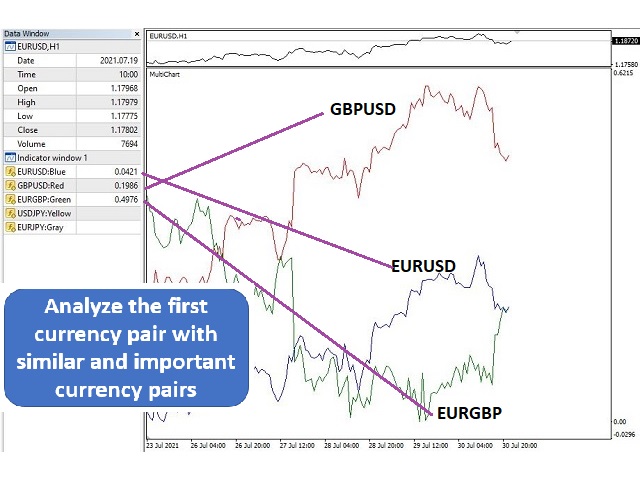
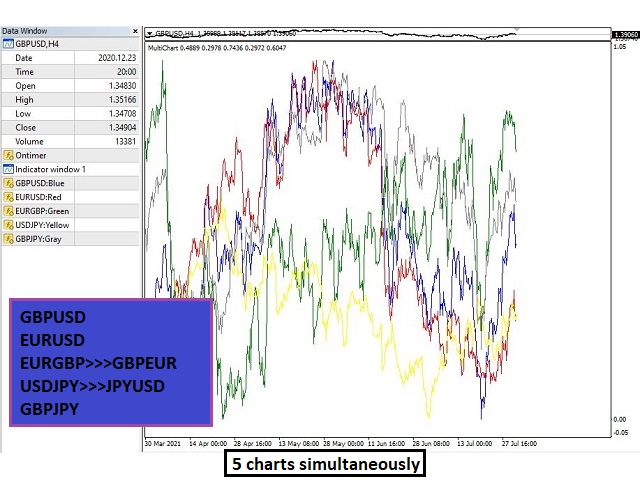
Determine the currency pair you want to analyze to analyze 4 of the most important and similar currency pairs at the same time.
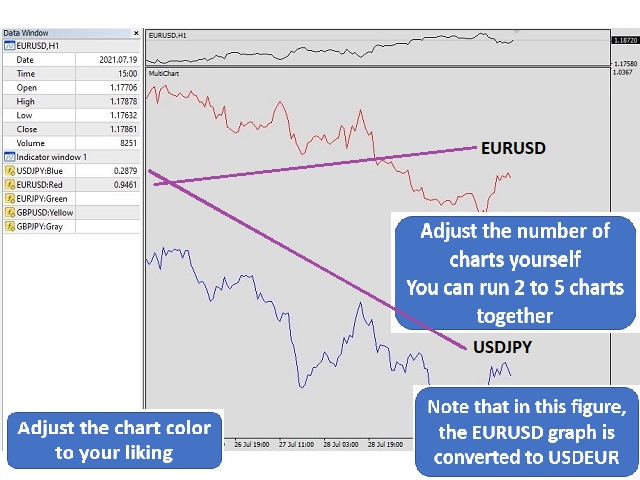
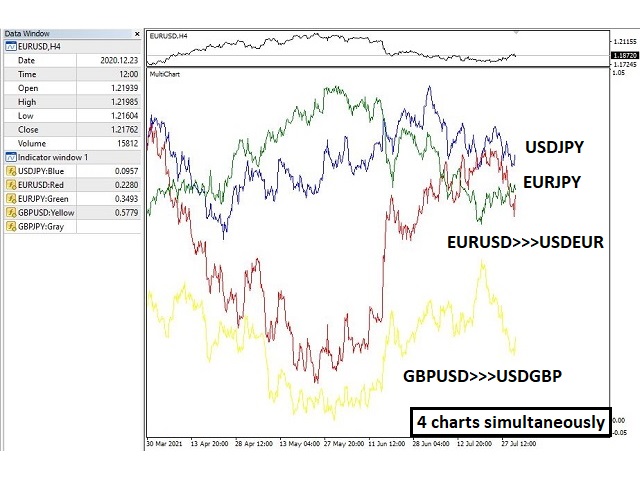
For direct and simple analysis, some currency pairs have changed (EURUSD>>>USDEUR)
Do not doubt that to succeed in this market, you must analyze several currency pairs at the same time to succeed
- The complexity of the Forex market
- Requires simultaneous analysis of several currency pairs
- It is also difficult to analyze opposite currency pairs ( EURUSD , USDJPY )
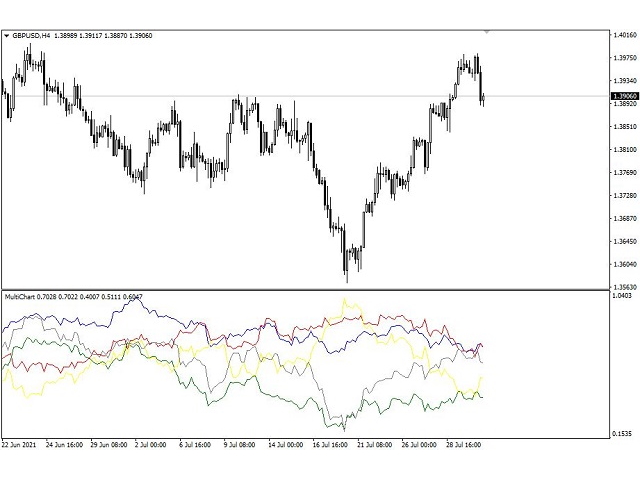
- Currency pair charts are linear
- Prices are based on the Close price of candles
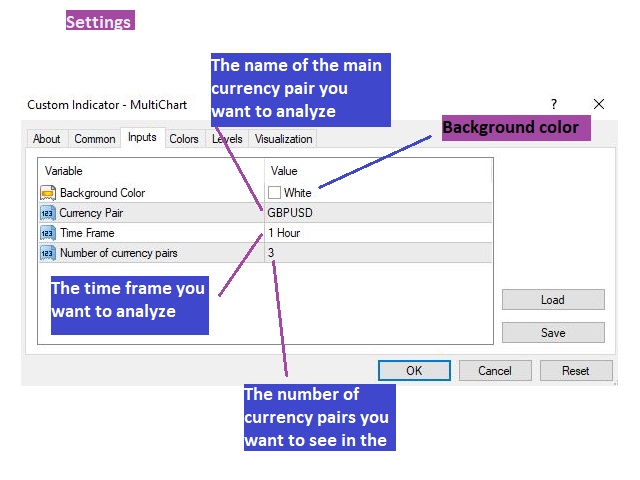
- You determine the main currency pair you want to analyze
- Other currency pairs are selected based on the original currency pair
- The charts of some currency pairs are reversed. For example, if you want to analyze the EURUSD pair, the chart of the USDJPY turns into the JPYUSD
- Determine the number of currency pairs you want to analyze at the same time
- You should analyze the displayed currency pair diagrams simultaneously in different ways (such as Price Action)
- Currency Pair ( Determine the main currency pair you want to analyze )
- Time Frame ( Specify the time frame you want to analyze )
- Number of currency pairs ( Determine the number of currency pairs you want to analyze at the same time )
- At the beginning of the work, try to analyze a small number of currency pairs first so that it is not difficult
- If there is a problem, tell me so I can fix it right away
- If the graph is not displayed correctly, your data is incomplete
- To avoid troubles, the number of candles that are initially displayed is small. For more analysis, run a back test.
- Can be used in all time frames
- With fast support
- With a simple and fast way of working
- With functional settings
- Why is the graph not displayed correctly? The amount of data you have in other currency pairs is small
- Which currency pairs should we download? Only the currency pairs you see in the data Window section
- Where is data Window Meta Trader? Press the "ctrl" + "D" at the same time
- What information does this part of data Window display? Pairs of currencies used. You can also see their color. See the photos to find out
- How to download the data of this currency pair? Just run the chart of that currency pair
- To run this indicator online, do you need to run chart all 5 currency pairs simultaneously? Yes, to run this indicator online, to download data online, you need to run the required currency pairs to download the data at the same time.
Deserve the rating.