MP Normal Distribution Multi TF MT5
- 지표
- Aleksandr Karelin
- 버전: 2.2
- 업데이트됨: 2 8월 2021
- 활성화: 5
MT4 version - https://www.mql5.com/ru/market/product/69932
Unlike other indicators of this type, this version has:
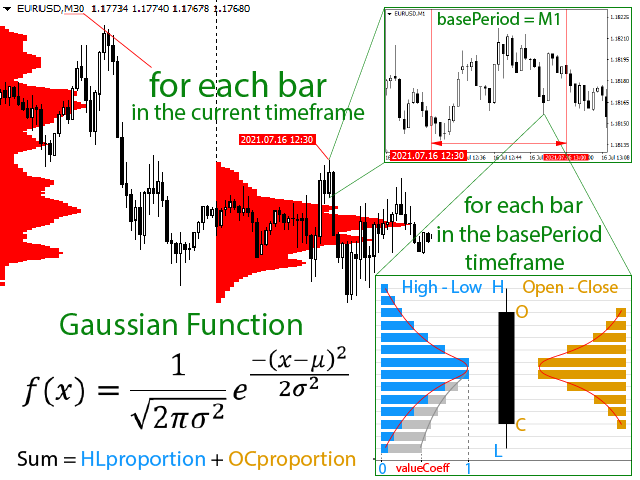
- The ability to display data from smaller timeframes on the current chart. For example, displaying data from the M1 period on the H1 chart.
- Calculation of values using the Gaussian formula (normal distribution formula).
- Flexible system of settings.
Settings:
- basePeriod - base period.
- indicatorMode - display mode. Sets the value of each interval: by4h (4 hours), by6h (6 hours), etc. Mode byDeep - the interval is equal to the number of analyseDeep bars.
- numberOfIntervals - number of intervals.
- zoomCoeff - allows you to compress/expand the display of the indicator.
- formulaType - calculation formula. Gaussian formula (_gaussianFunction) or √x (_sqrt) function.
- valueCoeff - the value (from 0 to 1) of the extreme point when calculating values for each bar level (see image 1).
- HLproportion - the proportion HL (High-Low) value in the total value for each bar level. The inequality HLproportion + OCproportion <= 1 must be observed.
- OCproportion - the proportion OC (Open-Close) value in the total value for each bar level. The inequality HLproportion + OCproportion <= 1 must be observed.
- smoothingDeep - smoothing depth.
- uniquePrefix - unique prefix.
- lineColor - color.
- analyseDeep - analysis depth when indicatorMode = byDeep