JS Equity
- 지표
- Joan Serfati
- 버전: 1.0
- 활성화: 10
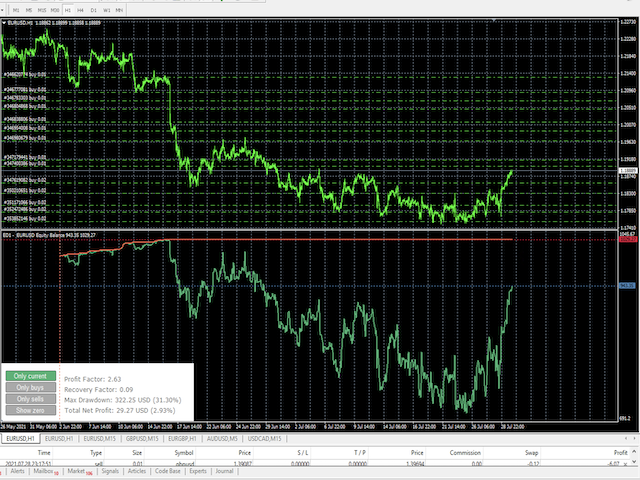
Indicator that will show your Balance, and your Equity. Really simple to use, no specific requirements to install it. However you can deeply configure it for your own wishes.
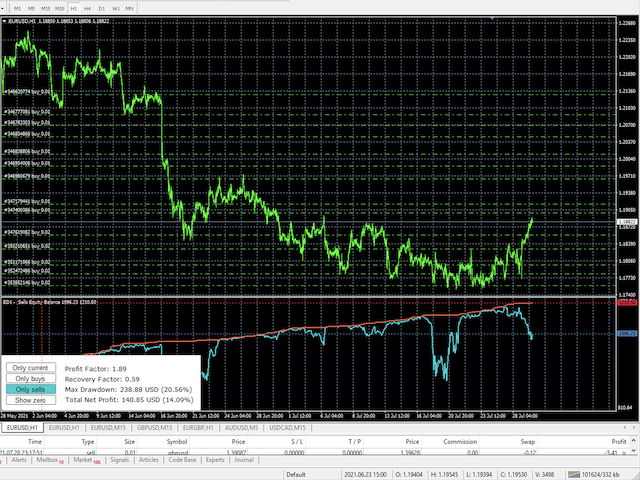
The pannel has 4 buttons. Only current will display the information of the chart you linked the indicator. If this is deselected, you will have the information of the whole account. Only Buys will display only the BUY orders and Only Sells will display only the SELL orders. Show Zero will display the 0 on the Y axis. It allows you to easily see the maximum Drawdown.
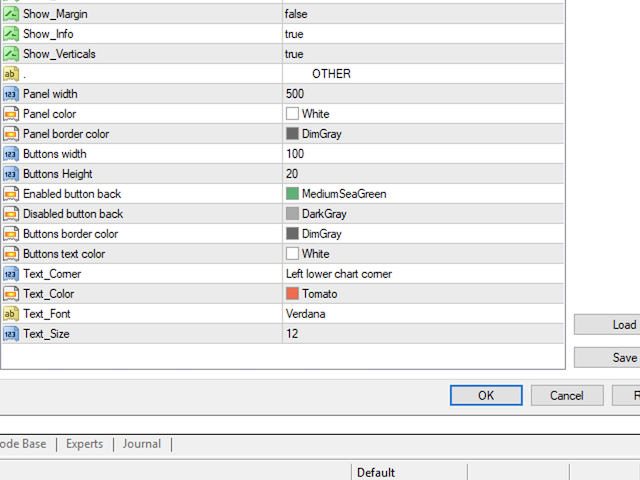
The pannel can be modified (color, size, text size, text font etc..)
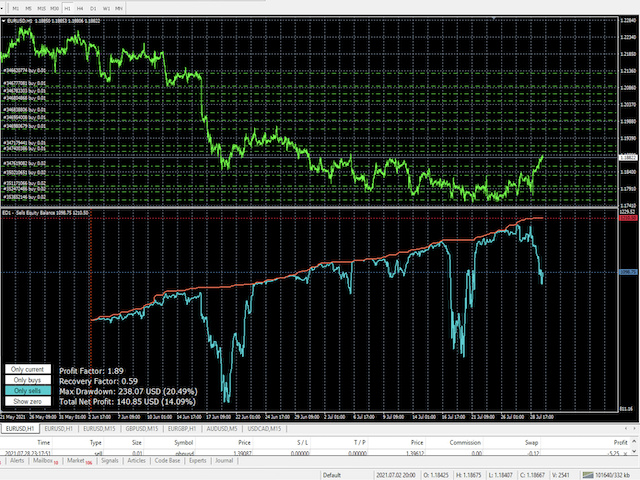
You can for exemple remove the white panel (as per shown in the picture bellow) in that case you will have to set the:
- Pannel_width = 0
- Text_color = white
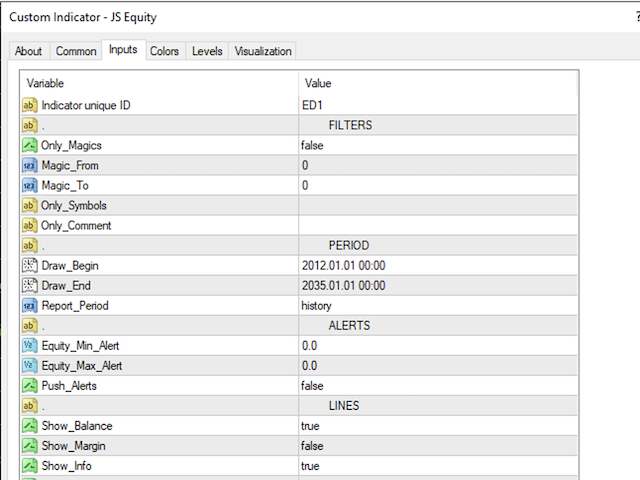
Other configuration available:
- FILTERING by magic number
- Filtering by comment
- Filtering by period
- ALERTS when the equity reaches a certain level
- Display BALANCE, MARGIN, VERTICAL LINES, INFORMATION.
- Configuration of the PANEL, BUTTONS and TEXT (size and color)

Amazing !!! This is exactly what I was looking for. It helped me a lot to control and manage each EA and currency pair.