Second Derivative RSI
- 지표
- Tatiana Savkevych
- 버전: 1.0
- 활성화: 5
Second Derivative RSI is a forex indicator based on all familiar RSI, based on the second derivative of the price function.
Just a note on the use of the indicator. The indicator requires selection of settings not only for each currency pair but also for each timeframe. If there is no setting, then as a last resort, the indicator may not show signals! In order to pick up the settings, just use a bot that will help you do it.
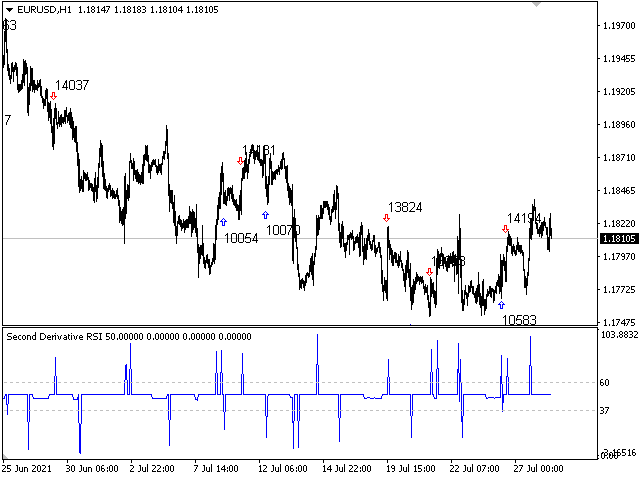
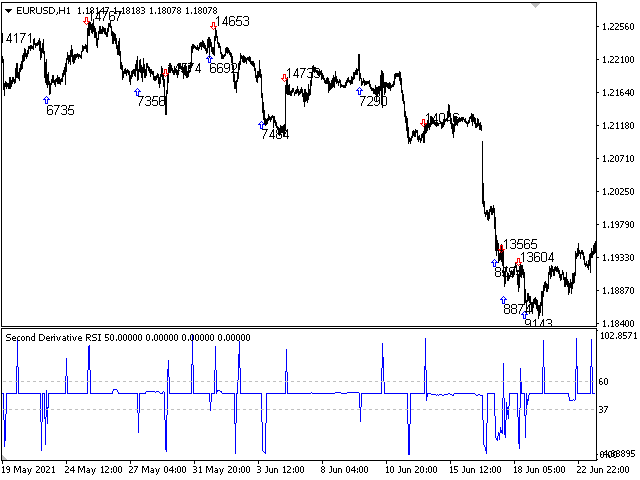
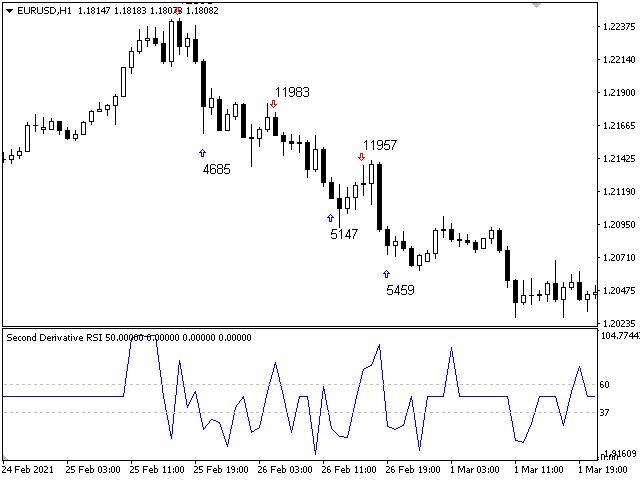
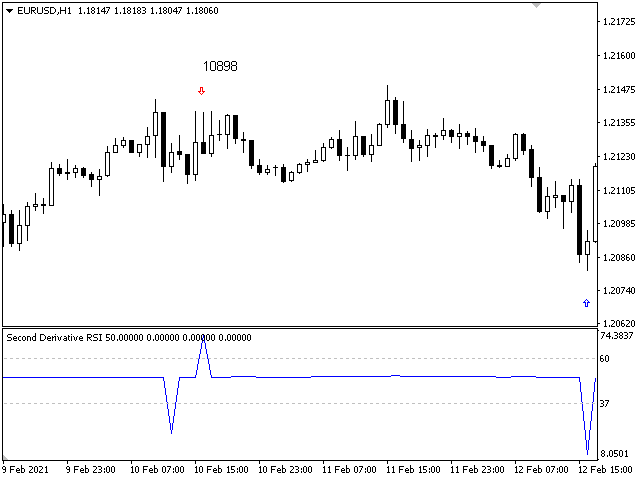
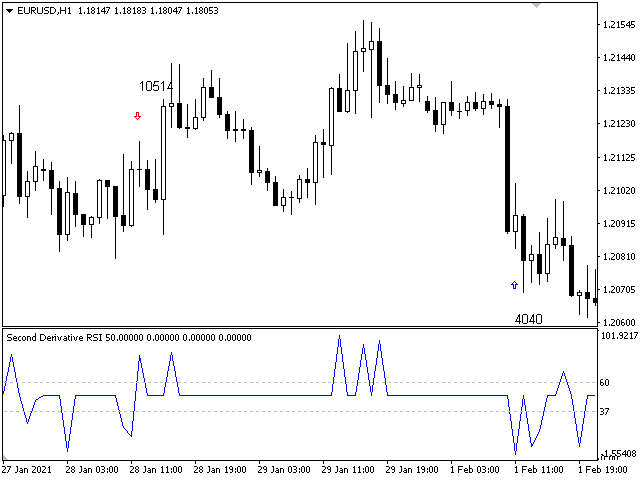
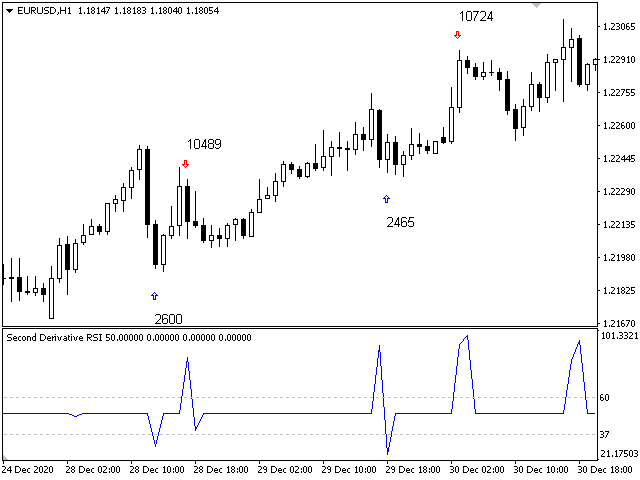
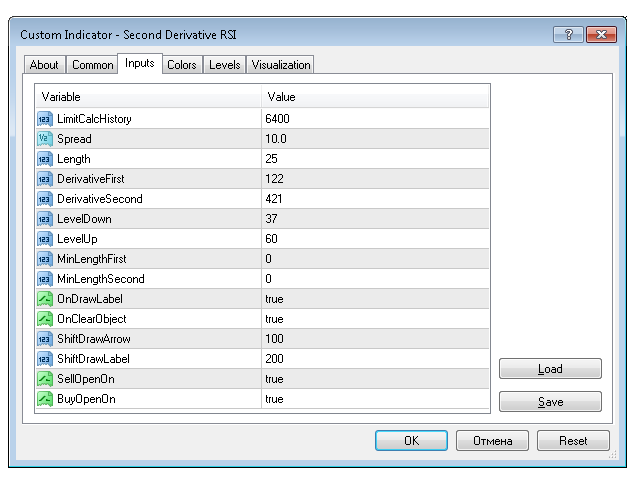
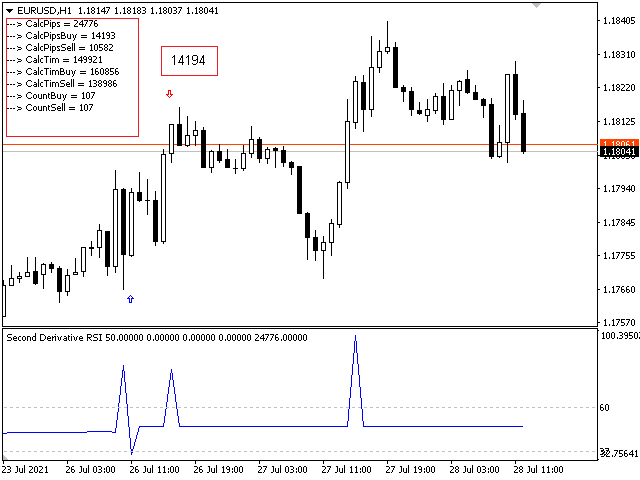
The indicator combines the functionality of an oscillator and a trend indicator. At the bottom of the chart, a part of the indicator similar to the RSI will be displayed, but only calculated as the second derivative of the price. In physical analogy, this is acceleration. On the chart itself, trend signals will be displayed by arrows, they are filtered by the algorithm and always alternate buy / sell. It also shows the number of profitable pips that the indicator can give at the specified interval (LimitCalcHistory). The indicator has a parameter (Spread), which deducts a part of the profit per spread for each signal.
To control the period of the RSI indicator, we will use the derivative of the derivative of the price function at a certain time interval (Length), which is the same as the second-order derivative. In differential, there are numerous second derivative, or second-order derivative, of a function (derivative of a derivative). While the analogy of the first derivative is speed, the analogy of the second derivative is acceleration. Roughly speaking, the second derivative measures how the rate of change of a quantity itself changes; for example, the second derivative of the vehicle's position in time is the instantaneous acceleration of the vehicle, or the speed at which the vehicle's speed changes with respect to time. In the graph of the function, the second derivative corresponds to the curvature or concavity of the graph. The graph of a function with a positive second derivative is concave upward, while a graph of a function with a negative second derivative bends in the opposite way.
After the mathematical transformation is made, we transform the result using the coefficient (DerivativeFirst and DerivativeSecond) to a value acceptable for the RSI indicator, and that's it! It is also possible to set the minimum oscillator level using the parameter (MinLengthFirst and MinLengthSecond).
For those who are only interested in the trend version of the indicator, you can buy it here.
For those who are interested in a bot based on this indicator, you can buy it here.
The main thing is to understand that the indicator parameters must be selected for each instrument and each timeframe.